

Home price growth has moderated amid rising interest rates and a narrow housing supply. Here's how prices compare to historical trends.


This graphic describes new U.S. renewable energy installations by state along with nameplate capacity, planned to come online in 2023.
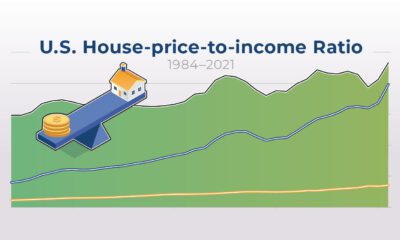

As U.S. house prices keep climbing, hitting 5.61 times the median annual income, affordable housing is getting harder and harder to find.
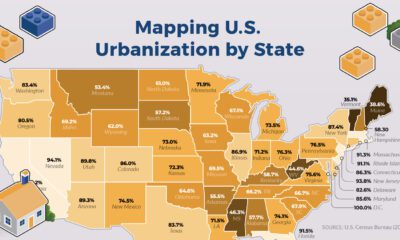

Pressures from urbanization in the U.S. housing supply continue, with homeowner vacancies falling to an all-time low of 0.8% by end of 2022.


This massive map highlights overseas territories and dependencies around the world and their sovereign states.


Can you picture what $31.4 trillion looks like? This graphic stacks up $1 bills to visualize U.S. debt in physical form.


In 2022, the sports betting market showed 75% increase in revenue. This growth is driven by innovative technologies and the legalization of sports betting in most...
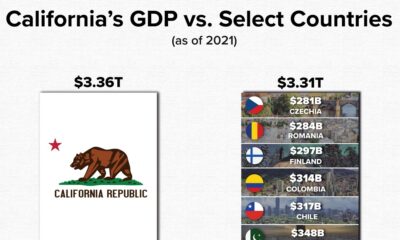

California’s GDP makes the state one of the most powerful economies in the world. This graphic compares it to the GDP of 10 select countries.


The U.S. labor market is remarkably strong, with a 3.4% unemployment rate. Which sectors are seeing the highest job gains in 2023?
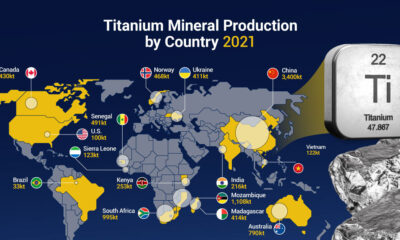

The global titanium supply chain is heavily dependent on Asian countries, including China. See where titanium comes from in this infographic.


 Creator Program