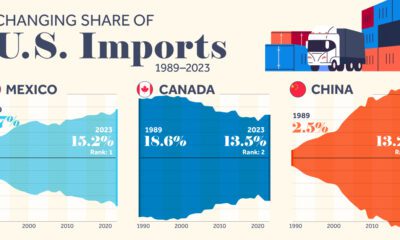

We highlight seven key U.S. trade partners and their changing share in the sources of U.S. imports from 1989–2023.
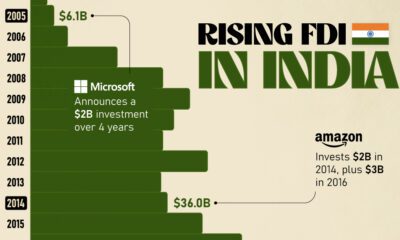

Mirroring the country's rapid economic growth, India's FDI (foreign direct investment) inflows have skyrocketed over the last twenty years.
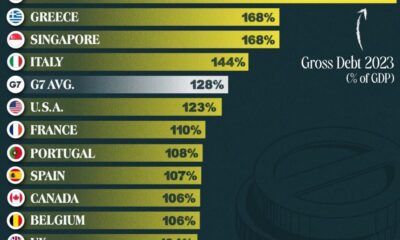

This graphic ranks government debt by country for advanced economies, using their gross debt-to-GDP ratio.


Services-producing industries account for the majority of U.S. GDP in 2023, followed by other private industries and the government.
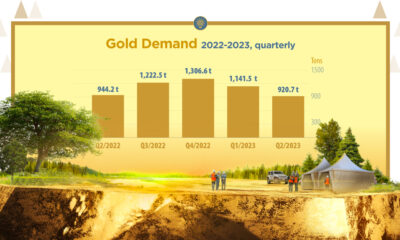

This infographic highlights the need for new gold mining projects and shows the next generation of America's gold deposits.


In this graphic, we visualize whether major electricity-consuming countries are on track to meet their 2030 renewable energy targets.
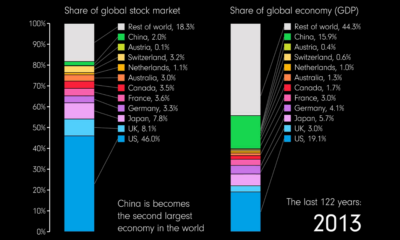

This animation compares countries' share of the global stock market and GDP over 122 years from 1900 to 2022.
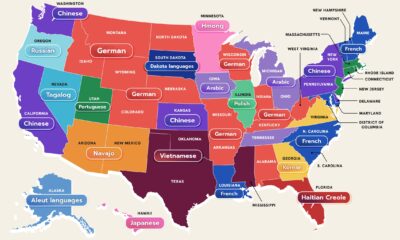

While 78% of Americans speak only English at home, between 350 and 430 languages can be found in the United States.
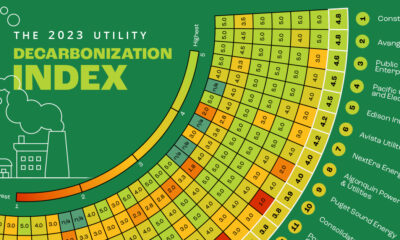

Here's a preview of the 2023 Utility Decarbonization Index, which tracks the decarbonization progress of the largest U.S. utilities.
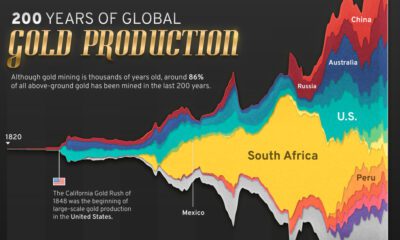

Global gold production has grown exponentially since the 1800s, with 86% of all above-ground gold mined in the last 200 years.


 Creator Program