Politics
The Global Inequality Gap, and How It’s Changed Over 200 Years
How the Global Inequality Gap Has Changed In 200 Years
What makes a person healthy, wealthy, and wise? The UN’s Human Development Index (HDI) measures this by one’s life expectancy, average income, and years of education.
However, the value of each metric varies greatly depending on where you live. Today’s data visualization from Max Roser at Our World in Data summarizes five basic dimensions of development across countries—and how our average standards of living have evolved since 1800.
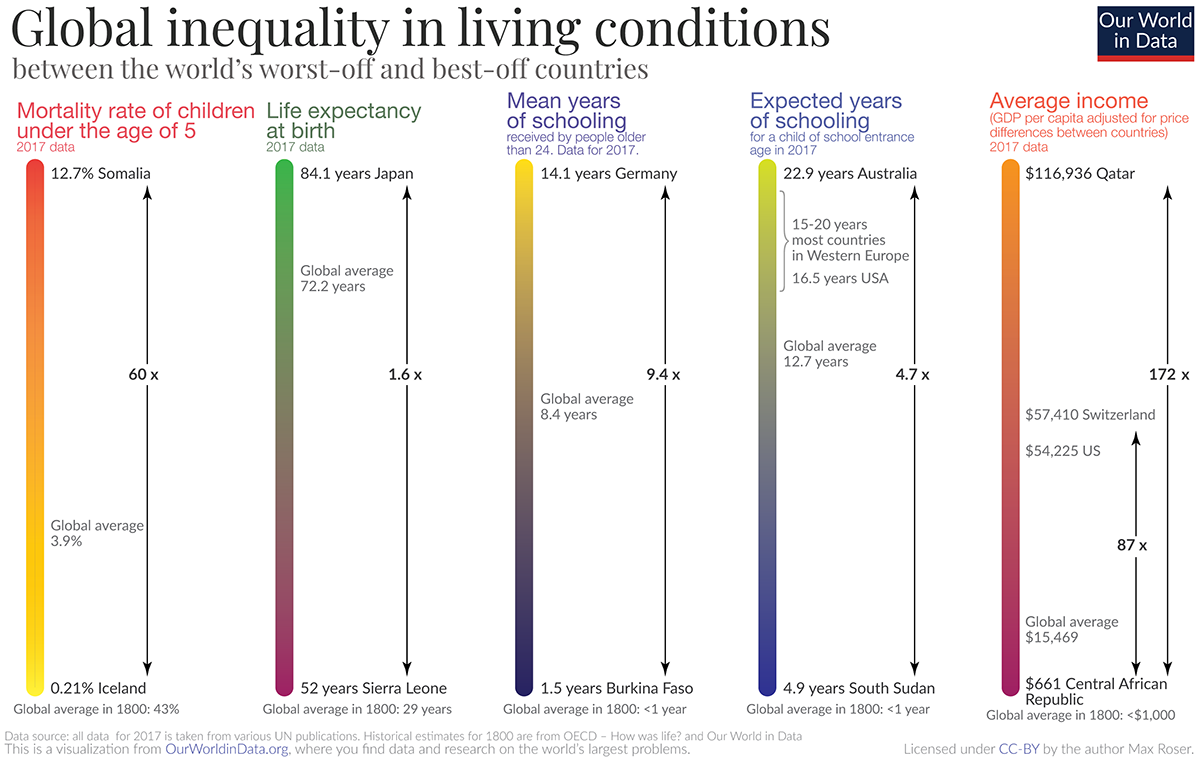
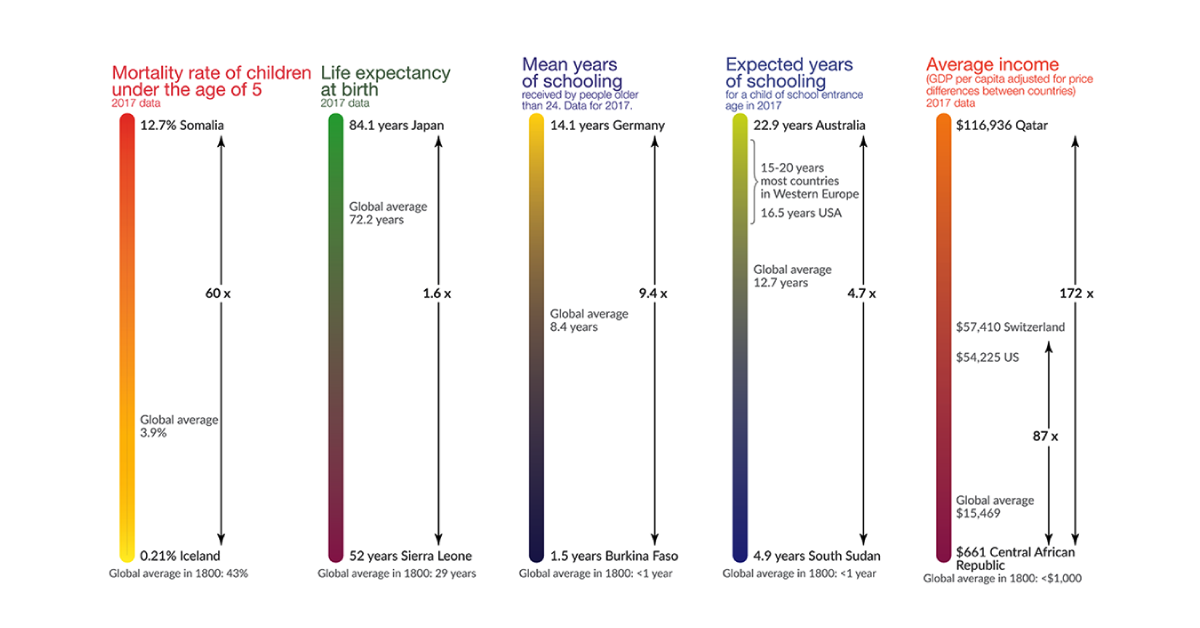
Health: Mortality Rates and Life Expectancy
Child mortality rates and life expectancy at birth are telltale signs of a country’s overall standard of living, as they indicate a population’s ability to access healthcare services.
Iceland stood at the top of these ranks in 2017, with only a 0.21% mortality rate for children under five years old. On the other end of the spectrum, Somalia had the highest child mortality rate of 12.7%—over three times the current global average.
While there’s a stark contrast between the best and worst performing countries, it’s clear that even Somalia has made significant strides since 1800. At that time, the global average child mortality rate was a whopping 43%.
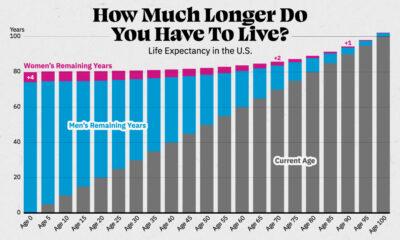
Lower child mortality is also tied to higher life expectancy. In 1800, the average life expectancy was that of today’s millennial—only 29 years old:
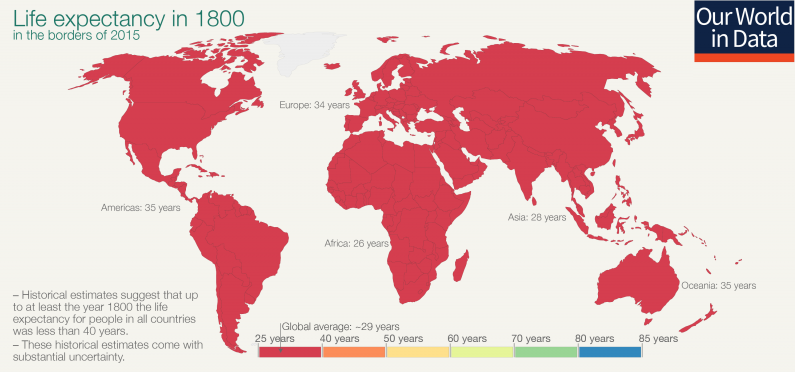
Today, the global average has shot up to 72.2 years, with areas like Japan exceeding this benchmark by more than a decade.
Education: Mean and Expected Years of Schooling
Education levels are measured in two distinct ways:
- Mean years: the average number of years a person aged 25+ receives in their lifetime
- Expected years: the total years a 2-year old child is likely to spend in school
In the 1800s, the mean and expected years of education were both less than a year—only 78 days to be precise. Low attendance rates occurred because children were expected to work during harvests, or contracted long-term illnesses that kept them at home.
Since then, education levels have drastically improved:
| Mean Years of Schooling | Expected Years of schooling | |
|---|---|---|
| Highest | Germany 🇩🇪: 14.1 years | Australia 🇦🇺: 22.9 years |
| Lowest | Burkina Faso 🇧🇫: 1.5 years | South Sudan 🇸🇸: 4.9 years |
| Global Average | 8.4 years | 12.7 years |
Research shows that investing in education can greatly narrow the inequality gap. Just one additional year of school can:
- Raise a person’s income by up to 10%
- Raise average annual GDP growth by 0.37%
- Reduce the probability of motherhood by 7.3%
- Reduce the likelihood of child marriage by >5 percentage points
Education has a strong correlation with individual wealth, which cascades into national wealth. Not surprisingly, average income has ballooned significantly in two centuries as well.
Wealth: Average GDP Per Capita
Global inequality levels are the most stark when it comes to GDP per capita. While the U.S. stands at $54,225 per person in 2017, resource-rich Qatar brings in more than double this amount—an immense $116,936 per person.
The global average GDP per capita is $15,469, but inequality heavily skews the bottom end of these values. In the Central African Republic, GDP per capita is only $661 today—similar to the average income two hundred years ago.
A Virtuous Cycle
These measures of development clearly feed into one another. Rising life expectancies are an indication of a society’s growing access to healthcare options. Compounded with more years of education, especially for women, this has had a ripple effect on declining fertility rates, contributing to higher per capita incomes.
People largely agree on what goes into human well-being: life, health, sustenance, prosperity, peace, freedom, safety, knowledge, leisure, happiness… If they have improved over time, that, I submit, is progress.
As technology accelerates the pace of change across these indicators, will the global inequality gap narrow more, or expand even wider?


Economy
The Bloc Effect: International Trade with Geopolitical Allies on the Rise
Rising geopolitical tensions are shaping the future of international trade, but what is the effect on trading among G7 and BRICS countries?


The Bloc Effect: International Trade with Allies on the Rise
International trade has become increasingly fragmented over the last five years as countries have shifted to trading more with their geopolitical allies.
This graphic from The Hinrich Foundation, the first in a three-part series covering the future of trade, provides visual context to the growing divide in trade in G7 and pre-expansion BRICS countries, which are used as proxies for geopolitical blocs.
Trade Shifts in G7 and BRICS Countries
This analysis uses IMF data to examine differences in shares of exports within and between trading blocs from 2018 to 2023. For example, we looked at the percentage of China’s exports with other BRICS members as well as with G7 members to see how these proportions shifted in percentage points (pp) over time.
Countries traded nearly $270 billion more with allies in 2023 compared to 2018. This shift came at the expense of trade with rival blocs, which saw a decline of $314 billion.
Country Change in Exports Within Bloc (pp) Change in Exports With Other Bloc (pp)
🇮🇳 India 0.0 3.9
🇷🇺 Russia 0.7 -3.8
🇮🇹 Italy 0.8 -0.7
🇨🇦 Canada 0.9 -0.7
🇫🇷 France 1.0 -1.1
🇪🇺 EU 1.1 -1.5
🇩🇪 Germany 1.4 -2.1
🇿🇦 South Africa 1.5 1.5
🇺🇸 U.S. 1.6 -0.4
🇯🇵 Japan 2.0 -1.7
🇨🇳 China 2.1 -5.2
🇧🇷 Brazil 3.7 -3.3
🇬🇧 UK 10.2 0.5
All shifts reported are in percentage points. For example, the EU saw its share of exports to G7 countries rise from 74.3% in 2018 to 75.4% in 2023, which equates to a 1.1 percentage point increase.
The UK saw the largest uptick in trading with other countries within the G7 (+10.2 percentage points), namely the EU, as the post-Brexit trade slump to the region recovered.
Meanwhile, the U.S.-China trade dispute caused China’s share of exports to the G7 to fall by 5.2 percentage points from 2018 to 2023, the largest decline in our sample set. In fact, partly as a result of the conflict, the U.S. has by far the highest number of harmful tariffs in place.
The Russia-Ukraine War and ensuing sanctions by the West contributed to Russia’s share of exports to the G7 falling by 3.8 percentage points over the same timeframe.
India, South Africa, and the UK bucked the trend and continued to witness advances in exports with the opposing bloc.
Average Trade Shifts of G7 and BRICS Blocs
Though results varied significantly on a country-by-country basis, the broader trend towards favoring geopolitical allies in international trade is clear.
Bloc Change in Exports Within Bloc (pp) Change in Exports With Other Bloc (pp)
Average 2.1 -1.1
BRICS 1.6 -1.4
G7 incl. EU 2.4 -1.0
Overall, BRICS countries saw a larger shift away from exports with the other bloc, while for G7 countries the shift within their own bloc was more pronounced. This implies that though BRICS countries are trading less with the G7, they are relying more on trade partners outside their bloc to make up for the lost G7 share.
A Global Shift in International Trade and Geopolitical Proximity
The movement towards strengthening trade relations based on geopolitical proximity is a global trend.
The United Nations categorizes countries along a scale of geopolitical proximity based on UN voting records.
According to the organization’s analysis, international trade between geopolitically close countries rose from the first quarter of 2022 (when Russia first invaded Ukraine) to the third quarter of 2023 by over 6%. Conversely, trade with geopolitically distant countries declined.
The second piece in this series will explore China’s gradual move away from using the U.S. dollar in trade settlements.
Visit the Hinrich Foundation to learn more about the future of geopolitical trade

-

 Economy3 days ago
Economic Growth Forecasts for G7 and BRICS Countries in 2024
The IMF has released its economic growth forecasts for 2024. How do the G7 and BRICS countries compare?
-

 United States2 weeks ago
Ranked: The Largest U.S. Corporations by Number of Employees
We visualized the top U.S. companies by employees, revealing the massive scale of retailers like Walmart, Target, and Home Depot.
-

 Economy2 weeks ago
Where U.S. Inflation Hit the Hardest in March 2024
We visualized product categories that saw the highest % increase in price due to U.S. inflation as of March 2024.
-

 Economy1 month ago
G20 Inflation Rates: Feb 2024 vs COVID Peak
We visualize inflation rates across G20 countries as of Feb 2024, in the context of their COVID-19 pandemic peak.
-

 Economy1 month ago
Mapped: Unemployment Claims by State
This visual heatmap of unemployment claims by state highlights New York, California, and Alaska leading the country by a wide margin.
-

 Economy2 months ago
Confidence in the Global Economy, by Country
Will the global economy be stronger in 2024 than in 2023?


-

 Debt1 week ago
How Debt-to-GDP Ratios Have Changed Since 2000
-

 Markets2 weeks ago
Ranked: The World’s Top Flight Routes, by Revenue
-

 Demographics2 weeks ago
Population Projections: The World’s 6 Largest Countries in 2075
-

 Markets2 weeks ago
The Top 10 States by Real GDP Growth in 2023
-

 Demographics2 weeks ago
The Smallest Gender Wage Gaps in OECD Countries
-
Economy2 weeks ago
Where U.S. Inflation Hit the Hardest in March 2024
-

 Green2 weeks ago
Top Countries By Forest Growth Since 2001
-
United States2 weeks ago
Ranked: The Largest U.S. Corporations by Number of Employees