Healthcare
Animation: Global Life Expectancy (1950-2021)
Article/Editing:
Animated Chart: Global Life Expectancy (1950-2021)
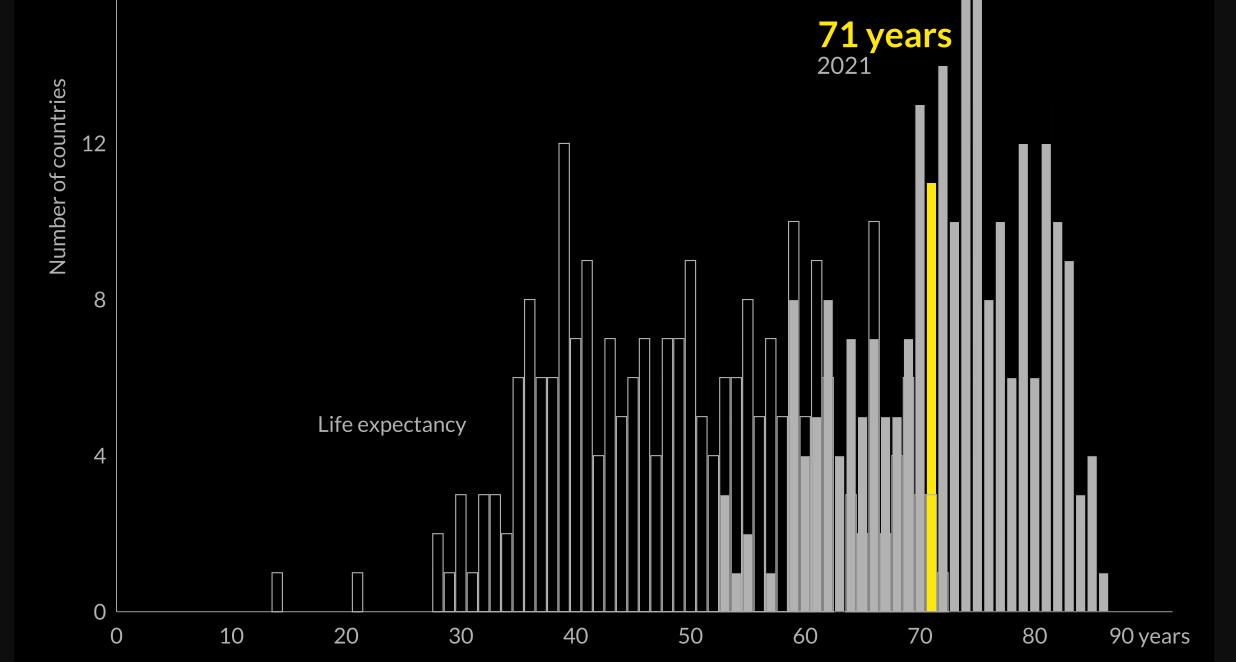
At a glance, life expectancy has been increasing worldwide over the last 70 years. But when you break it down by region and by sex, a clear yet variable gap in life expectancy emerges.
Using data from Our World in Data, these graphics by Pablo Alvarez provide both a breakdown of average life expectancies worldwide, as well as a more granular view that looks at the life expectancy of men and women across different continents.
Life Expectancy, by Continent and Sex
In the 1800s, the average life expectancy at birth was just 40 years.
Over the last 200 years, average life expectancies have nearly doubled, largely thanks to improvements in healthcare, sanitation, and global medical practices.
However, increases in life spans have not been consistent across the sexes—around the world, women now live 5.4 years longer than men do on average. And in certain parts of the world, this gap is even wider.
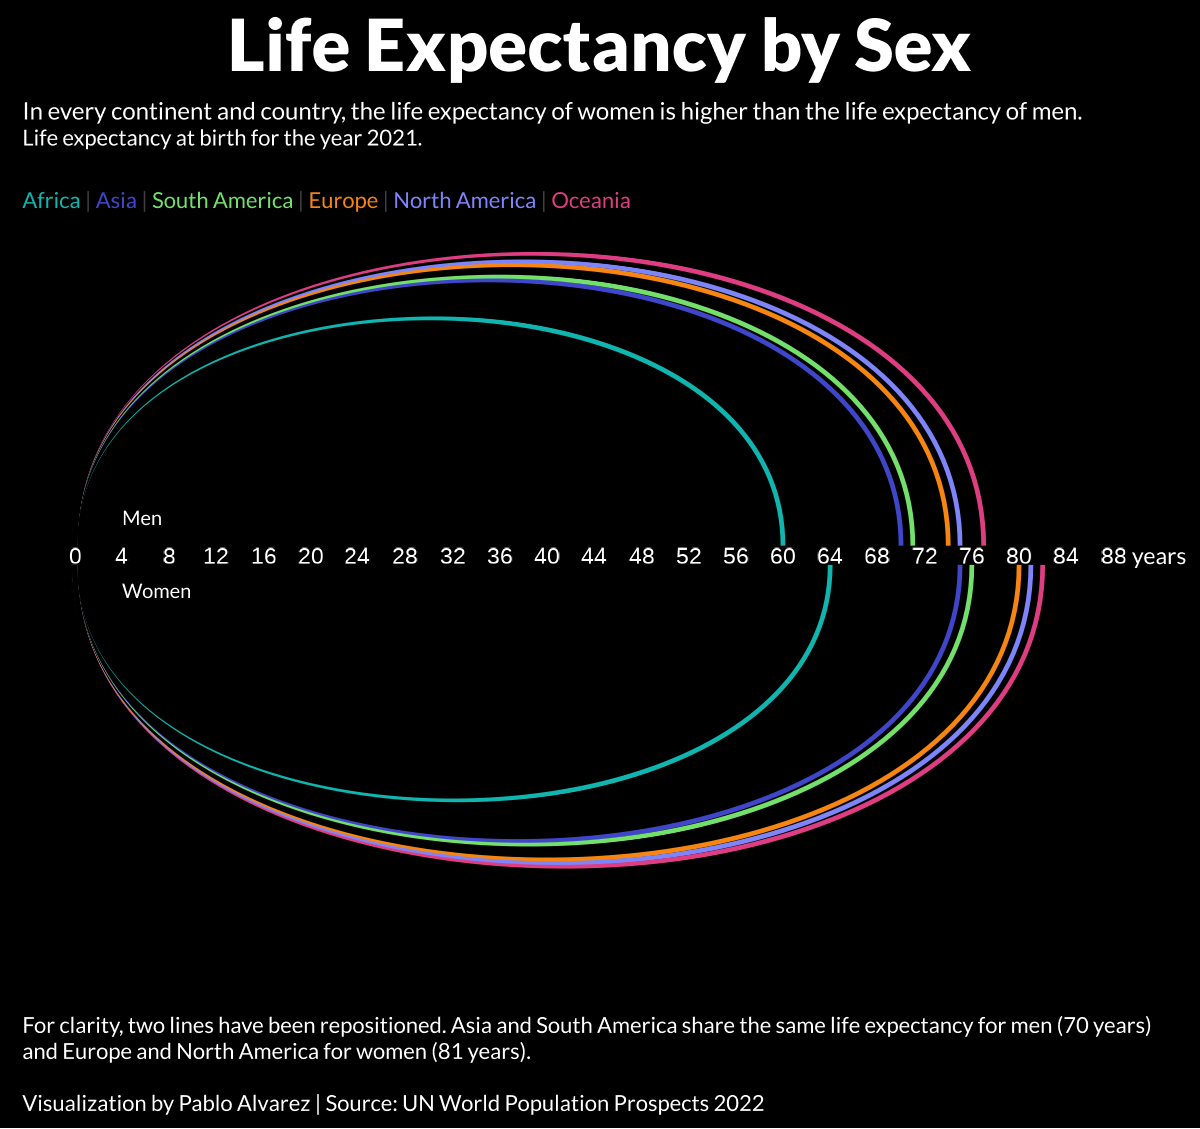
For instance, in South America, the average life expectancy for women is seven years longer than it is for men.
Here is the continental breakdown, with data by continent for both male and females:
| Life Expectancy by Region (2021) | Life expectancy at birth, females (years) | Life expectancy at birth, males (years) |
|---|---|---|
| Africa | 64 | 60 |
| Asia | 75 | 70 |
| Europe | 81 | 74 |
| North America | 81 | 75 |
| Oceania | 82 | 77 |
| South America | 76 | 70 |
| Global Average | 74 | 68 |
What’s causing this discrepancy in life expectancy between men and women?
Theories to Explain the Gap
While scientists don’t know the exact reason for the gap in average life expectancy between sexes, research has put forward a few leading theories. They indicate that the gap is caused by a mix of biological and societal influences:
Biological Factors
According to Our World in Data, there are several genetic and hormonal differences between men and women that may impact longevity.
Because of higher estrogen levels and chromosomal differences, women tend to have more “subcutaneous fat” in their bodies, which is fat that’s carried directly under their skin.
In contrast, men tend to have more “visceral fat,” or fat that surrounds internal organs—which is linked to cardiovascular disease, making men more prone to health risks like heart attacks.
Societal Factors
There are also a number of societal factors that could be contributing to lower life expectancy levels for men.
According to Dr. Perminder Sachdev, a professor of neuropsychiatry who studied human longevity, men are “more likely to smoke, drink excessively, and be overweight.” Dr. Sachdev adds that men are also “less likely to seek medical help early, and, if diagnosed with a disease, they are more likely to be non-adherent to treatment.”
In addition to these aggravated health risks, research also indicates that men are more likely to die in car crashes and fights than women. Further, they tend to disproportionately work in dangerous professions, with men being 10 times more likely to be killed on the job than women.
What’s the biggest contributor of all these factors? It’s worth noting that none of these theories are mutually exclusive, meaning it’s likely a mixture of all of the above—however, the weighting of each factor is currently unknown.

This article was published as a part of Visual Capitalist's Creator Program, which features data-driven visuals from some of our favorite Creators around the world.


Healthcare
The Cost of an EpiPen in Major Markets
This visualization compares EpiPen prices around the world, with the U.S. having the highest prices by far.


The Cost of an EpiPen in Major Markets
This was originally posted on our Voronoi app. Download the app for free on iOS or Android and discover incredible data-driven charts from a variety of trusted sources.
EpiPens are auto-injectors containing epinephrine, a drug that can treat or reverse severe allergic reactions, potentially preventing death.
The global epinephrine market was valued at $1.75 billion in 2022 and is projected to reach $4.08 billion by 2030. North America represents over 60% of the market.
EpiPens, however, can be prohibitively expensive in some regions.
In this graphic, we present estimated EpiPen prices in major global markets, compiled by World Population Review and converted to U.S. dollars as of August 2023.
Why are U.S. Prices so High?
The U.S. stands out as the most expensive market for EpiPens, despite over 1 million Americans having epinephrine prescriptions. After Mylan (now part of Pfizer) acquired the rights to produce EpiPens in the U.S. in 2007, the cost of a two-pack skyrocketed to $600, up from about $60.
| Country | Price (USD) |
|---|---|
| 🇺🇸 U.S. | 300* |
| 🇯🇵 Japan | 98 |
| 🇩🇪 Germany | 85 |
| 🇨🇦 Canada | 80 |
| 🇫🇷 France | 76 |
| 🇦🇺 Australia | 66 |
| 🇬🇧 UK | 61 |
| 🇮🇳 India | 30 |
*Per unit cost. Commonly sold as a two-pack, meaning total cost is equal to $600
Former Mylan CEO Heather Bresch defended the price hikes to Congress, citing minimal profit margins. Mylan eventually settled with the U.S. government for a nine-figure sum.
Notably, EpiPens are available at a fraction of the cost in other developed countries like Japan, Germany, and Canada.
Making EpiPens More Affordable
Efforts to improve EpiPen affordability are underway in several U.S. states. For instance, the Colorado House approved a $60 price cap on epinephrine, now under review by the state Senate.
Similar measures in Rhode Island, Delaware, Missouri, and Vermont aim to ensure insurance coverage for epinephrine, which is not currently mandatory, although most health plans cover it.

-

 Debt1 week ago
How Debt-to-GDP Ratios Have Changed Since 2000
-

 Markets2 weeks ago
Ranked: The World’s Top Flight Routes, by Revenue
-

 Countries2 weeks ago
Population Projections: The World’s 6 Largest Countries in 2075
-

 Markets2 weeks ago
The Top 10 States by Real GDP Growth in 2023
-

 Demographics2 weeks ago
The Smallest Gender Wage Gaps in OECD Countries
-

 United States2 weeks ago
Where U.S. Inflation Hit the Hardest in March 2024
-

 Green2 weeks ago
Top Countries By Forest Growth Since 2001
-

 United States2 weeks ago
Ranked: The Largest U.S. Corporations by Number of Employees