Money
Visualizing Global Attitudes Towards Retirement
Global Attitudes Towards Retirement
There’s a reason retirement is often referred to as the golden years.
Many view retirement as a welcome reward following a successful career. The transition, however, is not always easy. An enjoyable retirement is often dictated by the amount of money people have set aside.
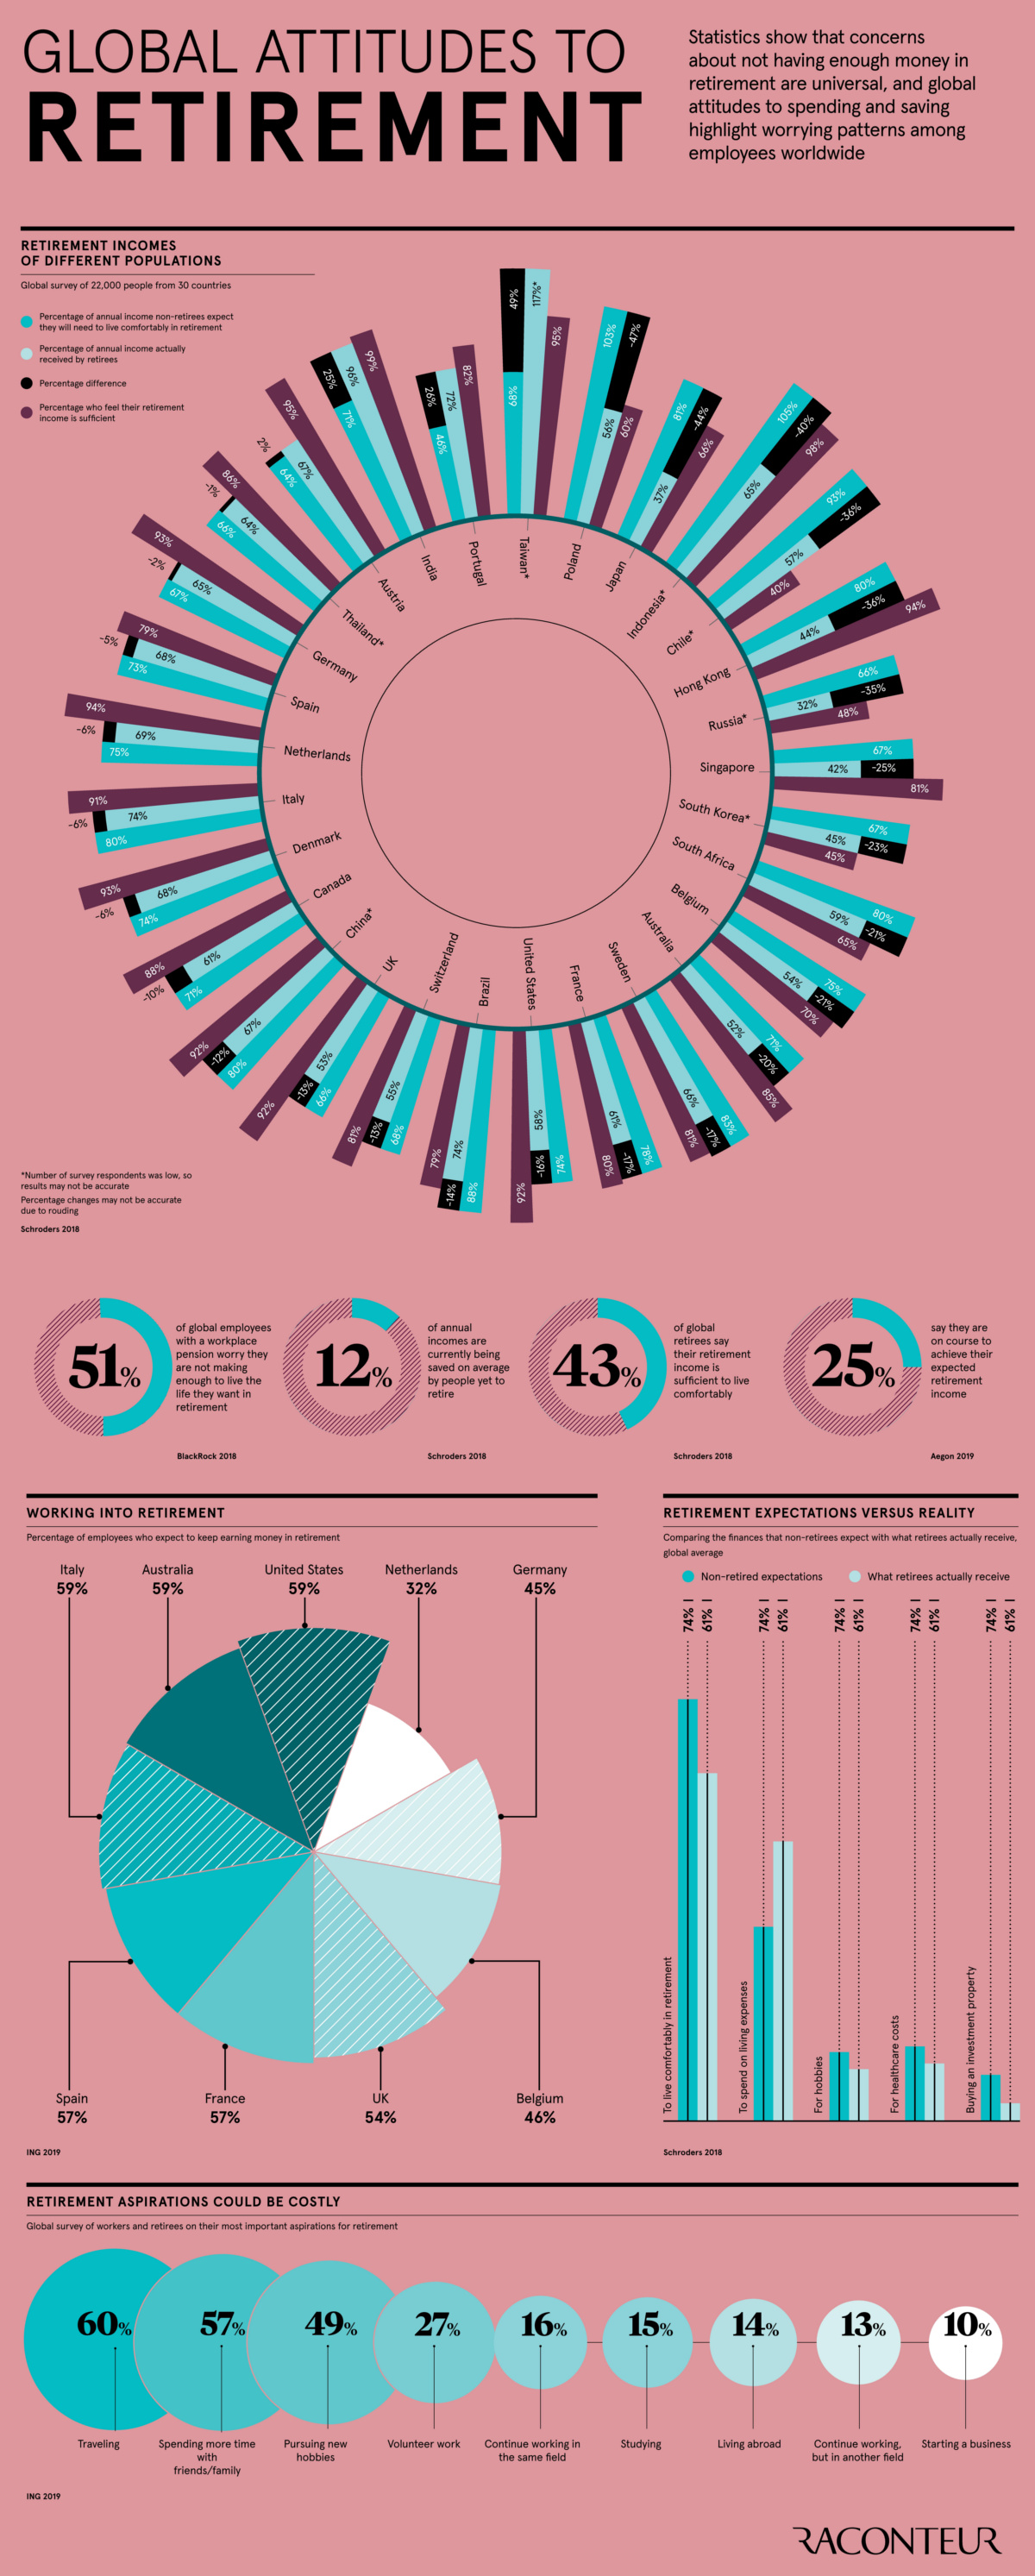
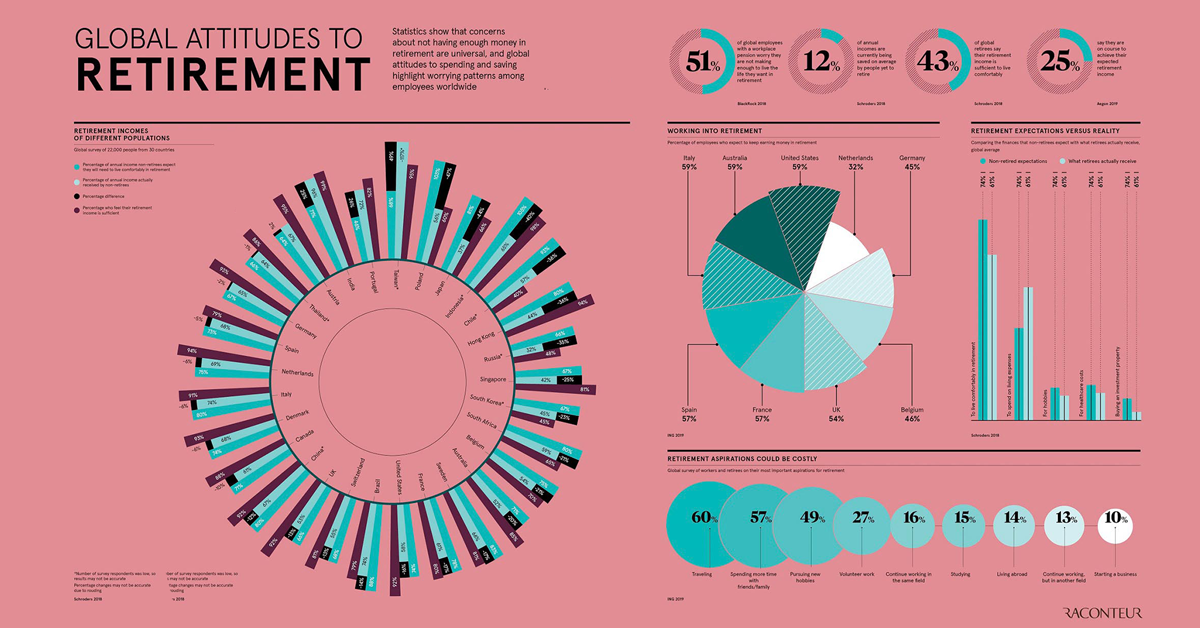
Today’s infographic from Raconteur visualizes attitudes towards retirement around the world, comparing expectations and actualities for retirement income.
Does reality meet their expectations?
Income Expectations Vary by Country
A global survey by asset manager Schroders—looking at 22,000 investors from 30 countries—highlights that retirement income often falls short of expectations.
Here’s what non-retirees (55+ in age) expect to make in retirement as a percentage of their salary, compared to the actual incomes generated by retirees:
| Country | Expectation (% of salary) | Actual (% of salary) | Difference |
|---|---|---|---|
| 🇵🇱 Poland | 103 | 56 | -47 |
| 🇯🇵 Japan | 81 | 37 | -44 |
| 🇮🇩 Indonesia | 105 | 65 | -40 |
| 🇨🇱 Chile* | 93 | 57 | -36 |
| 🇭🇰 Hong Kong | 80 | 44 | -36 |
| 🇷🇺 Russia* | 66 | 32 | -34 |
| 🇸🇬 Singapore | 67 | 42 | -25 |
| 🇰🇷 South Korea | 67 | 45 | -22 |
| 🇿🇦 South Africa | 80 | 59 | -21 |
| 🇧🇪 Belgium | 75 | 54 | -21 |
| 🇦🇺 Australia | 71 | 52 | -20 |
| 🇸🇪 Sweden | 83 | 66 | -17 |
| 🇫🇷 France | 78 | 61 | -17 |
| 🇺🇸 U.S. | 74 | 58 | -16 |
| 🇧🇷 Brazil | 88 | 74 | -14 |
| 🇨🇭 Switzerland | 68 | 55 | -13 |
| 🇬🇧 U.K. | 66 | 53 | -13 |
| 🇨🇳 China* | 80 | 67 | -13 |
| 🇨🇦 Canada | 71 | 61 | -10 |
| 🇩🇰 Denmark | 74 | 68 | -6 |
| 🇮🇹 Italy | 80 | 74 | -6 |
| 🇳🇱 Netherlands | 75 | 69 | -6 |
| 🇪🇸 Spain | 73 | 68 | -5 |
| 🇩🇪 Germany | 67 | 65 | -2 |
| 🇹🇭 Thailand* | 66 | 64 | -1 |
| 🇦🇹 Austria | 64 | 67 | 3 |
| 🇮🇳 India | 71 | 96 | 25 |
| 🇵🇹 Portugal | 46 | 72 | 26 |
| 🇹🇼 Taiwan* | 68 | 117 | 49 |
*Denotes countries with small sample sizes.
Not having enough money at retirement is a nearly universal issue, and 51% of employees with a workplace pension are worried that they won’t make enough to live their ideal retirement life.
Of course, there are always notable exceptions to every rule.
In India, for example, the reality of retirement is often better than anticipated. Non-retirees expect that 71% of their annual salary will provide what is needed to live comfortably in retirement, but in practice they get 96% of their salary in retirement—far higher than they thought.
Most Important Aspirations
The world is divided when it comes to working into retirement. The majority of people want to spend their retirement doing non-work related activities:
- Traveling: 60%
- Spending more time with friends and family: 57%
- Pursuing new hobbies: 49%
- Volunteer work: 27%
That said, 59% of employees in Italy, the U.S., and Australia expect to continue working while retired, while only 32% in the Netherlands have the same expectation. This may be partially due to the strength of the Dutch pension system, which is rated as one of the best in the world.
A Changing Retirement Landscape
The reality of retirement continues to evolve by country and by generation.
Today, only 15% of the population in developed countries is above 65 years of age—but by 2050, the proportion will more than double. People between the ages of 40 and 50 are known as the “Sandwich Generation” because they are simultaneously supporting their retired parents and their own children.
While increasing life expectancy affords people the luxury of spending more time with loved ones, will we be able to afford to live longer?


Money
Charted: Which City Has the Most Billionaires in 2024?
Just two countries account for half of the top 20 cities with the most billionaires. And the majority of the other half are found in Asia.


Charted: Which Country Has the Most Billionaires in 2024?
This was originally posted on our Voronoi app. Download the app for free on iOS or Android and discover incredible data-driven charts from a variety of trusted sources.
Some cities seem to attract the rich. Take New York City for example, which has 340,000 high-net-worth residents with investable assets of more than $1 million.
But there’s a vast difference between being a millionaire and a billionaire. So where do the richest of them all live?
Using data from the Hurun Global Rich List 2024, we rank the top 20 cities with the highest number of billionaires in 2024.
A caveat to these rich lists: sources often vary on figures and exact rankings. For example, in last year’s reports, Forbes had New York as the city with the most billionaires, while the Hurun Global Rich List placed Beijing at the top spot.
Ranked: Top 20 Cities with the Most Billionaires in 2024
The Chinese economy’s doldrums over the course of the past year have affected its ultra-wealthy residents in key cities.
Beijing, the city with the most billionaires in 2023, has not only ceded its spot to New York, but has dropped to #4, overtaken by London and Mumbai.
| Rank | City | Billionaires | Rank Change YoY |
|---|---|---|---|
| 1 | 🇺🇸 New York | 119 | +1 |
| 2 | 🇬🇧 London | 97 | +3 |
| 3 | 🇮🇳 Mumbai | 92 | +4 |
| 4 | 🇨🇳 Beijing | 91 | -3 |
| 5 | 🇨🇳 Shanghai | 87 | -2 |
| 6 | 🇨🇳 Shenzhen | 84 | -2 |
| 7 | 🇭🇰 Hong Kong | 65 | -1 |
| 8 | 🇷🇺 Moscow | 59 | No Change |
| 9 | 🇮🇳 New Delhi | 57 | +6 |
| 10 | 🇺🇸 San Francisco | 52 | No Change |
| 11 | 🇹🇭 Bangkok | 49 | +2 |
| 12 | 🇹🇼 Taipei | 45 | +2 |
| 13 | 🇫🇷 Paris | 44 | -2 |
| 14 | 🇨🇳 Hangzhou | 43 | -5 |
| 15 | 🇸🇬 Singapore | 42 | New to Top 20 |
| 16 | 🇨🇳 Guangzhou | 39 | -4 |
| 17T | 🇮🇩 Jakarta | 37 | +1 |
| 17T | 🇧🇷 Sao Paulo | 37 | No Change |
| 19T | 🇺🇸 Los Angeles | 31 | No Change |
| 19T | 🇰🇷 Seoul | 31 | -3 |
In fact all Chinese cities on the top 20 list have lost billionaires between 2023–24. Consequently, they’ve all lost ranking spots as well, with Hangzhou seeing the biggest slide (-5) in the top 20.
Where China lost, all other Asian cities—except Seoul—in the top 20 have gained ranks. Indian cities lead the way, with New Delhi (+6) and Mumbai (+3) having climbed the most.
At a country level, China and the U.S combine to make up half of the cities in the top 20. They are also home to about half of the world’s 3,200 billionaire population.
In other news of note: Hurun officially counts Taylor Swift as a billionaire, estimating her net worth at $1.2 billion.

-

 Debt1 week ago
How Debt-to-GDP Ratios Have Changed Since 2000
-

 Markets2 weeks ago
Ranked: The World’s Top Flight Routes, by Revenue
-

 Demographics2 weeks ago
Population Projections: The World’s 6 Largest Countries in 2075
-

 Markets2 weeks ago
The Top 10 States by Real GDP Growth in 2023
-

 Demographics2 weeks ago
The Smallest Gender Wage Gaps in OECD Countries
-

 Economy2 weeks ago
Where U.S. Inflation Hit the Hardest in March 2024
-

 Green2 weeks ago
Top Countries By Forest Growth Since 2001
-

 United States2 weeks ago
Ranked: The Largest U.S. Corporations by Number of Employees