Maps
Visualized: Which Coastal Cities are Sinking the Fastest?
Article/Editing:
![]() See this visualization first on the Voronoi app.
See this visualization first on the Voronoi app.
Which Coastal Cities Are Sinking the Fastest?
This was originally posted on our Voronoi app. Download the app for free on iOS or Android and discover incredible data-driven charts from a variety of trusted sources.
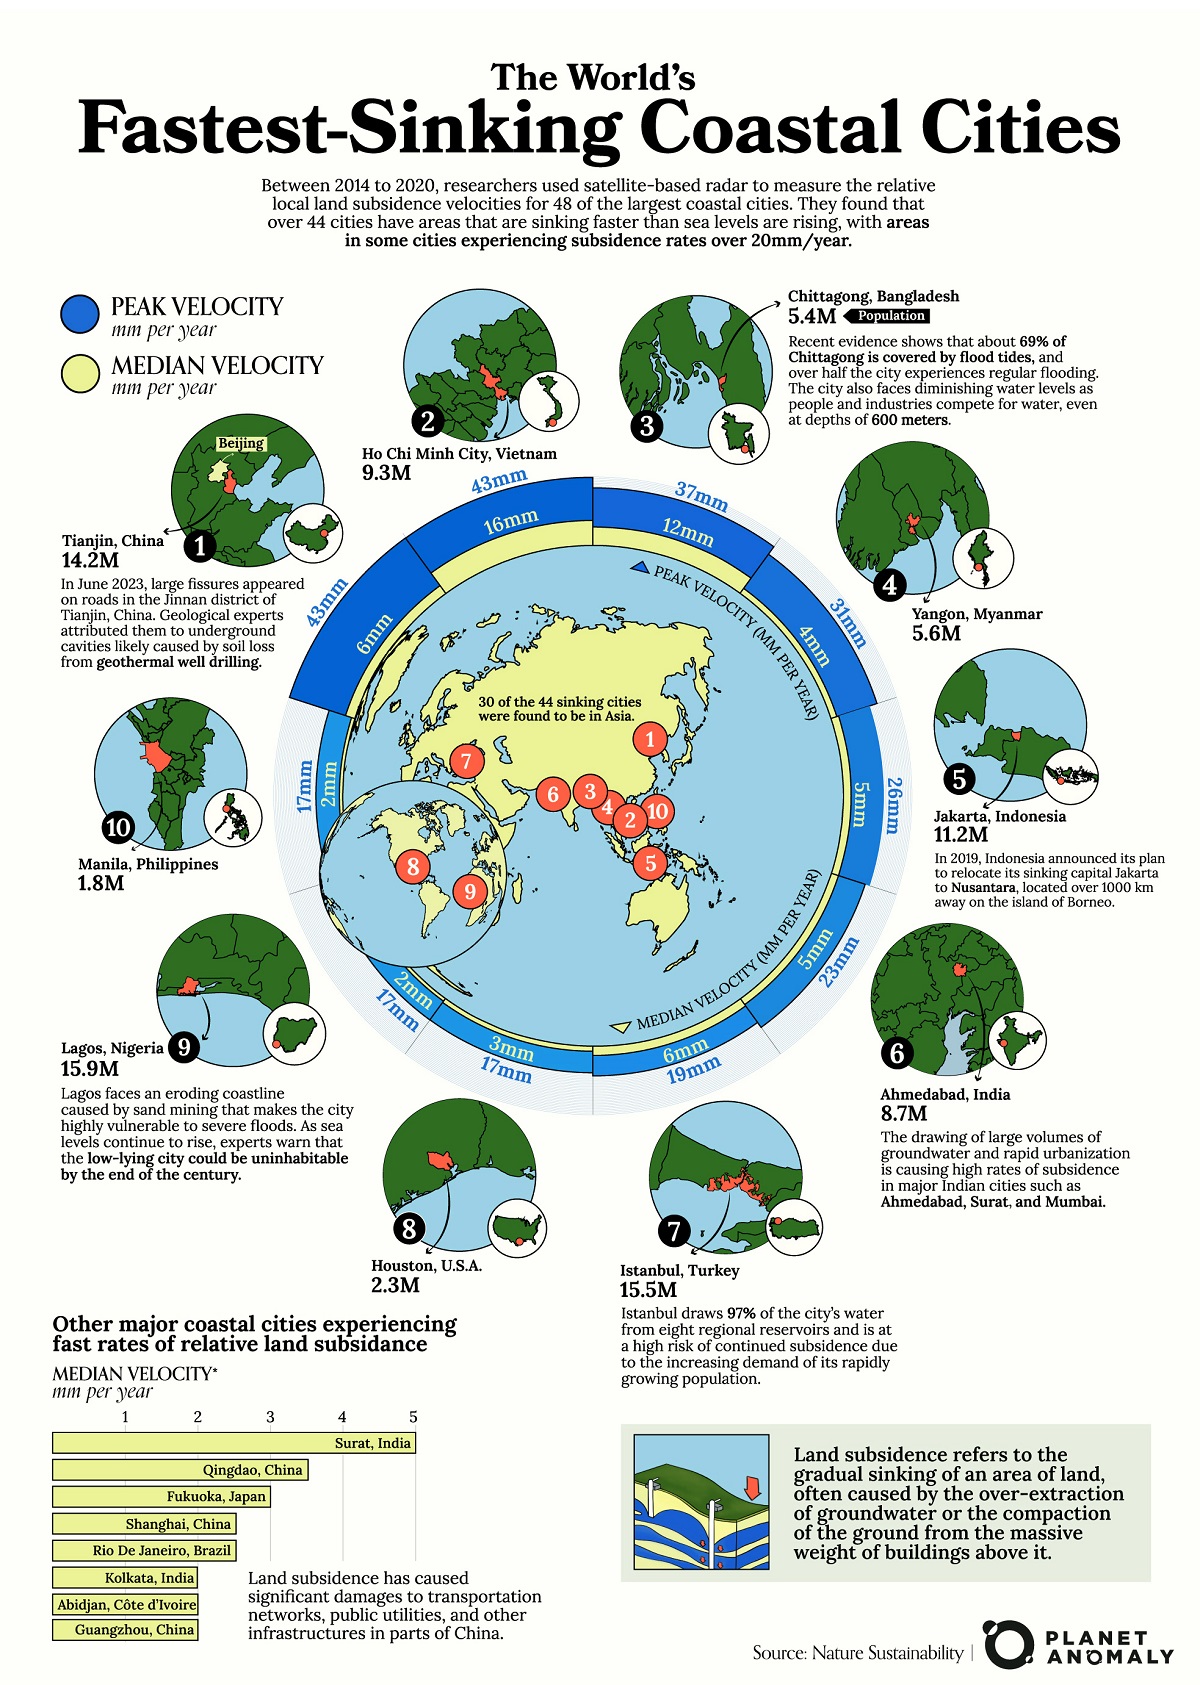
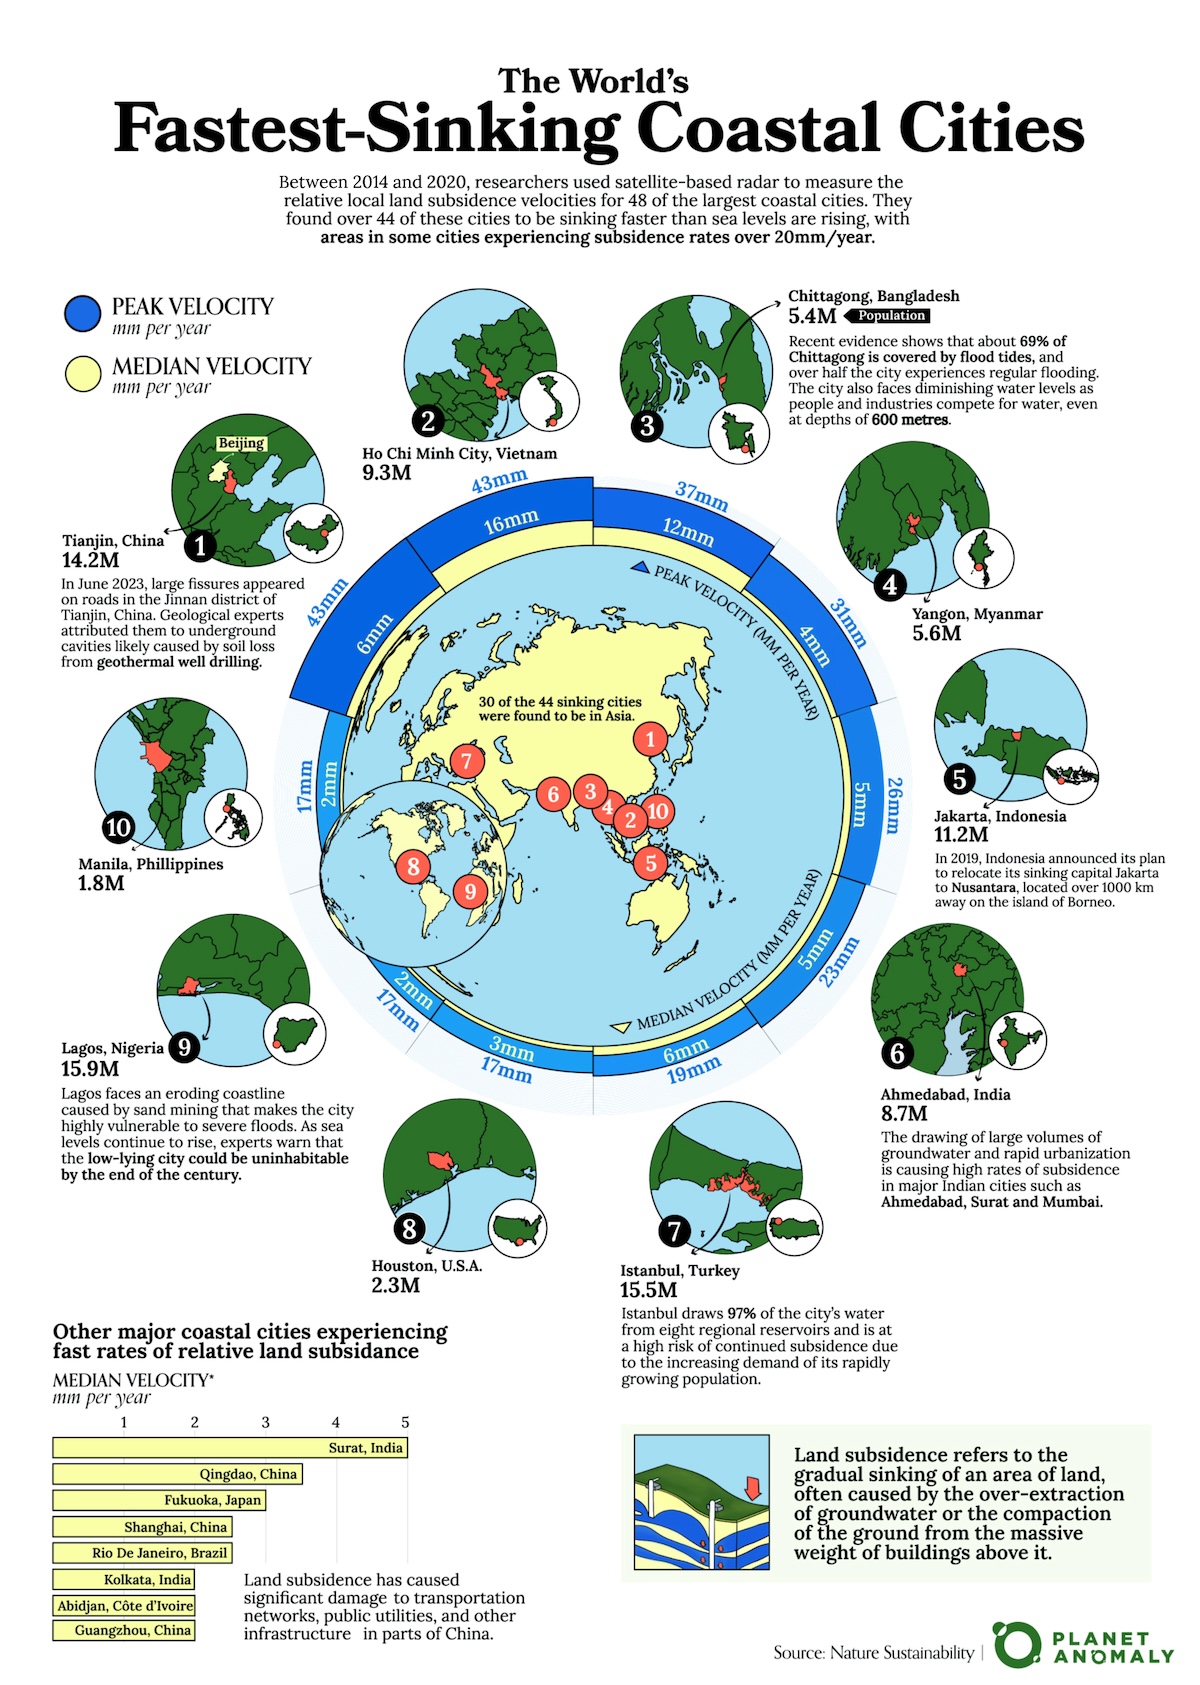
With sea levels rising, there is cause for concern about the livability of major coastal cities—often huge centers of trade and commerce, and homes to millions of people.
But an overlooked area is how coastal cities are themselves sinking—a phenomenon called relative local land subsidence (RLLS)—which occurs when underground materials, such as soil, rock, or even man-made structures, compact or collapse, causing the surface above to sink.
This can exacerbate the effects of rising sea levels (currently averaged at 3.7 mm/year), and is a useful metric to track for coastal communities.
Creator Planet Anomaly, looks at the top 10 cities ranked by the peak subsidence velocity. This graphic is based on a paper published by Nature Sustainability, which used satellite data to track land subsidence changes in 48 high-population coastal cities located within 50 kilometers of the coastline. Their data collection spanned six years from 2014 to 2020.
In that time period, they found that 44 of the cities they studied—many of them massively populated, developed megacities, built on flat, low-lying river deltas—had areas sinking faster than sea levels were rising.
The 10 Fastest Sinking Coastal Cities
One of the top cities on the list is Tianjin, China with a population of more than 14 million people, which has areas of the city experiencing peak RLLS velocities of 43 mm a year between 2014–2020. The median velocity is much lower, at 6 mm/year, which means some areas are sinking much faster than the overall metropolitan area.
Tianjin is bordered by Beijing municipality to the northwest and the Bohai Gulf to the east. In June 2023, large cracks appeared on Tianjin’s streets, caused by underground land collapses, a byproduct of extensive geothermal drilling, according to the local government.
| Rank | City | Country | Peak Velocity (mm/year) | Median Velocity (mm/year) |
|---|---|---|---|---|
| 1 | Tianjin | 🇨🇳 China | 43 | 6 |
| 2 | Ho Chi Minh City | 🇻🇳 Vietnam | 43 | 16 |
| 3 | Chittagong | 🇧🇩 Bangladesh | 37 | 12 |
| 4 | Yangon | 🇲🇲 Myanmar | 31 | 4 |
| 5 | Jakarta | 🇮🇩 Indonesia | 26 | 5 |
| 6 | Ahmedabad | 🇮🇳 India | 23 | 5 |
| 7 | Istanbul | 🇹🇷 Turkey | 19 | 6 |
| 8 | Houston | 🇺🇸 U.S. | 17 | 3 |
| 9 | Lagos | 🇳🇬 Nigeria | 17 | 2 |
| 10 | Manila | 🇵🇭 Philippines | 17 | 2 |
Ho Chi Minh City (population 9 million) in Vietnam also faces similar RLLS rates as Tianjin though its median velocity is much higher at 16 mm/year.
Chittagong, Bangladesh, Yangon, Myanmar, and Jakarta, Indonesia, round out the top five fastest sinking coastal cities by relative land subsidence. They all face a similar web of contributing factors as the authors of the paper note below:
“Many of these fast-subsiding coastal cities are rapidly expanding megacities, where anthropogenic factors, such as high demands for groundwater extraction and loading from densely constructed building structures, contribute to local land subsidence.” — Tay, C., Lindsey, E.O., Chin, S.T. et al.
In fact, Indonesia has ambitious plans to relocate its sinking capital, Jakarta, to another island, a move that could cost the Indonesian government more than $120 billion. This comes after the forecast that one-third of Jakarta could be submerged as early as 2050. Aside from the regular flooding, Jakarta is also extremely prone to earthquakes.
Why Measure Local Land Subsidence?
The researchers of this report argue that local land subsidence is largely underestimated in relative sea level rise assessments and is crucial for the sustainable development of coastal areas.
The data they’ve collected—peak velocity versus median velocity—also allows them to identify specific areas and neighborhoods in cities that are undergoing rapid subsidence and thus facing a greater exposure to coastal hazards.
In New York, for example, their results suggested that subsidence is only localized west of Breezy Point and “should not be extrapolated eastward along the coast” of Long Island.

This article was published as a part of Visual Capitalist's Creator Program, which features data-driven visuals from some of our favorite Creators around the world.


Maps
The Largest Earthquakes in the New York Area (1970-2024)
The earthquake that shook buildings across New York in April 2024 was the third-largest quake in the Northeast U.S. over the past 50 years.


The Largest Earthquakes in the New York Area
This was originally posted on our Voronoi app. Download the app for free on Apple or Android and discover incredible data-driven charts from a variety of trusted sources.
The 4.8 magnitude earthquake that shook buildings across New York on Friday, April 5th, 2024 was the third-largest quake in the U.S. Northeast area over the past 50 years.
In this map, we illustrate earthquakes with a magnitude of 4.0 or greater recorded in the Northeastern U.S. since 1970, according to the United States Geological Survey (USGS).
Shallow Quakes and Older Buildings
The earthquake that struck the U.S. Northeast in April 2024 was felt by millions of people from Washington, D.C., to north of Boston. It even caused a full ground stop at Newark Airport.
The quake, occurring just 5 km beneath the Earth’s surface, was considered shallow, which is what contributed to more intense shaking at the surface.
According to the USGS, rocks in the eastern U.S. are significantly older, denser, and harder than those on the western side, compressed by time. This makes them more efficient conduits for seismic energy. Additionally, buildings in the Northeast tend to be older and may not adhere to the latest earthquake codes.
Despite disrupting work and school life, the earthquake was considered minor, according to the Michigan Technological University magnitude scale:
| Magnitude | Earthquake Effects | Estimated Number Each Year |
|---|---|---|
| 2.5 or less | Usually not felt, but can be recorded by seismograph. | Millions |
| 2.5 to 5.4 | Often felt, but only causes minor damage. | 500,000 |
| 5.5 to 6.0 | Slight damage to buildings and other structures. | 350 |
| 6.1 to 6.9 | May cause a lot of damage in very populated areas. | 100 |
| 7.0 to 7.9 | Major earthquake. Serious damage. | 10-15 |
| 8.0 or greater | Great earthquake. Can totally destroy communities near the epicenter. | One every year or two |
The largest earthquake felt in the area over the past 50 years was a 5.3 magnitude quake that occurred in Au Sable Forks, New York, in 2002. It damaged houses and cracked roads in a remote corner of the Adirondack Mountains, but caused no injuries.
| Date | Magnitude | Location | State |
|---|---|---|---|
| April 20, 2002 | 5.3 | Au Sable Forks | New York |
| October 7, 1983 | 5.1 | Newcomb | New York |
| April 5, 2024 | 4.8 | Whitehouse Station | New Jersey |
| October 16, 2012 | 4.7 | Hollis Center | Maine |
| January 16, 1994 | 4.6 | Sinking Spring | Pennsylvania |
| January 19, 1982 | 4.5 | Sanbornton | New Hampshire |
| September 25, 1998 | 4.5 | Adamsville | Pennsylvania |
| June 9, 1975 | 4.2 | Altona | New York |
| May 29, 1983 | 4.2 | Peru | Maine |
| April 23, 1984 | 4.2 | Conestoga | Pennsylvania |
| January 16, 1994 | 4.2 | Sinking Spring | Pennsylvania |
| November 3, 1975 | 4 | Long Lake | New York |
| June 17, 1991 | 4 | Worcester | New York |
The largest earthquake in U.S. history, however, was the 1964 Good Friday quake in Alaska, measuring 9.2 magnitude and killing 131 people.

-

 Education1 week ago
How Hard Is It to Get Into an Ivy League School?
-

 Technology2 weeks ago
Ranked: Semiconductor Companies by Industry Revenue Share
-

 Markets2 weeks ago
Ranked: The World’s Top Flight Routes, by Revenue
-

 Demographics2 weeks ago
Population Projections: The World’s 6 Largest Countries in 2075
-

 Markets2 weeks ago
The Top 10 States by Real GDP Growth in 2023
-

 Demographics2 weeks ago
The Smallest Gender Wage Gaps in OECD Countries
-

 Economy2 weeks ago
Where U.S. Inflation Hit the Hardest in March 2024
-

 Green2 weeks ago
Top Countries By Forest Growth Since 2001