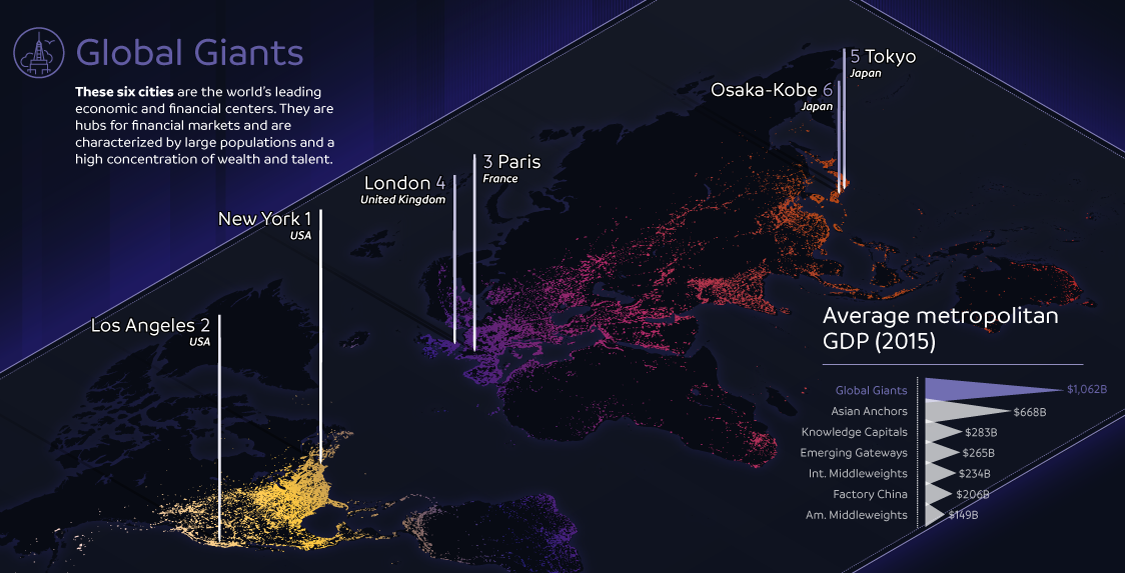
The world's largest 123 cities generate an astonishing $36 trillion in GDP per year. This infographic breaks these global cities down into seven typologies.
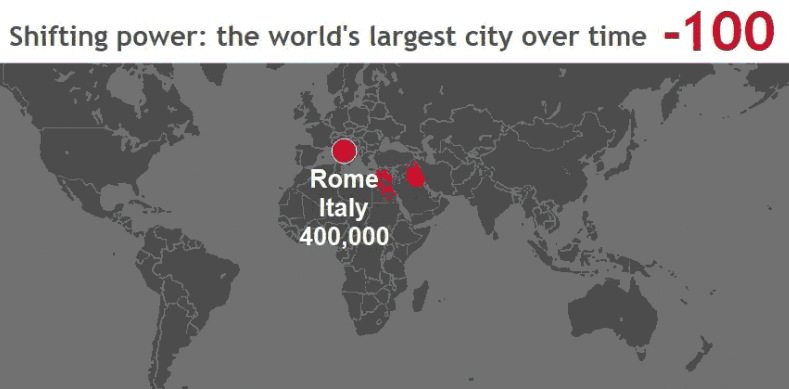
These stunning animations and interactive maps show the changing title for the world's largest city, as well as the rapid pace of urbanization in today's world.
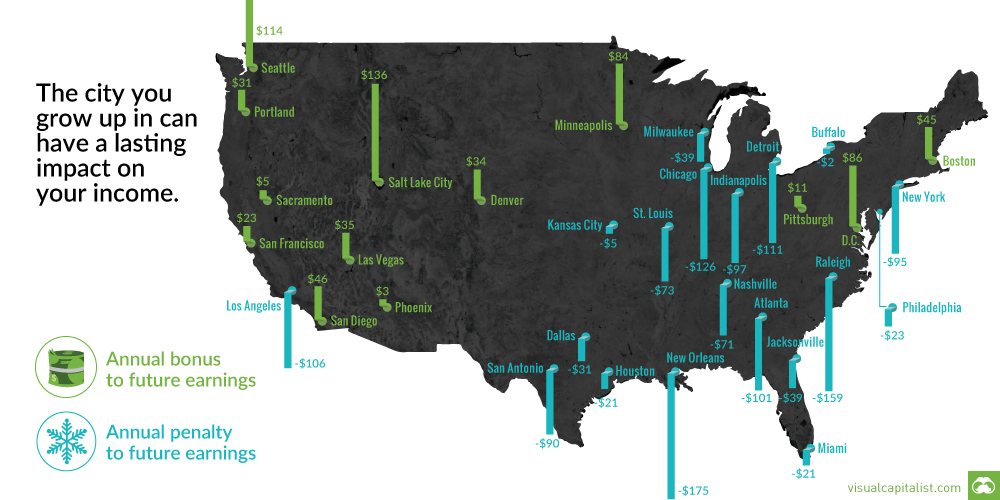
Family and neighborhoods influence a child's development and opportunities - and as a result, future incomes. See which cities have the biggest impact.
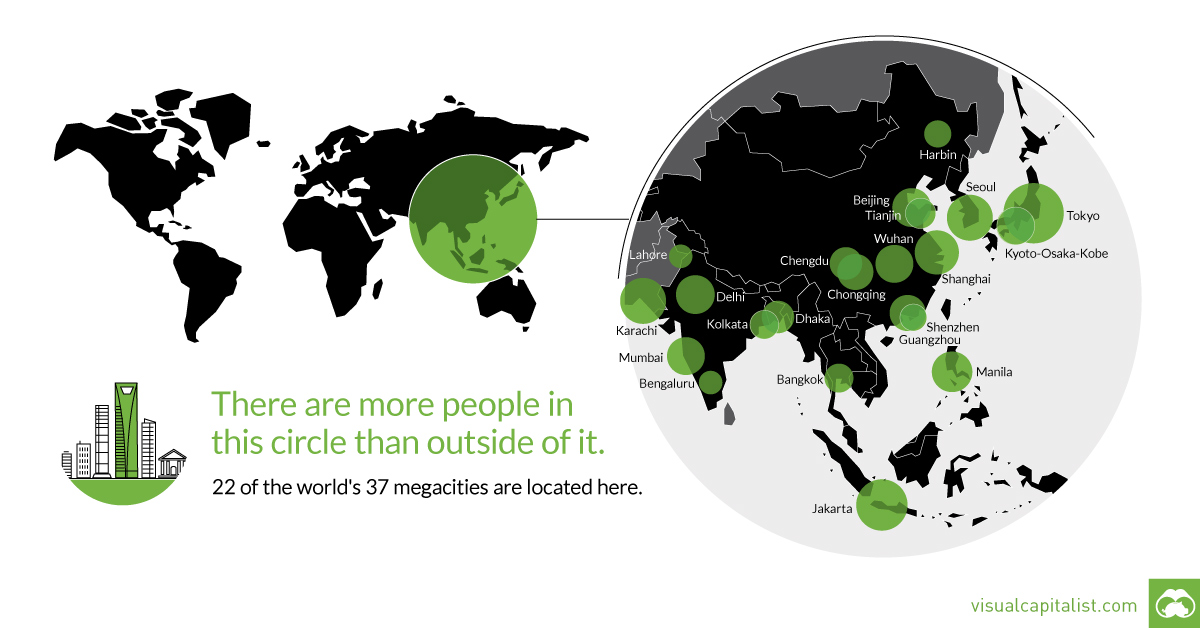
That's right - nearly 4 billion people live inside the circle on this world map, including 22 of the world's 37 megacities.
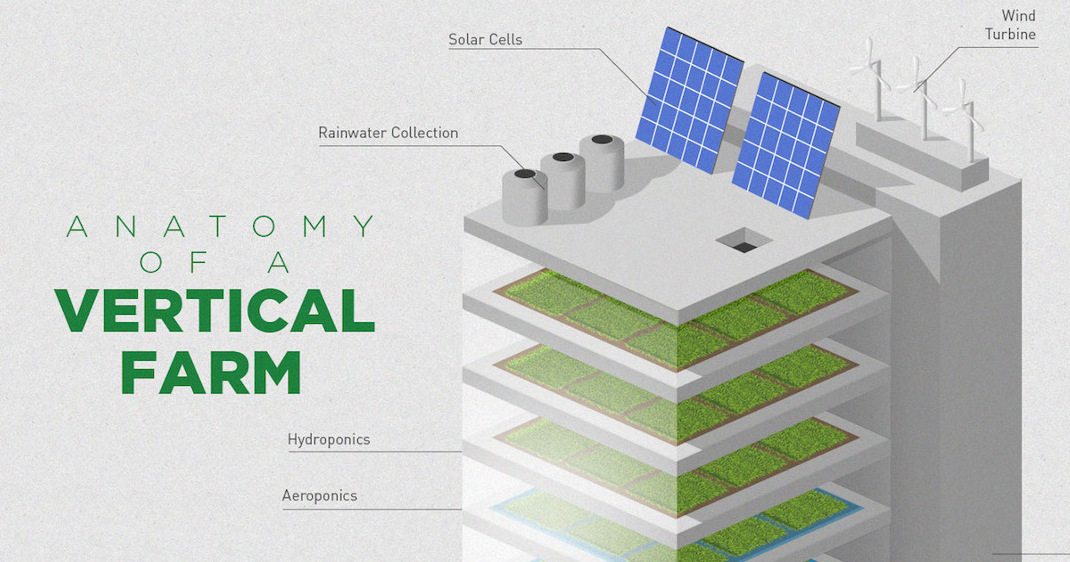
What if a skyscraper could supply sustainable farm food to the city more efficiently and profitably? This infographic explains how vertical farming works.
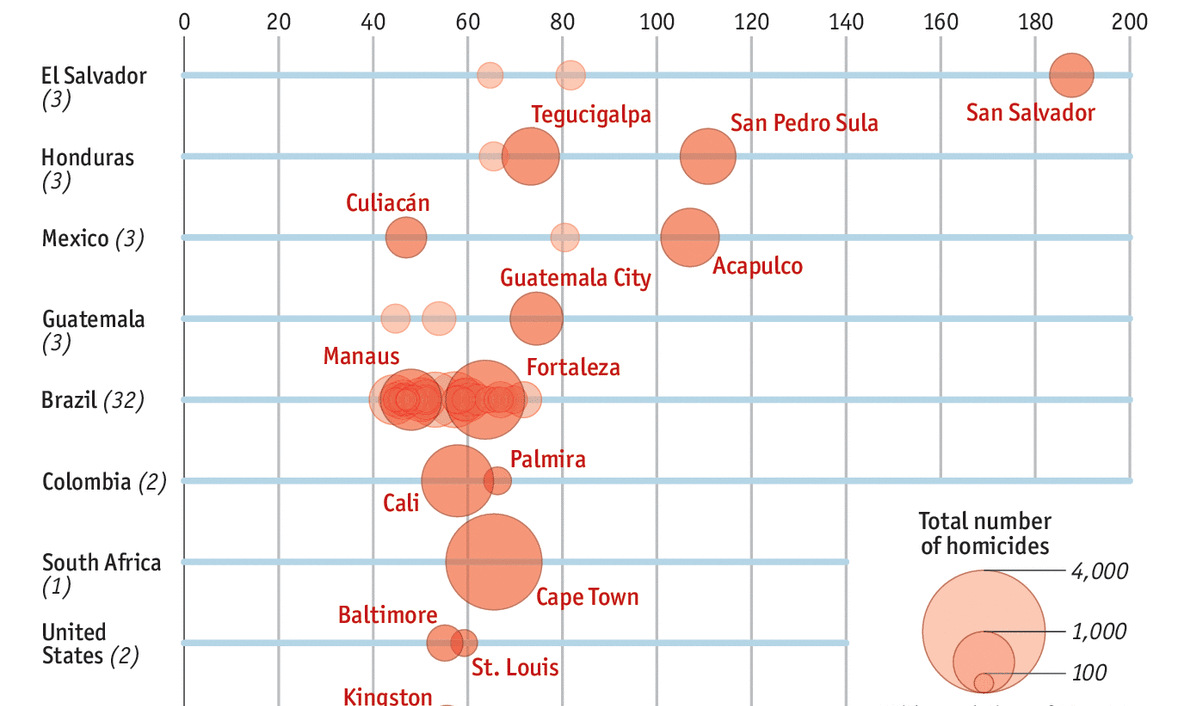
Here are the world's 50 most violent cities - Brazil is home to an astonishing 32 of them.
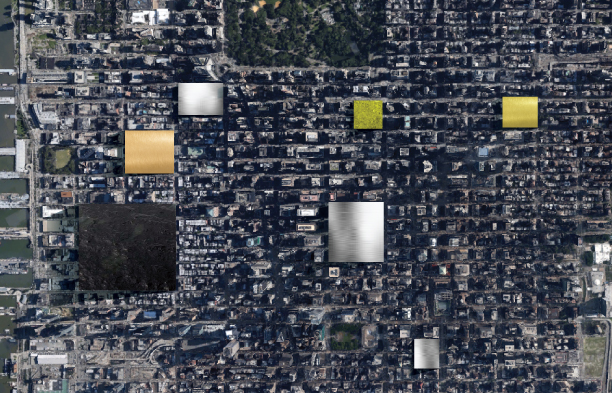
https://beta.quiet.ly/list/share/db1ed-a-year-s-extraction-of-metal-shown-next-to-cities?width=1070&height=800&showGradient=false&showMapView=false&showAuthor=true&showLogo=true&showListTitle=true&showListDescription=true&showTitles=true&showDescriptions=true&showWeblinks=false&makeClickable=false&sharePage=true&showIcons=true&embedTheme=dark&titleSize=18&titleType=quietly&descriptionSize=14&descriptionType=quietly&useOriginalImages=true&lastSlide=default&lastSlideMsg=&lastSlideUrl=http%3A%2F%2Fwww.facebook.com%2Fvisualcapitalist A Year’s Extraction of Metal Shown Next to Landmarks and Cities “One death is a tragedy. One million is a statistic.” – Joseph Stalin For...


