Maps
Mapped: The Safest Cities in the U.S.
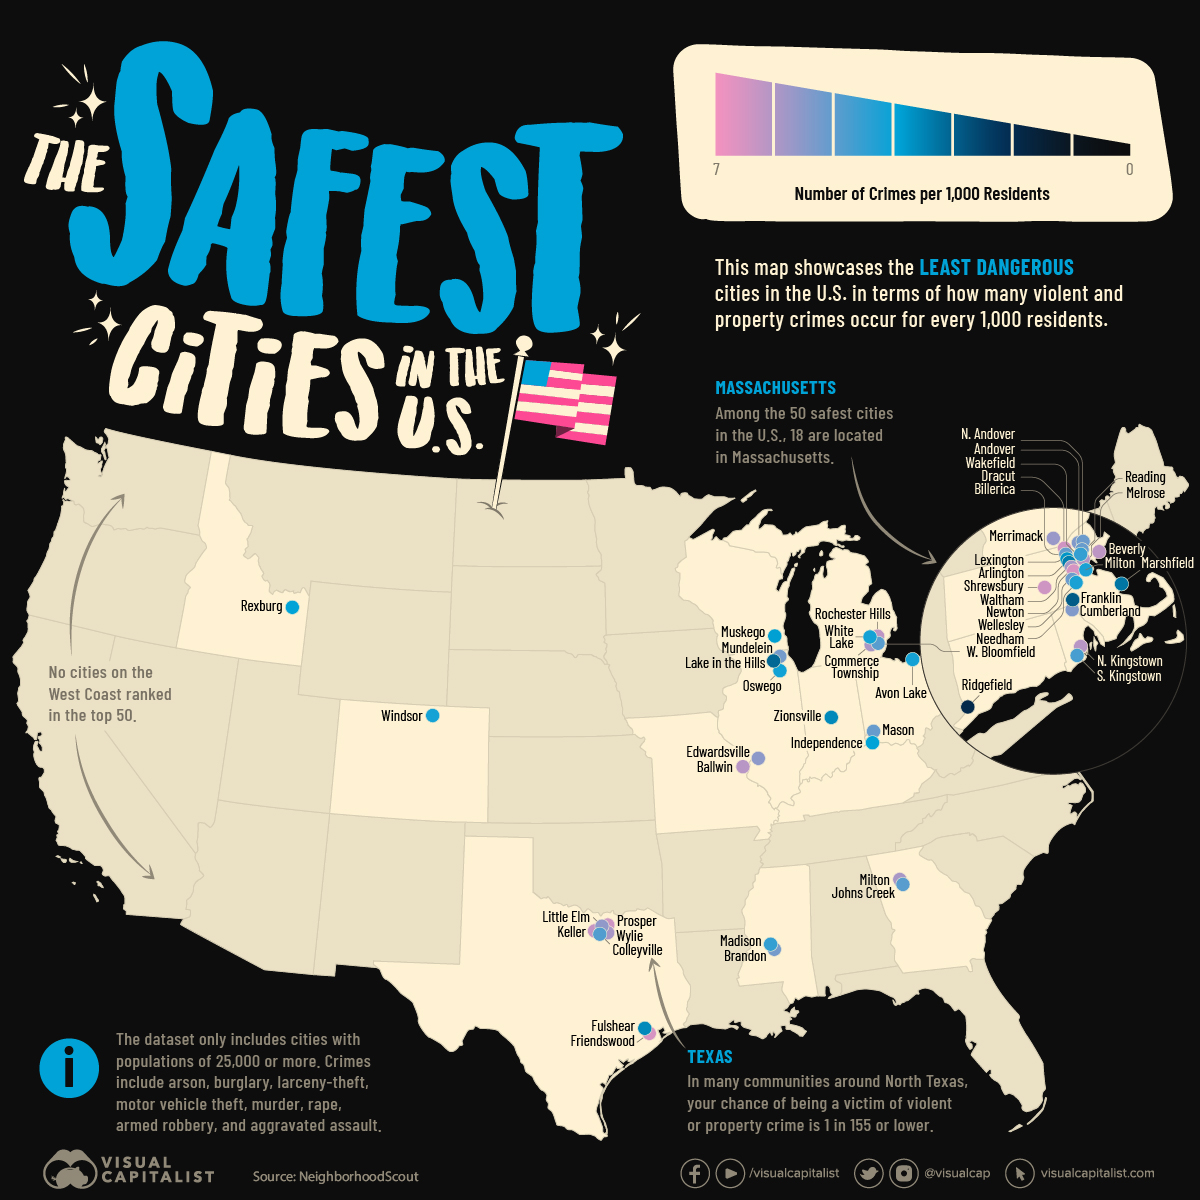


Mapped: The Safest Cities in America
The phrase “small town America” often conjures up images of white picket fences, well-trimmed lawns, and big houses. But how safe is modern-day suburbia in America?
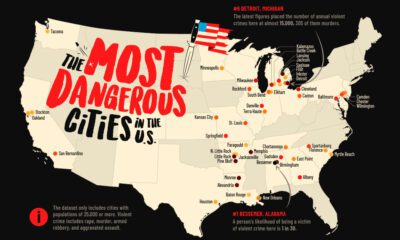
Some of the smallest places in the country can actually be among the most dangerous. Take for example Bessemer, Alabama, with a population of around 26,000 and a violent crime rate of 33.1 per every 1,000 residents.
That said, there are many small cities that are true havens for families across the United States. This map showcases the safest cities in the U.S., using FBI data and Census Bureau populations compiled by NeighborhoodScout in 2023.
Note: The source only considered cities with a population of 25,000 or higher. This report is based on total index crimes reported in each city, which includes arson, burglary, larceny-theft, motor vehicle theft, murder, rape, armed robbery, and aggravated assault.
Top 100 Safest Cities in the U.S.
40% of the cities in the ranking are located in Northeastern states, which are typically rated the “safest” based on FBI data.
Here’s a closer look at the full list:
| Rank | City | State | Total Crime Rate(per 1,000 residents) | Chance of Beinga Victim |
|---|---|---|---|---|
| 1 | Ridgefield | Connecticut | 1.9 | 1 in 510 |
| 2 | Franklin | Massachusetts | 2.9 | 1 in 344 |
| 3 | Lake in the Hills | Illinois | 3.1 | 1 in 321 |
| 4 | Marshfield | Massachusetts | 3.3 | 1 in 300 |
| 5 | Arlington | Massachusetts | 3.4 | 1 in 292 |
| 6 | Fulshear | Texas | 3.6 | 1 in 276 |
| 7 | Zionsville | Indiana | 3.6 | 1 in 275 |
| 8 | Lexington | Massachusetts | 3.7 | 1 in 270 |
| 9 | Muskego | Wisconsin | 3.8 | 1 in 265 |
| 10 | Rexburg | Idaho | 3.9 | 1 in 253 |
| 11 | Independence | Kentucky | 3.9 | 1 in 253 |
| 12 | Oswego | Illinois | 4.1 | 1 in 238 |
| 13 | Milton | Massachusetts | 4.2 | 1 in 233 |
| 14 | Needham | Massachusetts | 4.2 | 1 in 233 |
| 15 | White Lake | Michigan | 4.2 | 1 in 233 |
| 16 | Avon Lake | Ohio | 4.3 | 1 in 232 |
| 17 | Madison | Mississippi | 4.5 | 1 in 221 |
| 18 | Wakefield | Massachusetts | 4.5 | 1 in 218 |
| 19 | Windsor | Colorado | 4.5 | 1 in 218 |
| 20 | South Kingstown | Rhode Island | 4.7 | 1 in 212 |
| 21 | Colleyville | Texas | 4.8 | 1 in 206 |
| 22 | West Bloomfield | Michigan | 4.9 | 1 in 204 |
| 23 | Johns Creek | Georgia | 4.9 | 1 in 202 |
| 24 | Billerica | Massachusetts | 5.1 | 1 in 195 |
| 25 | Mason | Ohio | 5.1 | 1 in 192 |
| 26 | Reading | Massachusetts | 5.1 | 1 in 192 |
| 27 | North Andover | Massachusetts | 5.2 | 1 in 190 |
| 28 | Wellesley | Massachusetts | 5.2 | 1 in 189 |
| 29 | Mundelein | Illinois | 5.3 | 1 in 187 |
| 30 | Brandon | Mississippi | 5.3 | 1 in 186 |
| 31 | Cumberland | Rhode Island | 5.4 | 1 in 184 |
| 32 | Andover | Massachusetts | 5.4 | 1 in 182 |
| 33 | Edwardsville | Illinois | 5.5 | 1 in 178 |
| 34 | Little Elm | Texas | 5.6 | 1 in 176 |
| 35 | Merrimack | New Hampshire | 5.7 | 1 in 172 |
| 36 | Waltham | Massachusetts | 5.8 | 1 in 169 |
| 37 | Wylie | Texas | 5.9 | 1 in 169 |
| 38 | Commerce Township | Michigan | 5.9 | 1 in 169 |
| 39 | Milton | Georgia | 5.9 | 1 in 167 |
| 40 | Melrose | Massachusetts | 6.0 | 1 in 164 |
| 41 | Ballwin | Missouri | 6.1 | 1 in 162 |
| 42 | North Kingstown | Rhode Island | 6.1 | 1 in 162 |
| 43 | Beverly | Massachusetts | 6.2 | 1 in 161 |
| 44 | Rochester Hills | Michigan | 6.2 | 1 in 160 |
| 45 | Keller | Texas | 6.3 | 1 in 158 |
| 46 | Shrewsbury | Massachusetts | 6.4 | 1 in 156 |
| 47 | Dracut | Massachusetts | 6.4 | 1 in 155 |
| 48 | Prosper | Texas | 6.4 | 1 in 155 |
| 49 | Newton | Massachusetts | 6.5 | 1 in 152 |
| 50 | Friendswood | Texas | 6.5 | 1 in 152 |
| 51 | McHenry | Illinois | 6.5 | 1 in 152 |
| 52 | Fort Mill | South Carolina | 6.6 | 1 in 151 |
| 53 | Wallingford | Connecticut | 6.8 | 1 in 146 |
| 54 | Caledonia | Wisconsin | 6.9 | 1 in 144 |
| 55 | Belmont | Massachusetts | 6.9 | 1 in 144 |
| 56 | De Pere | Wisconsin | 6.9 | 1 in 143 |
| 57 | Flower Mound | Texas | 7.0 | 1 in 142 |
| 58 | Easton | Massachusetts | 7.0 | 1 in 141 |
| 59 | Highland Park | Illinois | 7.0 | 1 in 141 |
| 60 | Carmel | Indiana | 7.2 | 1 in 138 |
| 61 | Sachse | Texas | 7.2 | 1 in 138 |
| 62 | Algonquin | Illinois | 7.2 | 1 in 137 |
| 63 | Hendersonville | Tennessee | 7.2 | 1 in 137 |
| 64 | San Luis | Arizona | 7.3 | 1 in 136 |
| 65 | Fishers | Indiana | 7.3 | 1 in 135 |
| 66 | Perrysburg | Ohio | 7.4 | 1 in 135 |
| 67 | Lake Stevens | Washington | 7.4 | 1 in 134 |
| 68 | Cheshire | Connecticut | 7.4 | 1 in 134 |
| 69 | Milford | Massachusetts | 7.5 | 1 in 132 |
| 70 | Saratoga Springs | Utah | 7.5 | 1 in 132 |
| 71 | Bella Vista | Arkansas | 7.5 | 1 in 132 |
| 72 | Princeton | New Jersey | 7.5 | 1 in 131 |
| 73 | Bluffton | South Carolina | 7.6 | 1 in 130 |
| 74 | Novi | Michigan | 7.6 | 1 in 130 |
| 75 | Chelmsford | Massachusetts | 7.6 | 1 in 130 |
| 76 | Amherst | Massachusetts | 7.7 | 1 in 129 |
| 77 | Rosemount | Minnesota | 7.7 | 1 in 129 |
| 78 | Gloucester | Massachusetts | 7.7 | 1 in 129 |
| 79 | Syracuse | Utah | 7.8 | 1 in 127 |
| 80 | Waukee | Iowa | 7.8 | 1 in 126 |
| 81 | Mequon | Wisconsin | 7.9 | 1 in 126 |
| 82 | Westfield | Indiana | 7.9 | 1 in 126 |
| 83 | Spring Hill | Tennessee | 7.9 | 1 in 126 |
| 84 | Upper Arlington | Ohio | 7.9 | 1 in 126 |
| 85 | Rahway | New Jersey | 7.9 | 1 in 125 |
| 86 | Montclair | New Jersey | 7.9 | 1 in 125 |
| 87 | Greenwich | Connecticut | 8.0 | 1 in 125 |
| 88 | Hutto | Texas | 8.0 | 1 in 124 |
| 89 | Vestavia Hills | Alabama | 8.0 | 1 in 123 |
| 90 | Brownsburg | Indiana | 8.1 | 1 in 123 |
| 91 | Wilmette | Illinois | 8.1 | 1 in 123 |
| 92 | New Milford | Connecticut | 8.1 | 1 in 122 |
| 93 | Hilliard | Ohio | 8.2 | 1 in 120 |
| 94 | Royal Oak | Michigan | 8.2 | 1 in 120 |
| 95 | Derry | New Hampshire | 8.3 | 1 in 121 |
| 96 | Dublin | Ohio | 8.3 | 1 in 120 |
| 97 | West Warwick | Rhode Island | 8.5 | 1 in 116 |
| 98 | Watertown | Massachusetts | 8.5 | 1 in 116 |
| 99 | Walpole | Massachusetts | 8.6 | 1 in 115 |
| 100 | Kaysville | Utah | 8.6 | 1 in 115 |
One quarter of the safest cities are located in Massachusetts, with the vast majority clustered around Boston.
The median population of the cities and towns in the top 100 is just 32,000, and few widely-recognized cities make the list. Carmel, Indiana (#60) is the only city with a population above 100,000 to make the rankings. This would seem to follow the logic that bigger cities are more dangerous, but our map covering the most dangerous cities in America shows that many small cities were just as dangerous, and some even more.
Regardless, small towns can truly be idyllic. For example, a person’s chance of falling victim to crime in Ridgefield, Connecticut, the safest ranked city in the U.S., is just 1-in-510. That’s an overall rate of fewer than two incidents of crime per every 1,000 residents.
One surprising observation from the data is that many of the safest U.S. cities are in very close proximity to some of the most dangerous.
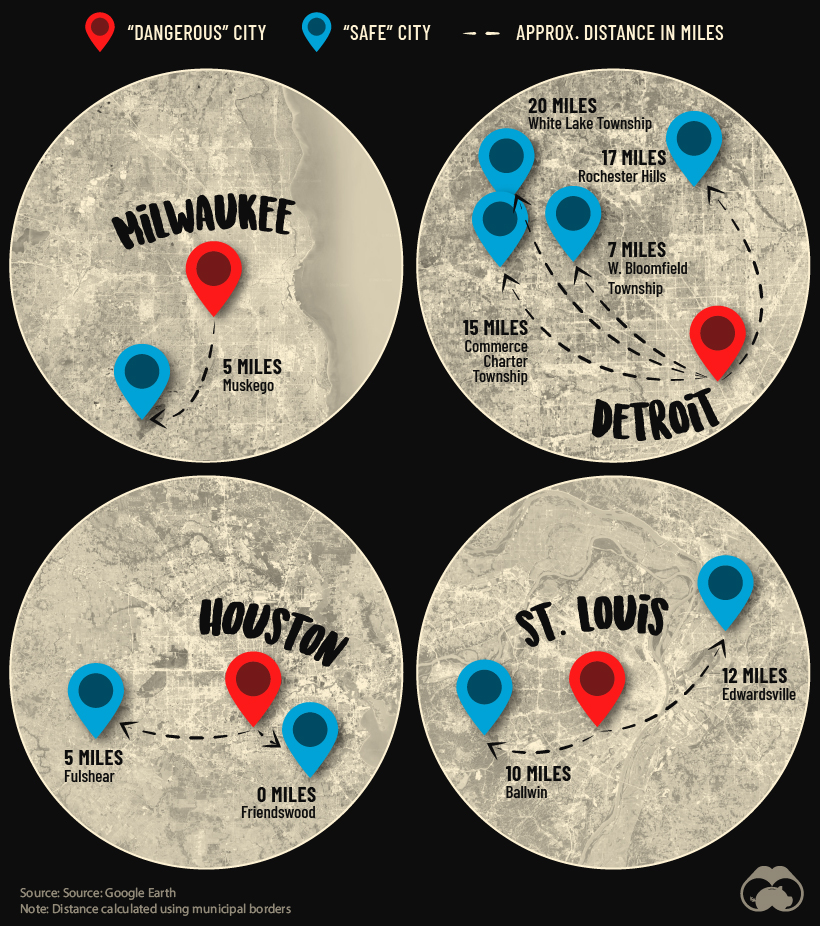
One example that illustrates this is Detroit, which ranks as the sixth most dangerous city in America. Despite this, as shown on the map above, there are four communities nearby that have some of the lowest crime rates in America.
In other words, America’s metro areas contain much contrast, and these insights provide valuable information for individuals and families seeking secure places to live across the country.


Maps
The Largest Earthquakes in the New York Area (1970-2024)
The earthquake that shook buildings across New York in April 2024 was the third-largest quake in the Northeast U.S. over the past 50 years.


The Largest Earthquakes in the New York Area
This was originally posted on our Voronoi app. Download the app for free on Apple or Android and discover incredible data-driven charts from a variety of trusted sources.
The 4.8 magnitude earthquake that shook buildings across New York on Friday, April 5th, 2024 was the third-largest quake in the U.S. Northeast area over the past 50 years.
In this map, we illustrate earthquakes with a magnitude of 4.0 or greater recorded in the Northeastern U.S. since 1970, according to the United States Geological Survey (USGS).
Shallow Quakes and Older Buildings
The earthquake that struck the U.S. Northeast in April 2024 was felt by millions of people from Washington, D.C., to north of Boston. It even caused a full ground stop at Newark Airport.
The quake, occurring just 5 km beneath the Earth’s surface, was considered shallow, which is what contributed to more intense shaking at the surface.
According to the USGS, rocks in the eastern U.S. are significantly older, denser, and harder than those on the western side, compressed by time. This makes them more efficient conduits for seismic energy. Additionally, buildings in the Northeast tend to be older and may not adhere to the latest earthquake codes.
Despite disrupting work and school life, the earthquake was considered minor, according to the Michigan Technological University magnitude scale:
| Magnitude | Earthquake Effects | Estimated Number Each Year |
|---|---|---|
| 2.5 or less | Usually not felt, but can be recorded by seismograph. | Millions |
| 2.5 to 5.4 | Often felt, but only causes minor damage. | 500,000 |
| 5.5 to 6.0 | Slight damage to buildings and other structures. | 350 |
| 6.1 to 6.9 | May cause a lot of damage in very populated areas. | 100 |
| 7.0 to 7.9 | Major earthquake. Serious damage. | 10-15 |
| 8.0 or greater | Great earthquake. Can totally destroy communities near the epicenter. | One every year or two |
The largest earthquake felt in the area over the past 50 years was a 5.3 magnitude quake that occurred in Au Sable Forks, New York, in 2002. It damaged houses and cracked roads in a remote corner of the Adirondack Mountains, but caused no injuries.
| Date | Magnitude | Location | State |
|---|---|---|---|
| April 20, 2002 | 5.3 | Au Sable Forks | New York |
| October 7, 1983 | 5.1 | Newcomb | New York |
| April 5, 2024 | 4.8 | Whitehouse Station | New Jersey |
| October 16, 2012 | 4.7 | Hollis Center | Maine |
| January 16, 1994 | 4.6 | Sinking Spring | Pennsylvania |
| January 19, 1982 | 4.5 | Sanbornton | New Hampshire |
| September 25, 1998 | 4.5 | Adamsville | Pennsylvania |
| June 9, 1975 | 4.2 | Altona | New York |
| May 29, 1983 | 4.2 | Peru | Maine |
| April 23, 1984 | 4.2 | Conestoga | Pennsylvania |
| January 16, 1994 | 4.2 | Sinking Spring | Pennsylvania |
| November 3, 1975 | 4 | Long Lake | New York |
| June 17, 1991 | 4 | Worcester | New York |
The largest earthquake in U.S. history, however, was the 1964 Good Friday quake in Alaska, measuring 9.2 magnitude and killing 131 people.

-

 Science1 week ago
Visualizing the Average Lifespans of Mammals
-

 Markets2 weeks ago
The Top 10 States by Real GDP Growth in 2023
-

 Demographics2 weeks ago
The Smallest Gender Wage Gaps in OECD Countries
-

 United States2 weeks ago
Where U.S. Inflation Hit the Hardest in March 2024
-

 Green2 weeks ago
Top Countries By Forest Growth Since 2001
-

 United States2 weeks ago
Ranked: The Largest U.S. Corporations by Number of Employees
-

 Maps2 weeks ago
The Largest Earthquakes in the New York Area (1970-2024)
-

 Green2 weeks ago
Ranked: The Countries With the Most Air Pollution in 2023