Crime
Mapped: The Most Dangerous Cities in the U.S.


Mapped: The Most Dangerous Cities in the U.S.
Crime is seemingly always increasing—at least according to the headlines.
The focus is usually on big cities like Chicago or San Francisco, but some of the most dangerous cities in the U.S. are actually smaller or suburban cities, at least according to new per capita data from NeighborhoodScout.
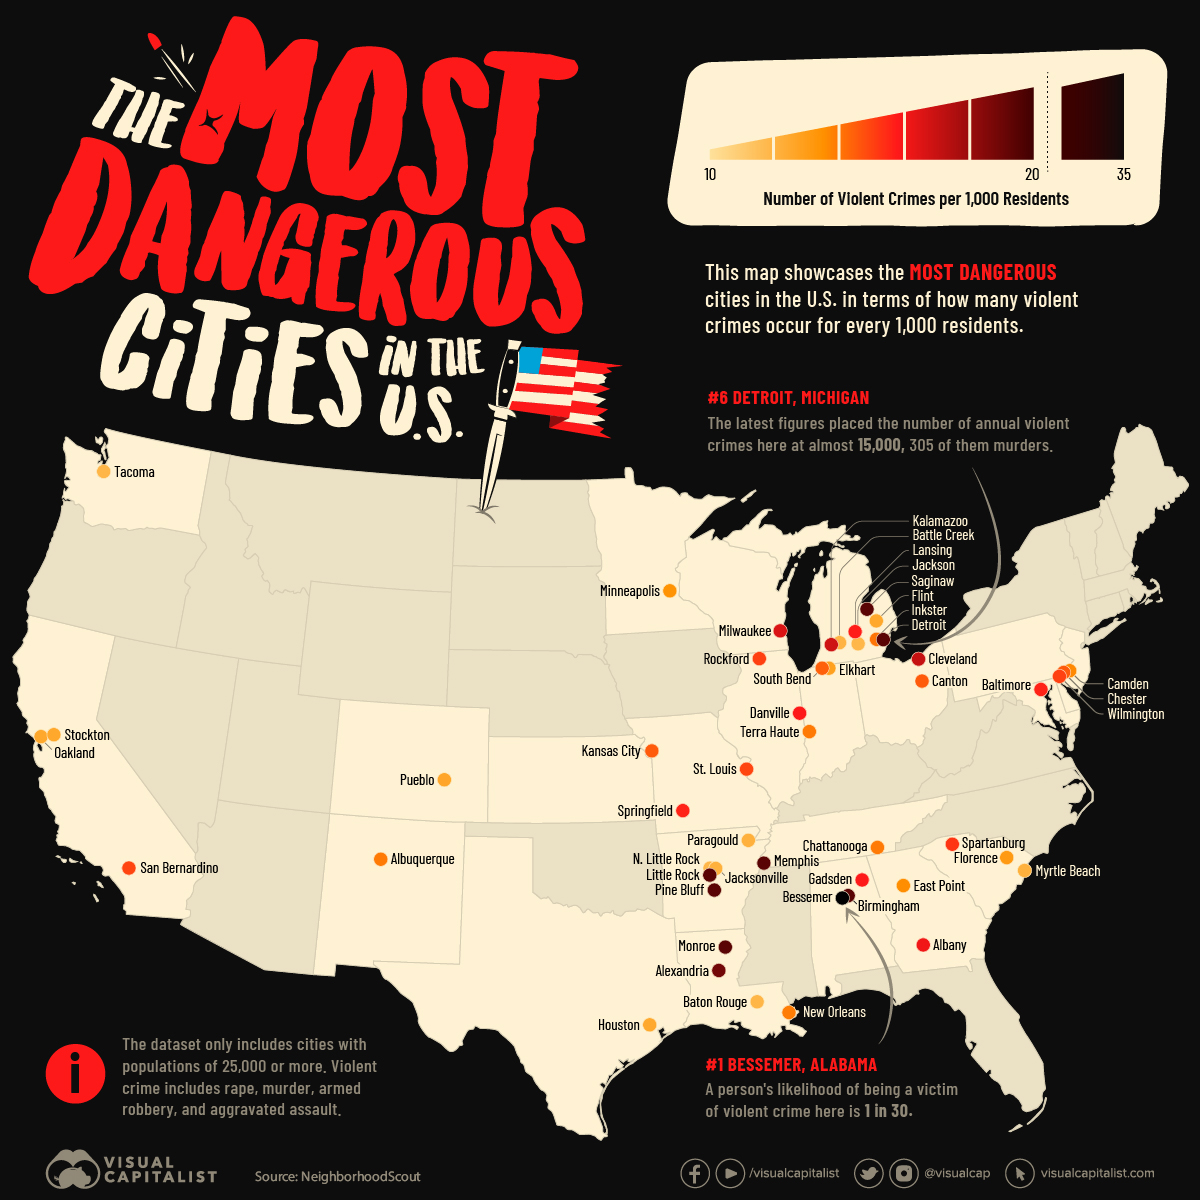
The map above reveals the most dangerous urban areas in the U.S., in terms of how many violent crimes occur for every 1,000 residents. It uses the latest FBI crime data and Census Bureau populations available in 2023.
Note: The source only considered cities with a population of 25,000 or higher. This report is based on reported violent crimes including armed robbery, murder, rape, and aggravated assault.
Top 100 Most Dangerous Cities in the U.S.
Though the most dangerous cities in the U.S. are spread across multiple states, Alabama is home to two of the 10 cities with the highest violent crime rates: Bessemer (#1) and Birmingham (#7).
Here’s a closer look at the full list:
| Rank | City | State | Violent Crime Rate (per 1,000 Residents) | Chance of Being a Victim |
|---|---|---|---|---|
| #1 | Bessemer | Alabama | 33.1 | 1 in 30 |
| #2 | Monroe | Louisiana | 26.3 | 1 in 38 |
| #3 | Saginaw | Michigan | 25.1 | 1 in 39 |
| #4 | Memphis | Tennessee | 25.1 | 1 in 39 |
| #5 | Detroit | Michigan | 23 | 1 in 43 |
| #6 | Birmingham | Alabama | 20.6 | 1 in 49 |
| #7 | Pine Bluff | Arkansas | 20.5 | 1 in 48 |
| #8 | Little Rock | Arkansas | 20.2 | 1 in 49 |
| #9 | Alexandria | Louisiana | 18.8 | 1 in 53 |
| #10 | Cleveland | Ohio | 17.1 | 1 in 58 |
| #11 | Kalamazoo | Michigan | 16.8 | 1 in 59 |
| #12 | Milwaukee | Wisconsin | 16.6 | 1 in 59 |
| #13 | Albany | Georgia | 16.1 | 1 in 61 |
| #14 | Gadsden | Alabama | 15.8 | 1 in 63 |
| #15 | Danville | Illinois | 15.8 | 1 in 63 |
| #16 | Lansing | Michigan | 15.7 | 1 in 63 |
| #17 | Baltimore | Maryland | 15.6 | 1 in 63 |
| #18 | Springfield | Missouri | 15.6 | 1 in 64 |
| #19 | Spartanburg | South Carolina | 15.2 | 1 in 65 |
| #20 | Rockford | Illinois | 15 | 1 in 66 |
| #21 | Wilmington | Delaware | 15 | 1 in 66 |
| #22 | St. Louis | Missouri | 14.9 | 1 in 66 |
| #23 | San Bernardino | California | 14.9 | 1 in 67 |
| #24 | Kansas City | Missouri | 14.5 | 1 in 68 |
| #25 | Canton | Ohio | 14.5 | 1 in 68 |
| #26 | Chester | Pennsyvlania | 14.5 | 1 in 68 |
| #27 | South Bend | Indiana | 14.4 | 1 in 69 |
| #28 | Inkster | Michigan | 14.1 | 1 in 70 |
| #29 | Albuquerque | New Mexico | 13.9 | 1 in 71 |
| #30 | Chattanooga | Tennessee | 13.9 | 1 in 71 |
| #31 | Terre Haute | Indiana | 13.9 | 1 in 71 |
| #32 | New Orleans | Louisiana | 13.8 | 1 in 72 |
| #33 | Camden | New Jersey | 13.7 | 1 in 72 |
| #34 | East Point | Georgia | 13.6 | 1 in 73 |
| #35 | Minneapolis | Minnesota | 13.4 | 1 in 74 |
| #36 | Florence | South Carolina | 13.1 | 1 in 75 |
| #37 | Elkhart | Indiana | 12.8 | 1 in 77 |
| #38 | Pueblo | Colorado | 12.6 | 1 in 79 |
| #39 | Stockton | California | 12.5 | 1 in 79 |
| #40 | Oakland | California | 12.5 | 1 in 79 |
| #41 | Flint | Michigan | 12.5 | 1 in 79 |
| #42 | Houston | Texas | 12.4 | 1 in 80 |
| #43 | Jacksonville | Arkansas | 12.1 | 1 in 82 |
| #44 | Myrtle Beach | South Carolina | 12.1 | 1 in 82 |
| #45 | Paragould | Arkansas | 12.1 | 1 in 82 |
| #46 | Battle Creek | Michigan | 12 | 1 in 82 |
| #47 | Tacoma | Washington | 11.9 | 1 in 83 |
| #48 | Baton Rouge | Louisiana | 11.9 | 1 in 83 |
| #49 | Jackson | Michigan | 11.8 | 1 in 84 |
| #50 | North Little Rock | Arkansas | 11.9 | 1 in 84 |
Both large cities and smaller ones make the list, with Memphis and Detroit the biggest cities to appear in the top 10 with populations above 600,000. A person’s chance of being a victim of violent crime in each is 1-in-39 and 1-in-43, respectively.
It’s worth noting that the numbers above are strictly for the most violent forms of crime, and don’t include things like simple assault and various forms of property crime. These push the total crime rate, and therefore the likelihood of becoming a victim of any crime, much higher in these hotspots.
And though there are well-known cities in the list, a few typically associated with crime don’t make even the top 100. For instance, New York City’s violent crime rate is 5.2 per 1,000 residents, with the chance of being a victim in Manhattan specifically at 1-in-192.
Crime in the United States
The violent crime rate for the entire U.S. is 5.6 per 1,000 people. Comparatively, the safest cities in the us have total crime rates of 8.6 per 1,000 people and lower.
It’s difficult to touch on violent crime in the U.S. without discussing gun violence. According to the Gun Violence Archive, there have already been more than 22,000 gun violence deaths in the U.S. as of July 2023. That includes 371 mass shootings, and 150 children deaths.
And though the latest annual FBI data shows that violent crime has decreased from 2020 to 2021, murders have gone up over the same time frame.
Source: NeighborhoodScout, using data from the FBI, and the U.S. Census Bureau.
Data notes: The source only considered cities with a population of 25,000 or higher. Violent crimes includes reported armed robbery, murder, rape, and aggravated assault.


Crime
Visualizing the Most Dangerous Countries in the World
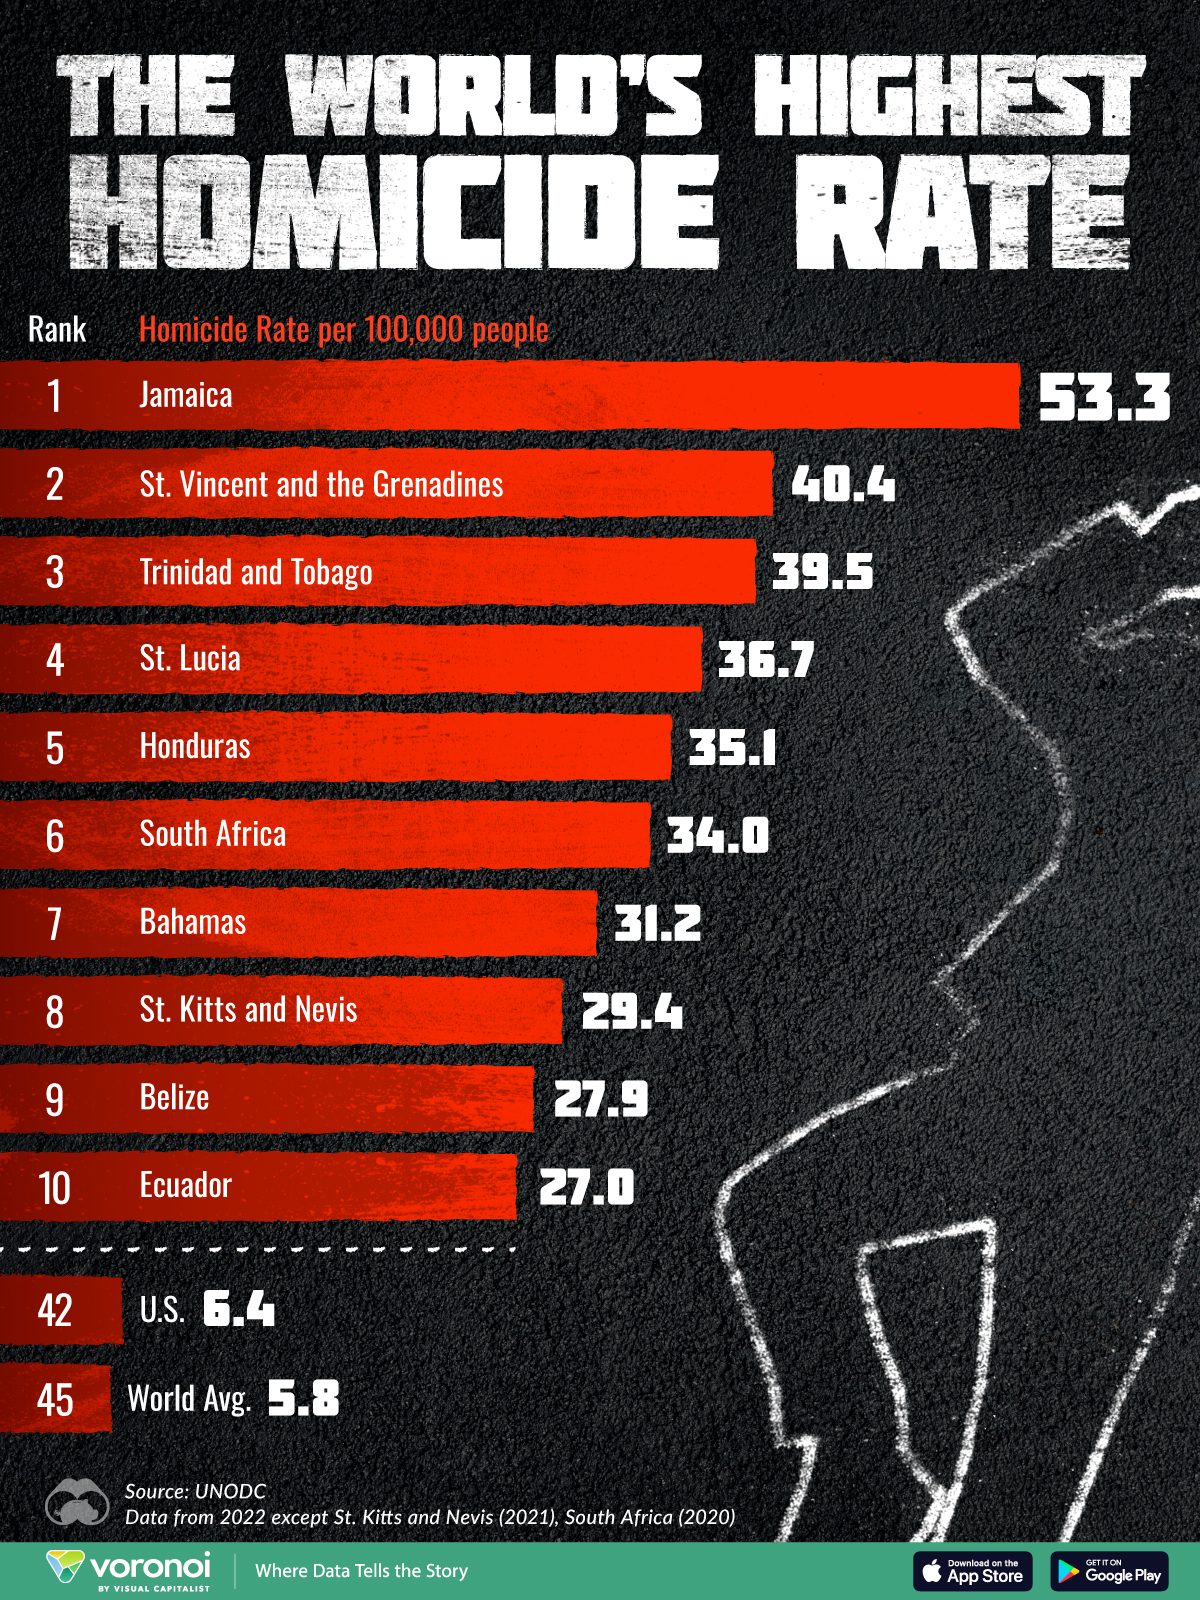
This graphic shows the top 10 most dangerous countries in the world, based on homicide rates per 100,000 people.
Visualizing the Most Dangerous Countries in the World
This was originally posted on our Voronoi app. Download the app for free on iOS or Android and discover incredible data-driven charts from a variety of trusted sources.
Several of the most dangerous countries in the world fall within a small radius in the Caribbean, a longstanding hotbed for organized crime.
These countries have homicide rates that are more than fourfold the rate of America, which stands at 6.4 per 100,000 people. Going further, the vast majority of killings are driven by criminal activity using illegal guns that are often smuggled in from the United States.
This graphic shows the countries with the highest murder rates, based on data from UNODC.
Top 10 Countries With the Highest Homicide Rates
Here are the countries with the most killings per 100,000 people as of 2022:
| Rank | Country | Homicide Rate per 100,000 People |
|---|---|---|
| 1 | 🇯🇲 Jamaica | 53.3 |
| 2 | 🇻🇨 St. Vincent and the Grenadines | 40.4 |
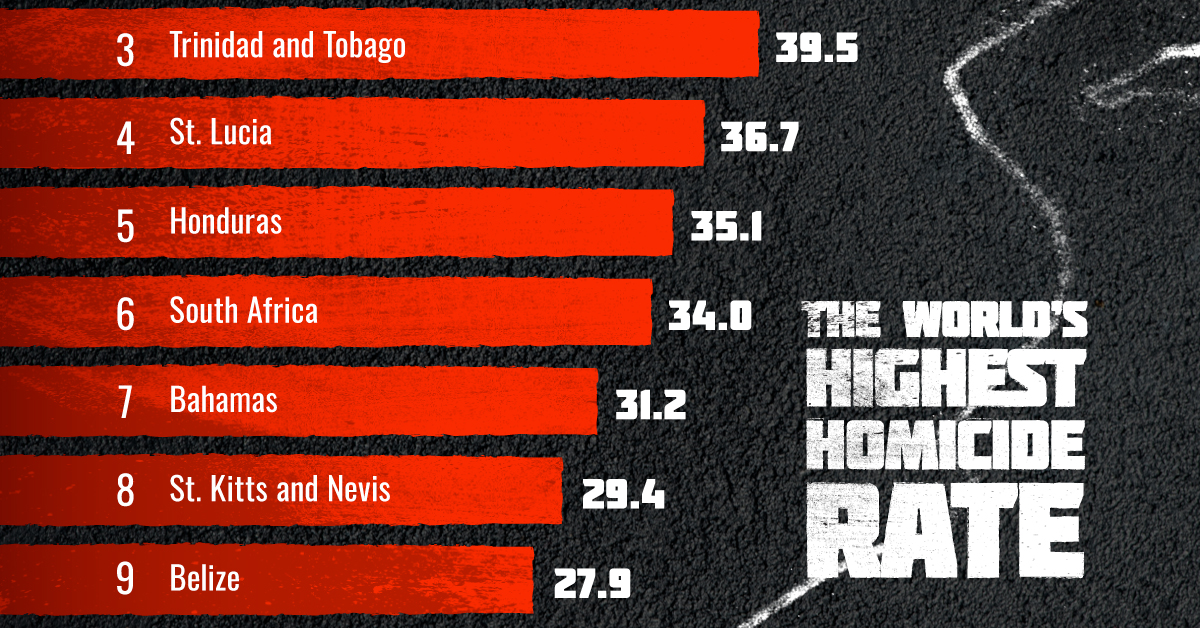
| 3 | 🇹🇹 Trinidad and Tobago | 39.5 |
| 4 | 🇱🇨 Saint Lucia | 36.7 |
| 5 | 🇭🇳 Honduras | 35.1 |
| 6 | 🇿🇦 South Africa | 34.0 |
| 7 | 🇧🇸 Bahamas | 31.2 |
| 8 | 🇰🇳 St. Kitts and Nevis | 29.4 |
| 9 | 🇧🇿 Belize | 27.9 |
| 10 | 🇪🇨 Ecuador | 27.0 |
| 🌍 World | 5.8 |
Data for St. Kitts and Nevis as of 2021. Data for South Africa as of 2020.
With a murder rate that is almost 10 times higher than the global average, Jamaica ranks first.
In January alone, there were 65 killings across the country, leading the State Department to heighten travel warnings for Americans. Not only that, homicides are even becoming more common in all-inclusive resorts. Often, police action is lackluster in response to the ongoing deadly incidents, and prosecution is slow.
Along with Jamaica, island nations Trinidad and Tobago and the Bahamas fall on this list.
Ranking sixth globally is South Africa, with a homicide rate of 34 per 100,000 people. Last year, 75 people on average were killed each day, while robberies averaged 400 daily. One part of the problem is that the country is known to have widespread criminal activity across mining, construction, and taxi industries. Another major factor is that the country serves as a transit hub for illicit drugs that are transported from Afghanistan to Europe.
In South America, Ecuador ranks as the most dangerous country, driven by escalating gang violence. While the country had some of the lowest homicide rates in the region in 2019, drug gangs have increasingly gripped the country.
In January, gang members stormed a news station, detonated bombs through the streets, and kidnapped policemen when the president issued a state of emergency after a notorious cartel leader escaped from prison. More recently, an Ecuadoran mayor was found dead amid the country’s third month in emergency lockdowns.

-

 Debt1 week ago
How Debt-to-GDP Ratios Have Changed Since 2000
-

 Demographics2 weeks ago
Population Projections: The World’s 6 Largest Countries in 2075
-

 Markets2 weeks ago
The Top 10 States by Real GDP Growth in 2023
-

 Demographics2 weeks ago
The Smallest Gender Wage Gaps in OECD Countries
-

 Economy2 weeks ago
Where U.S. Inflation Hit the Hardest in March 2024
-

 Green2 weeks ago
Top Countries By Forest Growth Since 2001
-

 United States2 weeks ago
Ranked: The Largest U.S. Corporations by Number of Employees
-

 Maps2 weeks ago
The Largest Earthquakes in the New York Area (1970-2024)