Maps
Vintage Viz: The World’s Rivers and Lakes, Organized Neatly
Vintage Viz: The World’s Rivers and Lakes, Organized Neatly
Rivers and lakes have borne witness to many of humanity’s greatest moments.
In the first century BCE, the Rubicon not only marked the border between the Roman provinces of Gaul and Italia, but also the threshold for civil war. From the shores of Lake Van in 1071, you could witness the Battle of Manzikert and the beginning of the end for the Byzantine Empire.
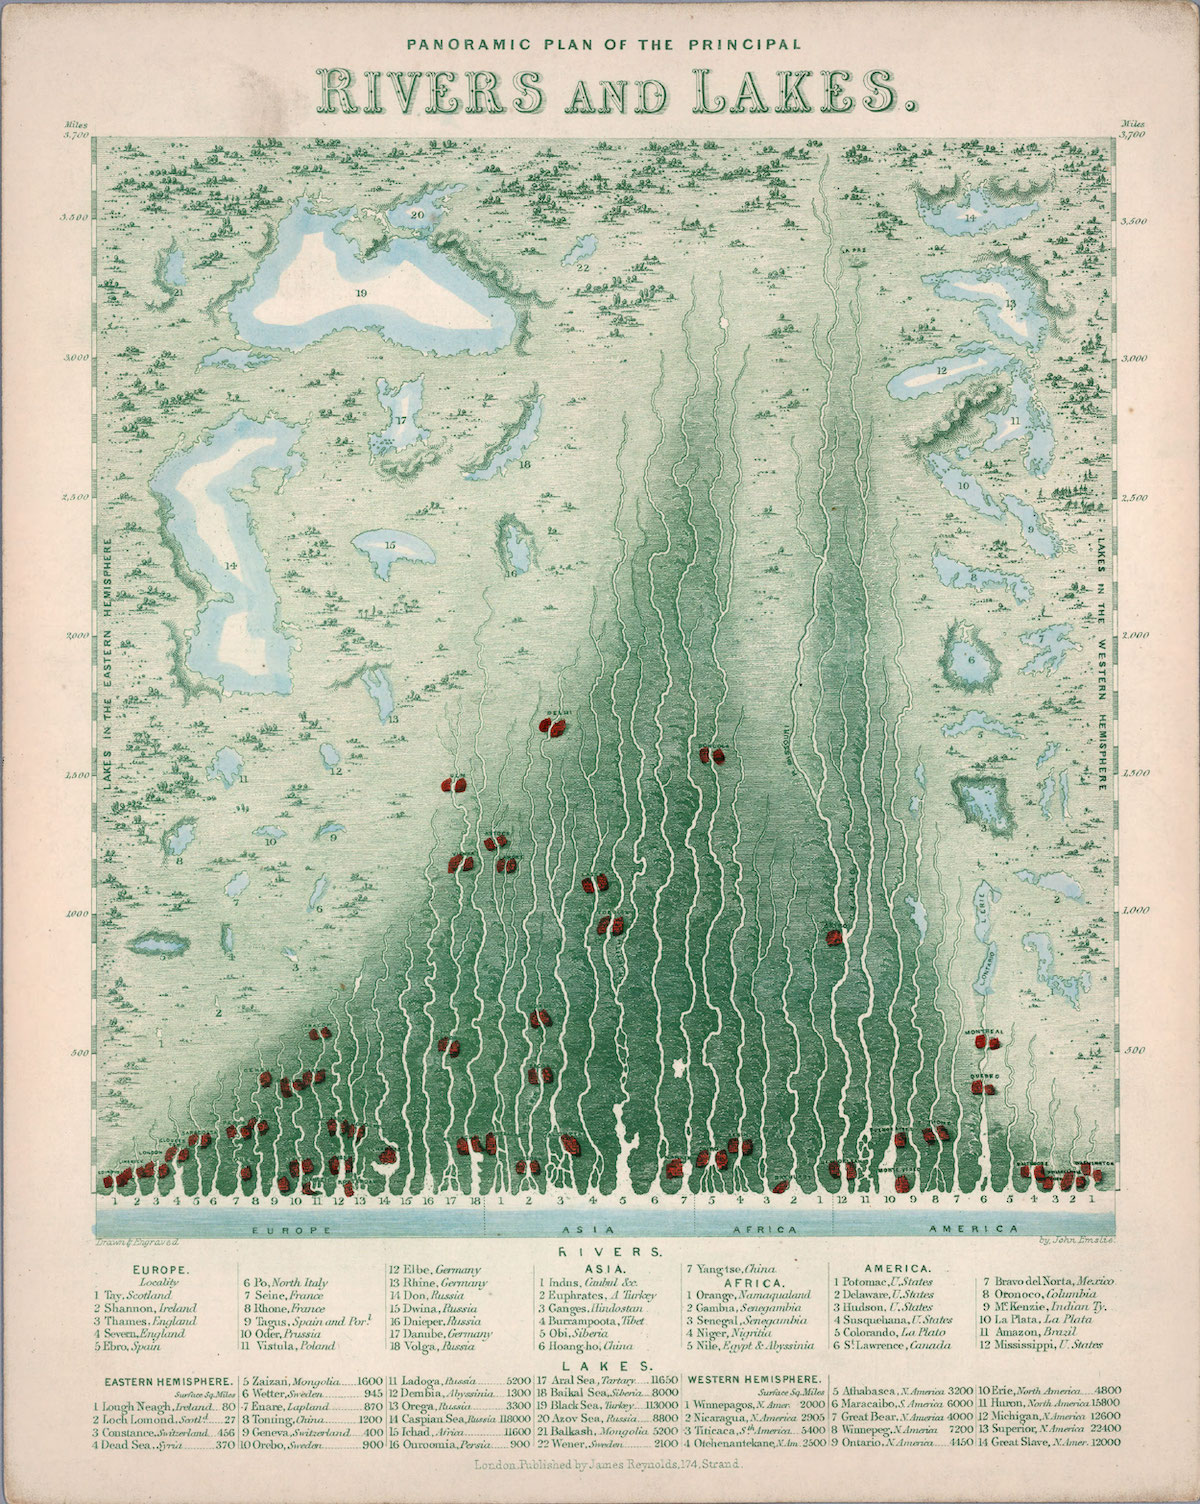
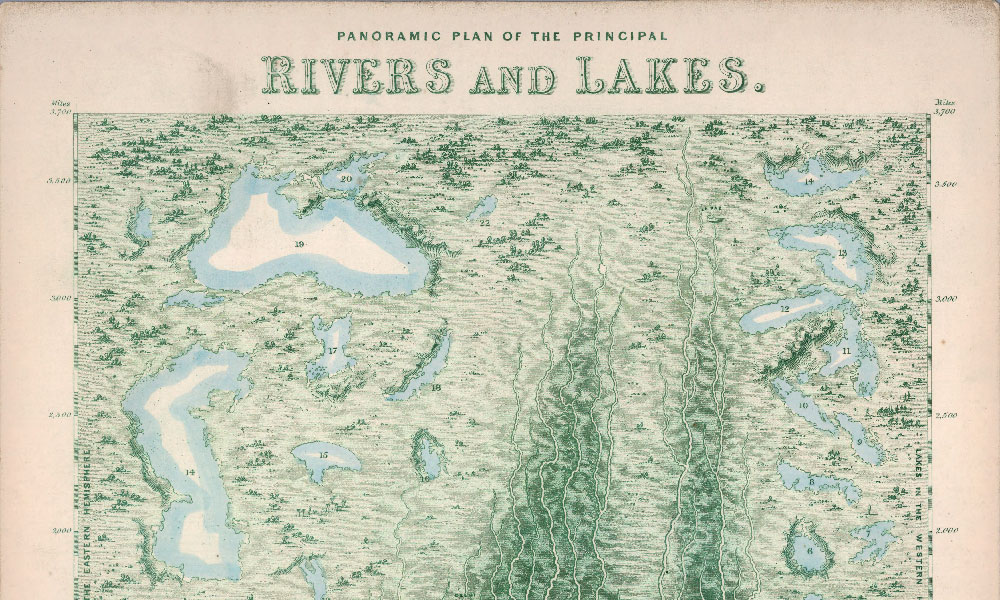
Rivers carry our trade, our dead, and even our prayers, so when London mapmaker James Reynolds partnered with engraver John Emslie to publish the Panoramic Plan of the Principal Rivers and Lakes in 1850, he could be sure of a warm reception.
The visualization, the latest in our Vintage Viz series, beautifully illustrates 42 principal rivers in Europe, Asia, Africa, and the Americas, along with 36 lakes across the Eastern and Western hemispheres. Each river has been unraveled and straightened onto an imaginary landscape-–no meandering here—and arranged by size. Major cities are marked by a deep orangy-red.
Top 3 Longest Principal Rivers (in 1850)
According to this visualization, the Mighty Mississippi is among the world’s longest, coming in at 3,650 miles, followed by the Amazon, the Nile, and the Yangtze river in China. The bottom three are the Tay in Scotland (125 miles), the Shannon in Ireland (200 miles), and the Potomac in the U.S. (275 miles).
Surveying methods have come a long way since 1850, and we now have satellites, GPS, and lasers, so we can update these rankings. According to the CIA World Factbook, the Nile (6,650 km / 4,132 miles), the Amazon (6,436 km / 3,998 miles), and the Yangtze (6,300 km / 3,915 miles) are the world’s top three longest rivers.
The table below shows the rivers in the graphic above compared with today’s measurements, as well as the general location of rivers using 1850 location names (including modern day locations in brackets).
| River | Territory | Viz length (miles) | Modern length (miles) |
|---|---|---|---|
| Mississippi | United States | 3,650 | 2,340 |
| Amazon | Brazil | 3,350 | 3,998 |
| Nile | Egypt and Abyssinia (Ethiopia) | 3,325 | 4,132 |
| Yangtse | China | 3,300 | 3,915 |
| Hoang-ho | China | 3,025 | 3,395 |
| Obi | Siberia | 2,800 | 2,268 |
| La Plata | La Plata (Argentina/Uruguay) | 2,450 | 3,030 |
| Volga | Russia | 2,200 | 2,193 |
| Burrampoota | Tibet | 2,200 | 1,800 |
| Ganges | Hindostan (India) | 1,975 | 1,569 |
| Euphrates | A(siatic) Turkey | 1,850 | 1,740 |
| Danube | Germany | 1,800 | 1,770 |
| Niger | Nigeria | 1,750 | 2,600 |
| Indus | Caubul etc (Afghanistan etc) | 1,700 | 1,988 |
| McKenzie | Indian Territory (Canada) | 1,600 | 1,080 |
| Senegal | Senegambia (Senegal) | 1,450 | 1,020 |
| Dnieper | Russia | 1,375 | 1,367 |
| Oronoco | Gran Colombia (Venezuela) | 1,325 | 1,700 |
| Gambia | Senegambia (The Gambia) | 1,300 | 740 |
| Bravo del Norta (Rio Grande) | Mexico | 1,150 | 1,900 |
| St. Lawrence | Canada | 1,125 | 1,900 |
| Orange | Namaqualand (Namibia/South Africa) | 1,100 | 1,367 |
| Dwina | Russia | 1,000 | 1,020 |
| Don | Russia | 975 | 1,198 |
| Rhine | Germany | 850 | 766 |
| Elbe | Germany | 750 | 724 |
| Vistula | Poland | 650 | 651 |
| Oder | Prussia (Germany) | 625 | 529 |
| Colorando | La Plato (United States) | 600 | 1,450 |
| Tague | Spain and Portugal | 575 | 626 |
| Susquehana | United States | 575 | 464 |
| Rhone | France | 550 | 505 |
| Seine | France | 475 | 485 |
| Po | North Italy | 450 | 405 |
| Hudson | United States | 425 | 315 |
| Ebro | Spain | 400 | 565 |
| Severn | England | 350 | 220 |
| Delaware | United States | 325 | 301 |
| Potomac | United States | 275 | 405 |
| Thames | England | 275 | 215 |
| Shannon | Ireland | 200 | 224 |
| Tay | Scotland | 125 | 117 |
These figures are a unique look into a time period where humanity’s efforts to quantify the world were still very much a work in progress.
Editor’s note: Some of the rivers and lakes are spelled slightly differently in 1850 than they are today. For example, the map notes today’s Mackenzie River (Canada) as the McKenzie River, and the Yangtze River (China) as the Yangtse.
O Say, Can You Sea?
The largest ‘lake’ in this visualization is the Caspian Sea (118,000 sq. miles), followed by the Black Sea (113,000 sq. miles), and the greatest of the Great Lakes, Lake Superior (22,400 sq. miles). While the Caspian Sea is considered a saltwater lake and could reasonably have a place here, the Black Sea—possibly bearing that name because of the color black’s association with “north”—is not a lake by any stretch of the imagination.
And while many of the surface areas reported could also be updated with modern estimates, the story behind Lake Chad (called Ichad in the visualization), the Aral Sea, and the Dead Sea are altogether different. Human development, unsustainable water use, and climate change have led to dramatic drops in water levels.
The Dead Sea in particular had a surface area of 405 sq. miles (1,050 km2) in 1930, but has since dropped to 234 sq. miles (606.1 km2) in 2016.
| Lake | Territory | Viz surface area (sq. miles) | Modern surface area (sq. miles) |
|---|---|---|---|
| Caspian Sea | Russia | 118,000 | 143,000 |
| Black Sea | Turkey | 113,000 | 168,500 |
| Superior | North America | 22,400 | 31,700 |
| Huron | North America | 15,800 | 23,007 |
| Michigan | North America | 12,600 | 22,404 |
| Great Slave | North America | 12,000 | 10,500 |
| Aral Sea | Tartary (Central Eurasia) | 11,650 | 6,900 |
| Ichad | Africa | 11,600 | 590 |
| Azov | Russia | 8,800 | 14,500 |
| Baikal Sea | Siberia | 8,000 | 12,248 |
| Winnepeg | North America | 7,200 | 9,416 |
| Maracaibo | South America | 6,000 | 5,130 |
| Titicaca | South America | 5,400 | 3,030 |
| Ladoga | Russia | 5,200 | 6,700 |
| Balkash | Mongolia | 5,200 | 7,000 |
| Erie | North America | 4,800 | 9,910 |
| Ontario | North America | 4,450 | 7,340 |
| Great Bear | North America | 4,000 | 12,028 |
| Orega | Russia | 3,300 | 3,700 |
| Athabasca | North America | 3,200 | 3,030 |
| Nicaragua | North America | 2,905 | 3,149 |
| Otehenantekane | North America | 2,500 | 2,500 |
| Wener | Sweden | 2,100 | 2,181 |
| Winnepagos | North America | 2,000 | 2,070 |
| Zaizan | Mongolia | 1,600 | 700 |
| Dembia | Abyssinia (Ethiopia) | 1,300 | 1,418 |
| Tonting | China | 1,200 | 1,090 |
| Wetter | Sweden | 945 | 738 |
| Orebo | Sweden | 900 | 186 |
| Ouroomia | Persia | 900 | 1,126 |
| Enare | Lapland (Finland) | 870 | 1,040 |
| Constance | Scotland | 456 | 209 |
| Geneva | Swtizerland | 400 | 224 |
| Dead Sea | Syria | 370 | 605 |
| Lough Neagh | Ireland | 80 | 153 |
| Loch Lomond | Scotland | 27 | 27 |
You Can’t Step in the Same River Twice
Over time, natural and anthropogenic forces cause rivers to change their course, and lakes to shift their banks. If Reynolds and Emslie were alive today to update this visualization, it would likely look quite different, as would one made 100 years from now. But so goes the river of time.


Maps
The Largest Earthquakes in the New York Area (1970-2024)
The earthquake that shook buildings across New York in April 2024 was the third-largest quake in the Northeast U.S. over the past 50 years.


The Largest Earthquakes in the New York Area
This was originally posted on our Voronoi app. Download the app for free on Apple or Android and discover incredible data-driven charts from a variety of trusted sources.
The 4.8 magnitude earthquake that shook buildings across New York on Friday, April 5th, 2024 was the third-largest quake in the U.S. Northeast area over the past 50 years.
In this map, we illustrate earthquakes with a magnitude of 4.0 or greater recorded in the Northeastern U.S. since 1970, according to the United States Geological Survey (USGS).
Shallow Quakes and Older Buildings
The earthquake that struck the U.S. Northeast in April 2024 was felt by millions of people from Washington, D.C., to north of Boston. It even caused a full ground stop at Newark Airport.
The quake, occurring just 5 km beneath the Earth’s surface, was considered shallow, which is what contributed to more intense shaking at the surface.
According to the USGS, rocks in the eastern U.S. are significantly older, denser, and harder than those on the western side, compressed by time. This makes them more efficient conduits for seismic energy. Additionally, buildings in the Northeast tend to be older and may not adhere to the latest earthquake codes.
Despite disrupting work and school life, the earthquake was considered minor, according to the Michigan Technological University magnitude scale:
| Magnitude | Earthquake Effects | Estimated Number Each Year |
|---|---|---|
| 2.5 or less | Usually not felt, but can be recorded by seismograph. | Millions |
| 2.5 to 5.4 | Often felt, but only causes minor damage. | 500,000 |
| 5.5 to 6.0 | Slight damage to buildings and other structures. | 350 |
| 6.1 to 6.9 | May cause a lot of damage in very populated areas. | 100 |
| 7.0 to 7.9 | Major earthquake. Serious damage. | 10-15 |
| 8.0 or greater | Great earthquake. Can totally destroy communities near the epicenter. | One every year or two |
The largest earthquake felt in the area over the past 50 years was a 5.3 magnitude quake that occurred in Au Sable Forks, New York, in 2002. It damaged houses and cracked roads in a remote corner of the Adirondack Mountains, but caused no injuries.
| Date | Magnitude | Location | State |
|---|---|---|---|
| April 20, 2002 | 5.3 | Au Sable Forks | New York |
| October 7, 1983 | 5.1 | Newcomb | New York |
| April 5, 2024 | 4.8 | Whitehouse Station | New Jersey |
| October 16, 2012 | 4.7 | Hollis Center | Maine |
| January 16, 1994 | 4.6 | Sinking Spring | Pennsylvania |
| January 19, 1982 | 4.5 | Sanbornton | New Hampshire |
| September 25, 1998 | 4.5 | Adamsville | Pennsylvania |
| June 9, 1975 | 4.2 | Altona | New York |
| May 29, 1983 | 4.2 | Peru | Maine |
| April 23, 1984 | 4.2 | Conestoga | Pennsylvania |
| January 16, 1994 | 4.2 | Sinking Spring | Pennsylvania |
| November 3, 1975 | 4 | Long Lake | New York |
| June 17, 1991 | 4 | Worcester | New York |
The largest earthquake in U.S. history, however, was the 1964 Good Friday quake in Alaska, measuring 9.2 magnitude and killing 131 people.

-

 Debt1 week ago
How Debt-to-GDP Ratios Have Changed Since 2000
-

 Markets2 weeks ago
Ranked: The World’s Top Flight Routes, by Revenue
-

 Countries2 weeks ago
Population Projections: The World’s 6 Largest Countries in 2075
-

 Markets2 weeks ago
The Top 10 States by Real GDP Growth in 2023
-

 Demographics2 weeks ago
The Smallest Gender Wage Gaps in OECD Countries
-

 United States2 weeks ago
Where U.S. Inflation Hit the Hardest in March 2024
-

 Green2 weeks ago
Top Countries By Forest Growth Since 2001
-

 United States2 weeks ago
Ranked: The Largest U.S. Corporations by Number of Employees