

We compiled the performance of 10 pure play EV stocks into one chart, revealing one company that bucked the broader trend.


See how the Nasdaq debut of Trump Media & Technology Group has influenced Trump's net worth, according to Forbes estimates.


The 12 worst investment funds have destroyed $56 billion in shareholder wealth over the past decade, as of Dec. 2023.


With trillion dollar valuations becoming more common, we've compared the five biggest companies by stock exchange.


We visualize the recent performance of the Magnificent Seven stocks, uncovering a clear divergence between the group's top and bottom names.

Nvidia broke the record for the largest single-day market cap gains after adding nearly $250B on Feb. 22, 2024.

Jin Medical, the top IPO of the year, is set to be delisted due to a listing rule violation.

The Chinese EV battery company U Power experienced the worst IPO performance in 2023.

Here are the top 25 largest stock exchanges in the world, worth a combined $106 trillion in market capitalization in 2023.
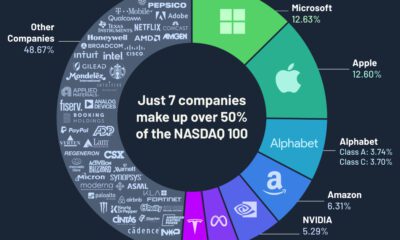

Just seven companies make up over 50% of the Nasdaq 100 by weight, and most of them are from the technology sector.