Stocks
Charted: Companies in the Nasdaq 100, by Weight
Article/Editing:
Charted: Companies in the Nasdaq 100, by Weight
Launched in 1985, the Nasdaq 100 index tracks the performance of the largest, and most actively-traded, non-financial companies listed on the Nasdaq stock exchange.
The index is capitalization-weighted, meaning that stock weights in the index are based on each company’s market cap (with some rules to rebalance if companies have an oversized influence). For example, leaders Apple and Microsoft amounted to more than one-fourth of the Nasdaq 100’s total market capitalization alone as of April 2023.
One of the most well-known trackers of the index, Invesco QQQ’s ETF, is the data source for today’s visualization by Truman Du.
Just 7 Companies Dominate the Nasdaq 100
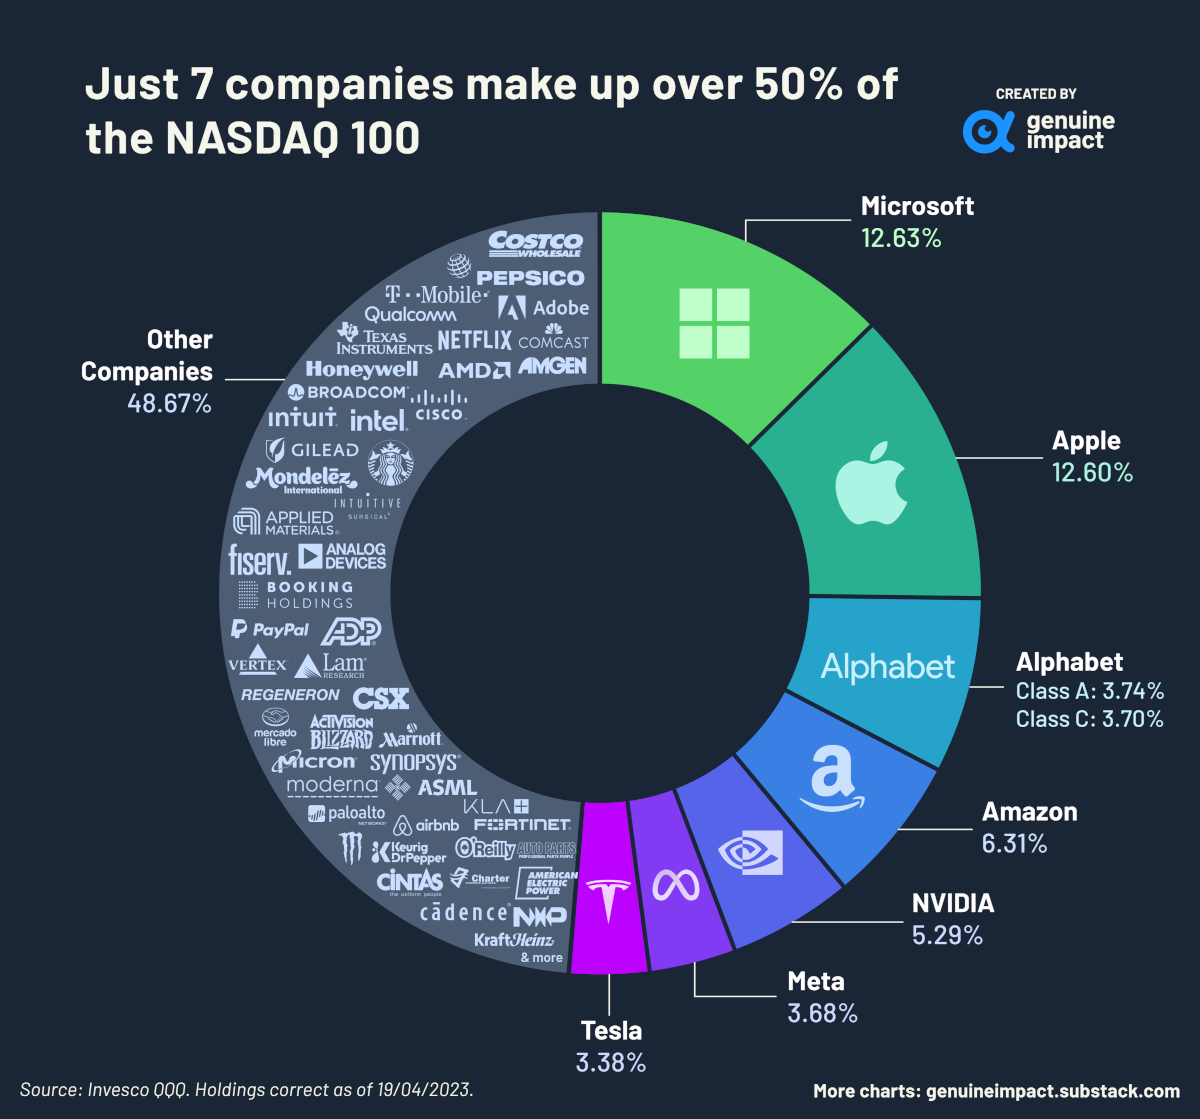
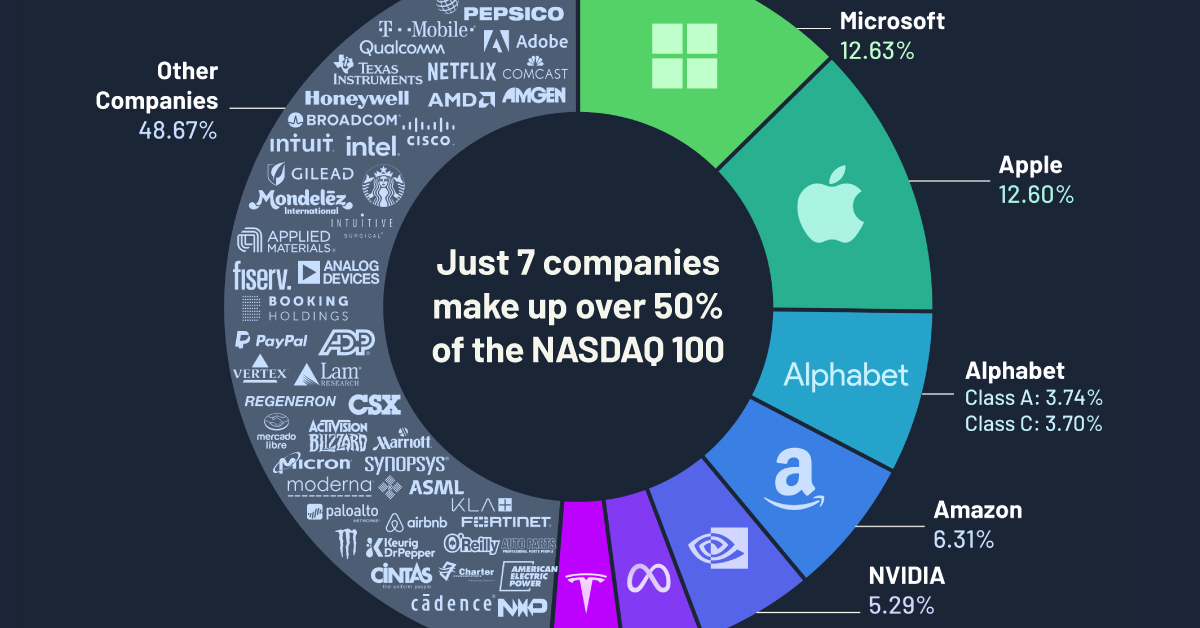
Microsoft and Apple, together with the next five ranked companies, made up over 50% of the total weight of the index in April. These companies are: Alphabet (Google), Amazon, NVIDIA, Meta, and Tesla, with Alphabet’s class A and class C shares occupying two spots.
Here’s a breakdown of all 100 companies on the Nasdaq 100, by percentage weight in the index on April 19, 2023.
| Company | Allocation |
|---|---|
| Microsoft | 12.63% |
| Apple | 12.60% |
| Amazon | 6.31% |
| NVIDIA | 5.29% |
| Alphabet (Class A) | 3.74% |
| Alphabet (Class C) | 3.70% |
| Meta (Class A) | 3.68% |
| Tesla | 3.38% |
| Broadcom | 2.03% |
| PepsiCo | 1.95% |
| Costco | 1.69% |
| Cisco | 1.51% |
| T-Mobile | 1.39% |
| Adobe | 1.33% |
| Comcast (Class A) | 1.23% |
| Texas Instruments | 1.23% |
| AMD | 1.11% |
| Netflix | 1.10% |
| Qualcomm | 1.01% |
| Honeywell International | 1.01% |
| Amgen | 1.01% |
| Intel | 0.99% |
| Intuit | 0.96% |
| Starbucks | 0.94% |
| Gilead Sciences | 0.80% |
| Intuitive Surgical | 0.80% |
| Booking Holdings | 0.77% |
| Mondelez International (Class A) | 0.74% |
| Analog Devices | 0.73% |
| Applied Materials | 0.71% |
| Automatic Data Processing | 0.69% |
| Regeneron Pharmaceuticals | 0.67% |
| PayPal Holdings | 0.65% |
| Vertex Pharmaceuticals | 0.65% |
| Fiserv | 0.56% |
| Activision Blizzard | 0.51% |
| Lam Research | 0.51% |
| Micron Technology | 0.51% |
| MercadoLibre | 0.50% |
| CSX Corp | 0.48% |
| Palo Alto Networks | 0.45% |
| Cadence Design | 0.45% |
| Synopsys | 0.44% |
| O'Reilly Automotive | 0.43% |
| Moderna | 0.42% |
| ASML Holding NV ADR | 0.42% |
| Monster Beverage | 0.42% |
| Marriott (Class A) | 0.41% |
| Fortinet | 0.40% |
| Charter Communications (Class A) | 0.40% |
| KLA Corp | 0.38% |
| Keurig Dr Pepper | 0.38% |
| Airbnb (Class A) | 0.38% |
| Kraft Heinz | 0.37% |
| American Electric Power | 0.37% |
| DexCom | 0.37% |
| Cintas Corp | 0.35% |
| Lululemon | 0.35% |
| AstraZeneca PLC ADR | 0.35% |
| NXP Semiconductors NV | 0.34% |
| Microchip Technology | 0.33% |
| Exelon Corp | 0.33% |
| Autodesk | 0.33% |
| Biogen | 0.32% |
| PDD Holdings Inc ADR | 0.32% |
| IDEXX Laboratories | 0.31% |
| Paychex | 0.30% |
| Workday (Class A) | 0.30% |
| Xcel Energy | 0.30% |
| Seagen | 0.29% |
| PACCAR | 0.29% |
| ODFL | 0.29% |
| Copart | 0.29% |
| Illumina | 0.28% |
| Ross Stores | 0.28% |
| EA | 0.27% |
| Marvell Technology | 0.27% |
| Global Foundries | 0.27% |
| Warner Bros. Discovery (Class A) | 0.27% |
| Dollar Tree | 0.25% |
| Baker Hughes (Class A) | 0.24% |
| Fastenal | 0.24% |
| Cognizant (Class A) | 0.24% |
| Enphase Energy | 0.23% |
| Walgreens Boots | 0.23% |
| Verisk Analytics | 0.23% |
| CrowdStrike Holdings (Class A) | 0.22% |
| CoStar Group | 0.22% |
| Ansys | 0.22% |
| Align Technology | 0.21% |
| Diamondback Energy | 0.20% |
| Constellation Energy | 0.19% |
| Atlassian Corp A | 0.19% |
| eBay | 0.18% |
| Datadog (Class A) | 0.16% |
| JD.com ADR | 0.13% |
| Zoom | 0.13% |
| Sirius XM Holdings | 0.12% |
| Zscaler | 0.11% |
| Lucid Group | 0.11% |
| Rivian (Class A) | 0.09% |
The dominance of these seven companies within the NASDAQ 100 is a reflection of how central they are to large parts of the wider consumer economy. The economic output and influence of the tech giants speaks for themselves, and Tesla still leads the (rapidly crowding) electric vehicle market.
Perhaps the underdog of the bunch is NVIDIA, which produces graphics processing units (GPUs) that power the visuals in many electronic devices and, more recently, artificial intelligence (AI) systems. The latter in particular has made investors incredibly bullish on the company, as NVIDIA’s stock has risen and the company has recently joined the coveted $1 trillion club.
It’s important to note that this snapshot changes drastically over time. For example, Intel and Cisco were massive components of the Nasdaq 100 in the 2000s but have seen their allocations drop, while others like Yahoo! are no longer publicly traded.
The Pros and Cons of Market Consolidation
Such imbalance in the Nasdaq 100 has both benefits and downsides.
The success of the biggest contingents can pull up the entire index, and the Nasdaq 100 has consistently outperformed broader markets. In fact, $10,000 invested in the Nasdaq 100 in 2013 would be worth $50,000 today, while the same investment in the S&P 500 would now be $30,000.
However, if even one of these large companies underperforms, it can have a major impact on the entire index. This outsized influence can also hide general market woes that may be affecting many other components of the index, and the economy.
With the advent of large language models of AI in 2022, the tech sector is on a precipice. Will AI lead to further profitability—and bigger market caps—or will it render entire companies defunct, leading to a big shakeup in the composition of the Nasdaq 100 index?

This article was published as a part of Visual Capitalist's Creator Program, which features data-driven visuals from some of our favorite Creators around the world.


Markets
Visualizing the Biggest Companies on Major Stock Exchanges
With trillion dollar valuations becoming more common, we’ve compared the five biggest companies by stock exchange.
Comparing the Top Five Companies on Major Stock Exchanges
This was originally posted on our Voronoi app. Download the app for free on iOS or Android and discover incredible data-driven charts from a variety of trusted sources.
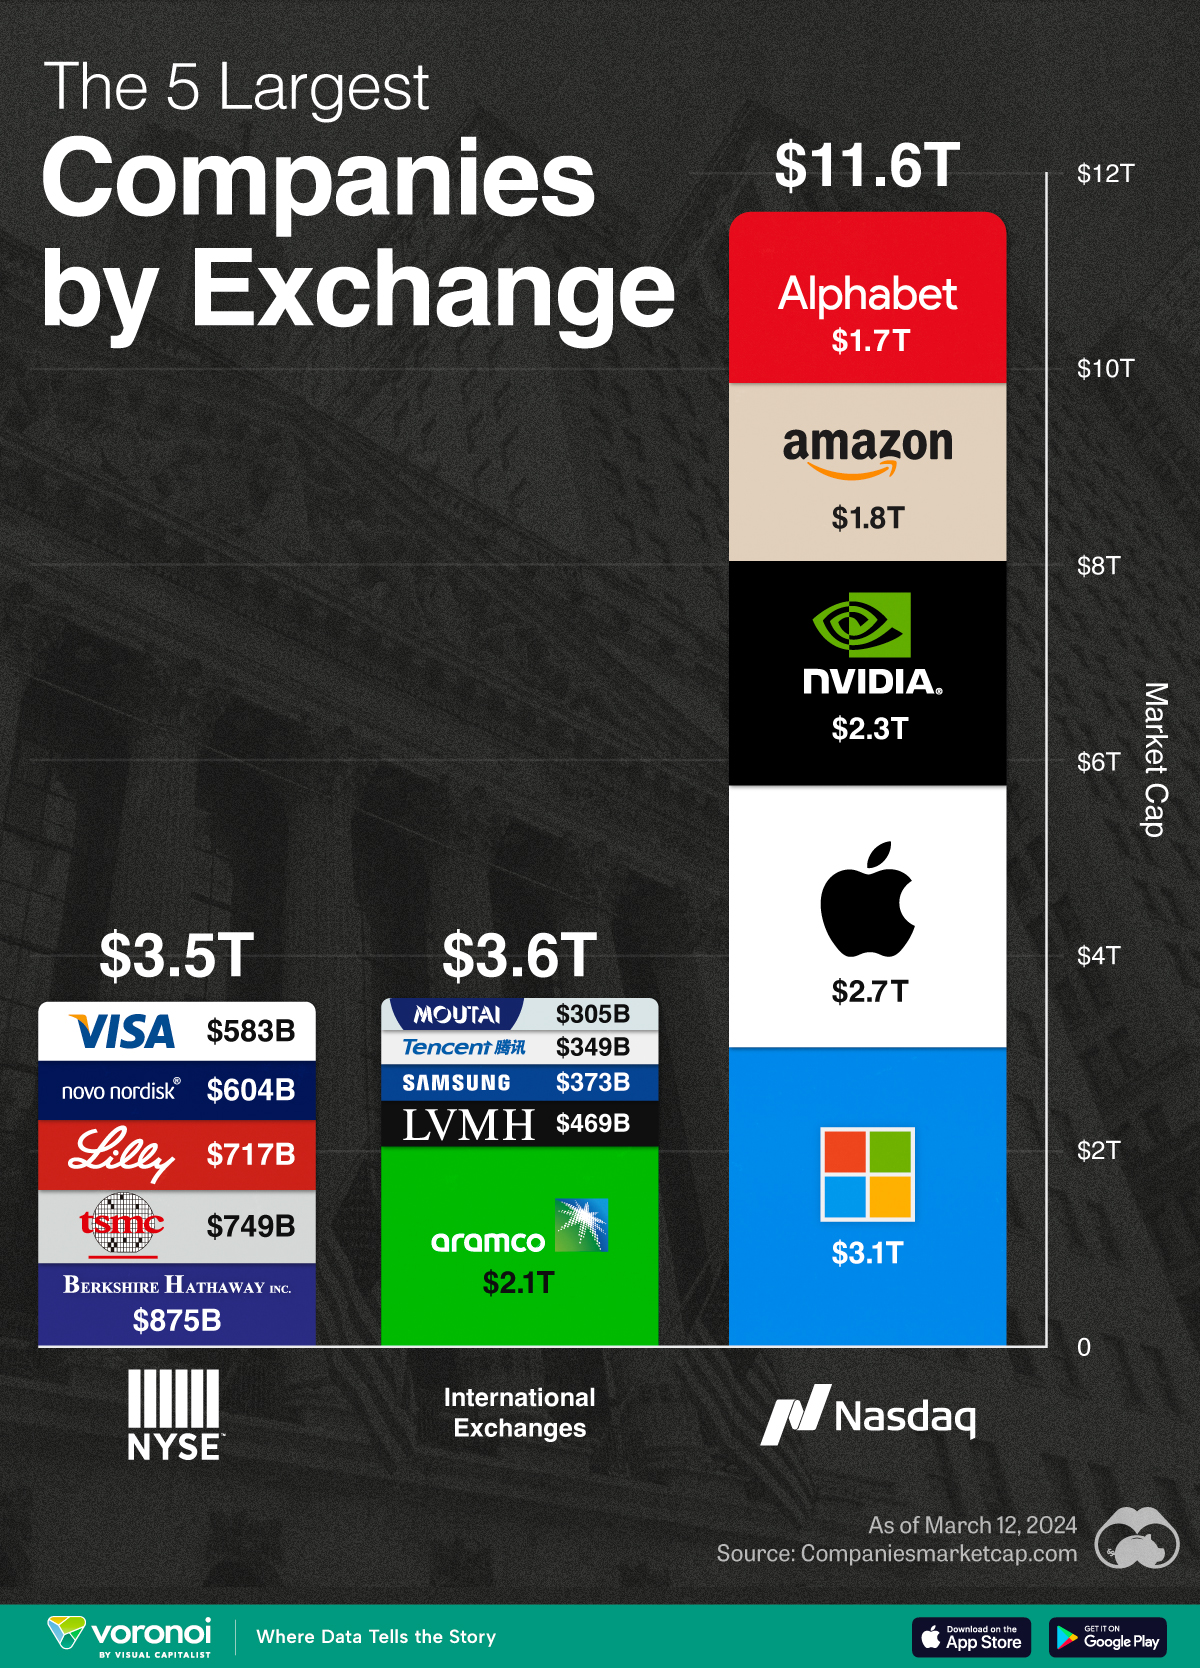
With many companies nearing or surpassing the $1 trillion market capitalization milestone, we’ve put together a graphic that visualizes the five largest companies trading on the Nasdaq, New York Stock Exchange (NYSE), and international exchanges.
These figures come from Companiesmarketcap.com, and are as of March 12, 2024.
Biggest Companies on the Nasdaq
The Nasdaq is largely dominated by the tech industry, with all of its top five companies belonging to the Magnificent Seven group of U.S. tech stocks.
| Company | Market Cap (USD) |
|---|---|
| 🇺🇸 Microsoft | $3.1T |
| 🇺🇸 Apple | $2.7T |
| 🇺🇸 Nvidia | $2.3T |
| 🇺🇸 Amazon | $1.8T |
| $1.7T |
Altogether, these five companies have a combined market capitalization of nearly $12 trillion. To put this figure into context, the entire U.S. equity market is worth around $53 trillion.
Biggest Companies on the NYSE
The NYSE’s largest companies are more diversified, with a combination of tech, financial services, and healthcare names present. Among this list, Warren Buffett’s Berkshire Hathaway is the closest to becoming the next trillion dollar company.
| Company | Market Cap (USD) |
|---|---|
| 🇺🇸 Berkshire Hathaway | $875B |
| 🇹🇼 TSMC | $749B |
| 🇺🇸 Eli Lilly | $717B |
| 🇩🇰 Novo Nordisk | $604B |
| 🇺🇸 Visa | $583B |
Biggest Companies on International Exchanges
Saudi Aramco is the largest public company listed outside of the U.S., with a mammoth $2.1 trillion valuation.
| Company | Market Cap (USD) |
|---|---|
| 🇸🇦 Saudi Aramco | $2.1T |
| 🇫🇷 LVMH | $469B |
| 🇰🇷 Samsung | $373B |
| 🇨🇳 Tencent | $349B |
| 🇨🇳 Kweichow Moutai | $305B |
It should be noted, however, that the Saudi government directly owns 90% of the company, while another 8% is held by the country’s sovereign wealth fund.
This means that only 2% of shares are actually available to the public, prompting one Bloomberg columnist to call the firm’s valuation an “illusion”.

-

 Science1 week ago
Visualizing the Average Lifespans of Mammals
-

 Markets2 weeks ago
The Top 10 States by Real GDP Growth in 2023
-

 Demographics2 weeks ago
The Smallest Gender Wage Gaps in OECD Countries
-

 United States2 weeks ago
Where U.S. Inflation Hit the Hardest in March 2024
-

 Green2 weeks ago
Top Countries By Forest Growth Since 2001
-

 United States2 weeks ago
Ranked: The Largest U.S. Corporations by Number of Employees
-

 Maps2 weeks ago
The Largest Earthquakes in the New York Area (1970-2024)
-

 Green2 weeks ago
Ranked: The Countries With the Most Air Pollution in 2023