Misc
The Most Popular Halloween Costumes of 2021
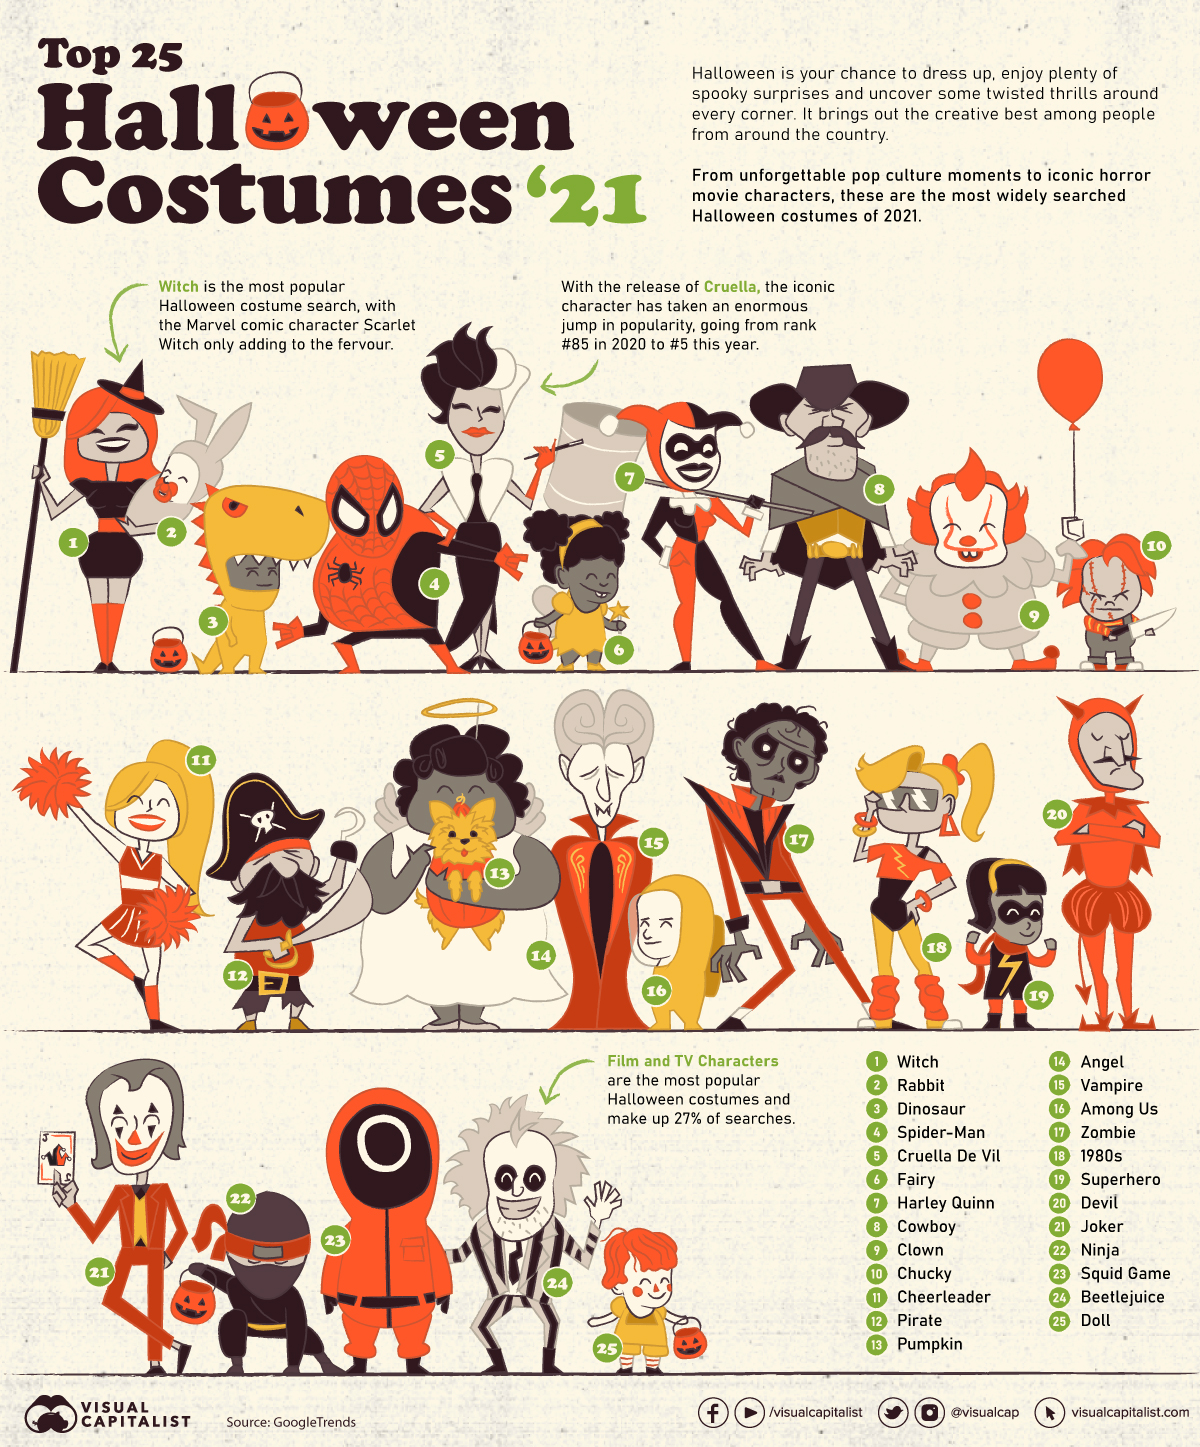
The Most Popular Halloween Costumes of 2021
Halloween—it’s the time of year when kids and adults alike dress up, eat candy, and show off their spookiest selves. It’s also when the scariest home decorations are the talk of the town, and people are frightened left, right, and center.
With the help of data from Google Trends and their unique Frightgeist series, we visualized the most searched Halloween costumes in the U.S. in 2021.
From spooky to sweet, these are the costumes everyone wants to dress up as this Halloween.
A Brief History of Halloween
Halloween is celebrated each year on October 31, with this year’s Halloween occurring on a Sunday. The tradition originated with the ancient Celtic festival of Samhain, where people would light bonfires and wear costumes to ward off ghosts.
The concept of Halloween didn’t gain popularity until it reached the United States. Borrowing from European traditions, Americans began to dress up in costumes and go house to house asking for food or money, a practice that eventually became today’s “trick-or-treat” tradition.
Other superstitions also started to form around the holiday. Young women believed they could divine the appearance of their future husbands by doing tricks with apple parings or mirrors.
Over time, Halloween moved away from focusing on witchcraft and ghosts to the festival we know and love today—a day focused on games, foods of the season, and festive costumes.
What Are the Most Popular Halloween Costumes?
With COVID-19 cases down compared to last year and Americans expected to spend over $10 billion on Halloween this year, much of the United States will be partaking in celebrating the spooky holiday.
From classy costumes and last-minute DIYs to pop-culture outfits and even era-inspired costumes, here are the top 25 most popular Halloween costumes in the U.S. in 2021.
| Rank | Costume Name | Category |
|---|---|---|
| 1 | Witch | Horror Films |
| 2 | Rabbit | Animals |
| 3 | Dinosaur | Animals |
| 4 | Spider-Man | Comic Book Characters |
| 5 | Cruella de Vil | Film Characters |
| 6 | Fairy | Fantasy Characters |
| 7 | Harley Quinn | Comic Book Characters |
| 8 | Cowboy | Professions |
| 9 | Clown | Professions |
| 10 | Chucky | Horror Films |
| 11 | Cheerleader | Professions |
| 12 | Pirate | Professions |
| 13 | Pumpkin | Foods |
| 14 | Angel | Characters |
| 15 | Vampire | Fantasy Characters |
| 16 | Among Us | TV Charaters |
| 17 | Zombie | Horror Films |
| 18 | 1980's | Era |
| 19 | Superhero | Comic Book Characters |
| 20 | Devil | Characters |
| 21 | Joker | Film Characters |
| 22 | Ninja | Professions |
| 23 | Squid Game | TV Charaters |
| 24 | Beetejuice | Horror Films |
| 25 | Doll | Toys |
Notable Trending Costumes
The Netflix show Squid Game has had a meteoric rise in popularity in recent weeks, becoming one of the most-watched shows on the streaming platform—just in time for Halloween.
Squid Game costumes are the 23rd most popular in Google’s search, and they continue to trend high, being the most searched costume idea in Detroit.
In 2020, the mobile game Among Us was the talk of the gaming world, and this year it is the 16th most popular costume, with its popularity spiking in Jacksonville, Florida.
Other notable costumes in the top 50 include Pokémon at #50, Fortnite at #44, Velma Dinkley (of Scooby-Doo fame) at #42, Poison Ivy (the comic book villain) at #33, Beetlejuice at #24 and the entire 1980s decade at #18.
Most Popular Halloween Costumes by State
When it comes to festivals, every state has its unique perspective and traditions on celebrating them. This extends to popular Halloween costumes too.
Though there might be some overlap, digging deeper into the most popular costumes in every state allows us a unique look into how diverse people’s tastes are across the country.
Here is a breakdown of the most popular costumes in the U.S. in 2020 by state:
| State | Most Popular Costume | National Rank in 2020 |
|---|---|---|
| Alabama | Harley Quinn | 03 |
| Alaska | Beetlejuice | 36 |
| Arizona | Rabbit | 04 |
| Arkansas | Doll | 12 |
| California | Witch | 01 |
| Colorado | Dinosaur | 02 |
| Connecticut | Powerpuff Girls | 32 |
| Delaware | Doll | 12 |
| District of Columbia | Beyonce | 333 |
| Florida | Rabbit | 04 |
| Georgia | Witch | 01 |
| Hawaii | Monsters Inc | 43 |
| Idaho | Witch | 01 |
| Illinois | Dinosaur | 02 |
| Indiana | Witch | 01 |
| Iowa | Chucky | 20 |
| Kansas | Mickey Mouse | 57 |
| Kentucky | Zombie | 13 |
| Louisiana | Witch | 01 |
| Maine | Dinosaur | 02 |
| Maryland | Ninja | 09 |
| Massachusetts | Dinosaur | 02 |
| Michigan | Rabbit | 04 |
| Minnesota | Witch | 01 |
| Mississippi | Angel | 06 |
| Missouri | Dinosaur | 02 |
| Montana | Purge | 15 |
| Nebraska | Joker | 30 |
| Nevada | Witch | 01 |
| New Hampshire | Ninja | 09 |
| New Jersey | Witch | 01 |
| New Mexico | Clueless | 74 |
| New York | Dinosaur | 02 |
| North Carolina | Dinosaur | 02 |
| North Dakota | Star Wars | 28 |
| Ohio | Witch | 01 |
| Oklahoma | Dragon | 35 |
| Oregon | Fortnite | 07 |
| Pennsylvania | Witch | 01 |
| Rhode Island | Hermione Granger | 146 |
| South Carolina | Wonder Woman | 31 |
| South Dakota | Spider | 38 |
| Tennessee | Harley Quinn | 03 |
| Texas | Harley Quinn | 03 |
| Utah | Witch | 01 |
| Vermont | Deer | 125 |
| Virginia | Rabbit | 04 |
| Washington | Angel | 06 |
| West Virginia | Zombie | 13 |
| Wisconsin | Witch | 01 |
| Wyoming | Physician | 67 |
A look at popular costumes at the state level reveals some interesting quirks. Montana, for example, is uniquely interested in The Purge, and Rhode Island trick-or-treaters are big fans of Hermione Granger of Harry Potter fame.
Traditions are Here To Stay
At its core, Halloween still remains that same old fright-inducing festival it has always been.
Even though pop culture might influence your Halloween choices, traditional costumes will always have a unique place in everyone’s heart.


VC+
VC+: Get Our Key Takeaways From the IMF’s World Economic Outlook
A sneak preview of the exclusive VC+ Special Dispatch—your shortcut to understanding IMF’s World Economic Outlook report.

Have you read IMF’s latest World Economic Outlook yet? At a daunting 202 pages, we don’t blame you if it’s still on your to-do list.
But don’t worry, you don’t need to read the whole April release, because we’ve already done the hard work for you.
To save you time and effort, the Visual Capitalist team has compiled a visual analysis of everything you need to know from the report—and our VC+ Special Dispatch is available exclusively to VC+ members. All you need to do is log into the VC+ Archive.
If you’re not already subscribed to VC+, make sure you sign up now to access the full analysis of the IMF report, and more (we release similar deep dives every week).
For now, here’s what VC+ members get to see.
Your Shortcut to Understanding IMF’s World Economic Outlook
With long and short-term growth prospects declining for many countries around the world, this Special Dispatch offers a visual analysis of the key figures and takeaways from the IMF’s report including:
- The global decline in economic growth forecasts
- Real GDP growth and inflation forecasts for major nations in 2024
- When interest rate cuts will happen and interest rate forecasts
- How debt-to-GDP ratios have changed since 2000
- And much more!

Get the Full Breakdown in the Next VC+ Special Dispatch
VC+ members can access the full Special Dispatch by logging into the VC+ Archive, where you can also check out previous releases.
Make sure you join VC+ now to see exclusive charts and the full analysis of key takeaways from IMF’s World Economic Outlook.
Don’t miss out. Become a VC+ member today.
What You Get When You Become a VC+ Member
VC+ is Visual Capitalist’s premium subscription. As a member, you’ll get the following:
- Special Dispatches: Deep dive visual briefings on crucial reports and global trends
- Markets This Month: A snappy summary of the state of the markets and what to look out for
- The Trendline: Weekly curation of the best visualizations from across the globe
- Global Forecast Series: Our flagship annual report that covers everything you need to know related to the economy, markets, geopolitics, and the latest tech trends
- VC+ Archive: Hundreds of previously released VC+ briefings and reports that you’ve been missing out on, all in one dedicated hub
You can get all of the above, and more, by joining VC+ today.

-

 Mining1 week ago
Gold vs. S&P 500: Which Has Grown More Over Five Years?
-

 Markets2 weeks ago
Ranked: The Most Valuable Housing Markets in America
-

 Money2 weeks ago
Which States Have the Highest Minimum Wage in America?
-

 AI2 weeks ago
Ranked: Semiconductor Companies by Industry Revenue Share
-

 Markets2 weeks ago
Ranked: The World’s Top Flight Routes, by Revenue
-

 Countries2 weeks ago
Population Projections: The World’s 6 Largest Countries in 2075
-

 Markets2 weeks ago
The Top 10 States by Real GDP Growth in 2023
-

 Demographics2 weeks ago
The Smallest Gender Wage Gaps in OECD Countries