Datastream
DoorDash is Dominating the U.S. Food Delivery Market


The Briefing
- DoorDash’s market share of food delivery services in the U.S. has crossed the 50% threshold.
- This market dominance accelerated at the start of the COVID-19 pandemic.
- Uber Eats is the next biggest delivery app while Postmates, Grubhub, and other platforms have lost ground.
DoorDash is Dominating the U.S. Food Delivery Market
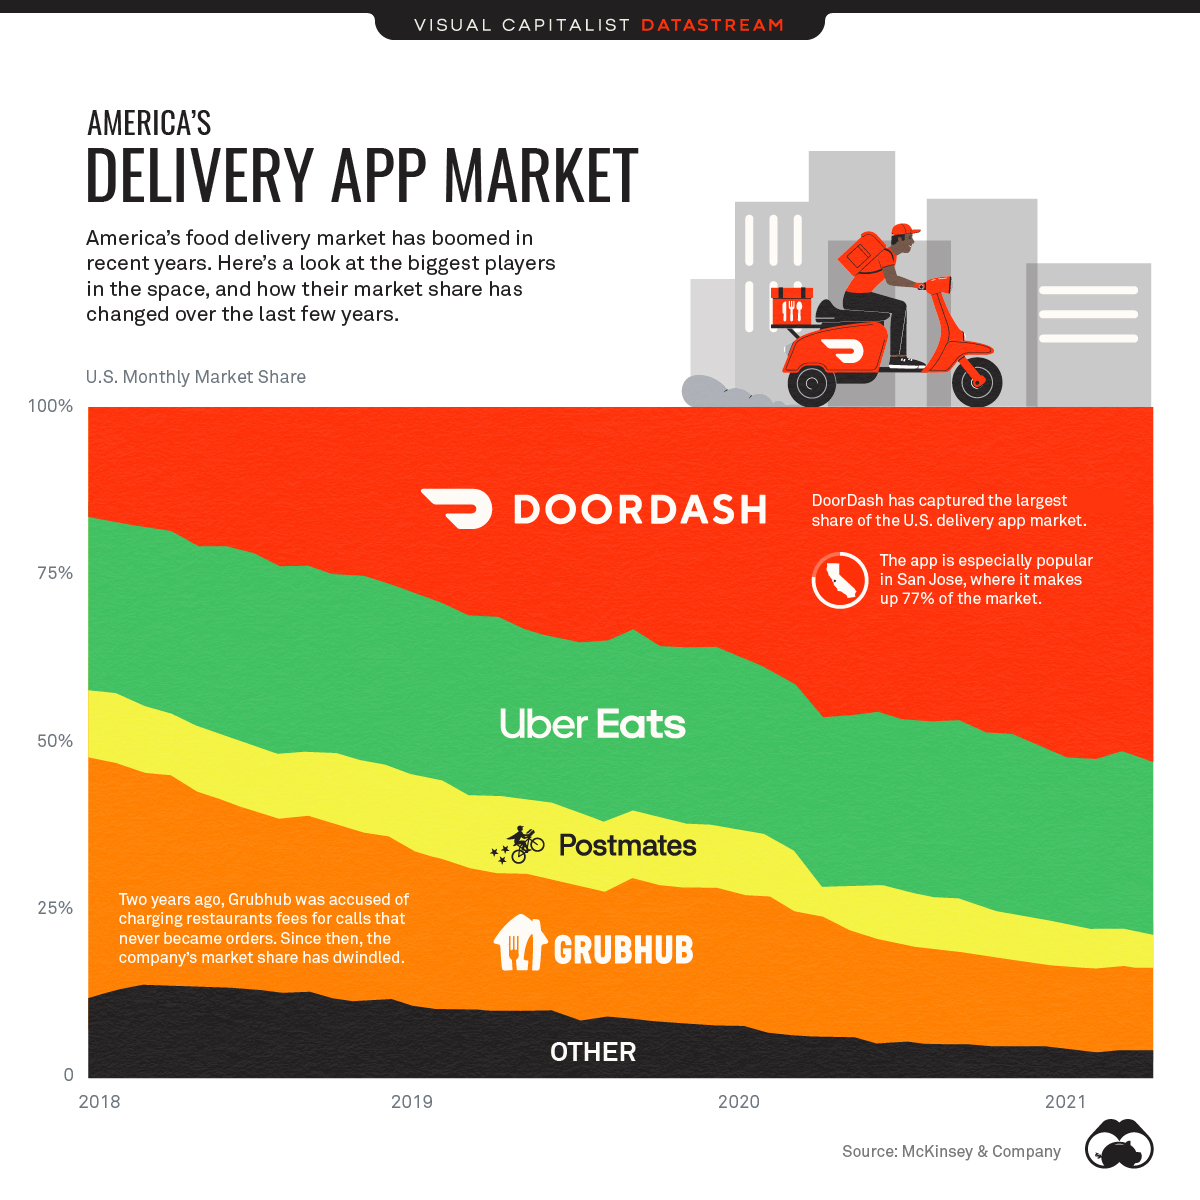
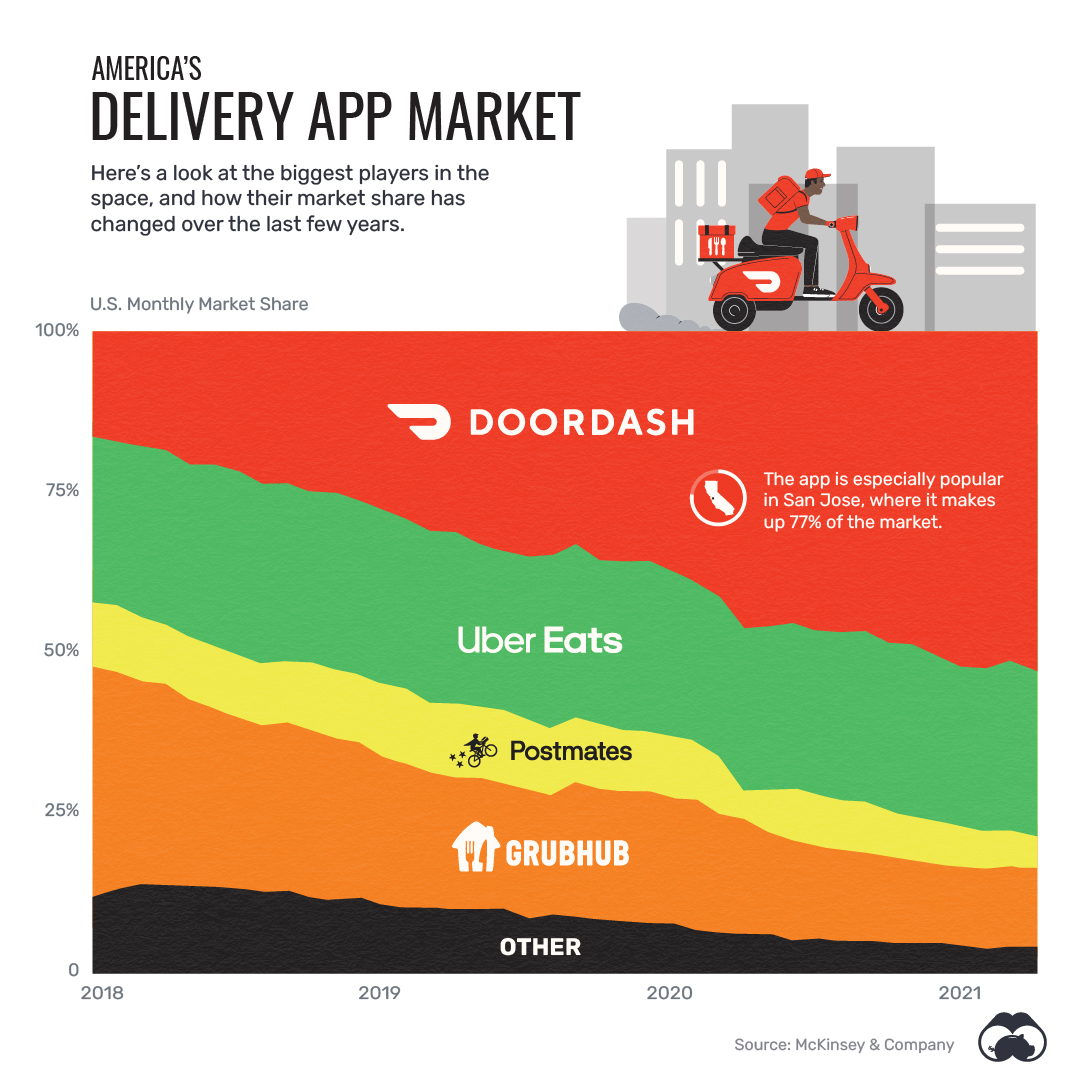
The food delivery app market in the U.S. is shifting from an oligopoly, where market control was shared amongst four companies, to more of a duopoly setting.
According to McKinsey & Company, two major players—DoorDash and Uber Eats—control close to 80% of the food delivery market as of 2021.
Here’s how the overall food delivery app market has shifted since 2018:
| Brand | U.S. Market Share (2018) | U.S. Market Share (2021) | Trend |
|---|---|---|---|
| DoorDash | 16% | 53% | ⤴︎ |
| Uber Eats | 26% | 26% | — |
| Postmates | 10% | 5% | ⤵︎ |
| Grubhub | 36% | 12% | ⤵︎ |
| Others | 12% | 4% | ⤵︎ |
The Most Popular Food Delivery App in the U.S.
The COVID-19 pandemic has helped accelerate DoorDash’s rapid growth and market dominance. The food delivery company increased its market share from under 20% in 2018 to 53% in 2021.
As the world stayed indoors to weather the pandemic, the entire U.S. delivery app market grew 48.3% within the first couple months of 2020. And over the course of the year, DoorDash’s individual share of the market grew by about 12.5 percentage points, helping the company’s annual revenue to balloon from $0.85 billion in 2019 to $2.88 billion in 2020.
While an easy-to-use interface was a critical component of this success, many market analysts attribute DoorDash’s pandemic boom to a combination of superior customer data and brand positioning as an ally to struggling restaurants during the pandemic.
This success culminated in a widely-discussed IPO in December 2020, where in its first day of trading, DoorDash stock prices soared 86% to $190 per share.
DoorDash and Uber Eats Crowd Out the Competition
Throughout DoorDash’s growth, Uber Eats has remained their biggest competitor and maintained roughly 25% of the U.S. delivery app market since 2018.
These achievements have come at the expense of Postmates, Grubhub, and other smaller players, which have seen their market shares decrease substantially. It is worth noting that both Postmates and Grubhub have still seen increases in their annual revenue, in part due to the increasing size of the overall market.
That said, lesser-known platforms such as Delivery.com and ChowNow are decreasing in significance to the industry. As the delivery app market matures, control is increasingly consolidating in the hands of a smaller number of companies.
Where does this data come from?
Source: McKinsey & Company


Datastream
Can You Calculate Your Daily Carbon Footprint?
Discover how the average person’s carbon footprint impacts the environment and learn how carbon credits can offset your carbon footprint.


The Briefing
- A person’s carbon footprint is substantial, with activities such as food consumption creating as much as 4,500 g of CO₂ emissions daily.
- By purchasing carbon credits from Carbon Streaming Corporation, you can offset your own emissions and fund positive climate action.
Your Everyday Carbon Footprint
While many large businesses and countries have committed to net-zero goals, it is essential to acknowledge that your everyday activities also contribute to global emissions.
In this graphic, sponsored by Carbon Streaming Corporation, we will explore how the choices we make and the products we use have a profound impact on our carbon footprint.
Carbon Emissions by Activity
Here are some of the daily activities and products of the average person and their carbon footprint, according to Clever Carbon.
| Household Activities & Products | CO2 Emissions (g) |
|---|---|
| 💡 Standard Light Bulb (100 watts, four hours) | 172 g |
| 📱 Mobile Phone Use (195 minutes per day)* | 189 g |
| 👕 Washing Machine (0.63 kWh) | 275 g |
| 🔥 Electric Oven (1.56 kWh) | 675 g |
| ♨️ Tumble Dryer (2.5 kWh) | 1,000 g |
| 🧻 Toilet Roll (2 ply) | 1,300 g |
| 🚿 Hot Shower (10 mins) | 2,000 g |
| 🚙 Daily Commute (one hour, by car) | 3,360 g |
| 🍽️ Average Daily Food Consumption (three meals of 600 calories) | 4,500 g |
| *Phone use based on yearly use of 69kg per the source, Reboxed | |
Your choice of transportation plays a crucial role in determining your carbon footprint. For instance, a 15 km daily commute to work on public transport generates an average of 1,464 g of CO₂ emissions. Compared to 3,360 g—twice the volume for a journey the same length by car.
By opting for more sustainable modes of transport, such as cycling, walking, or public transportation, you can significantly reduce your carbon footprint.
Addressing Your Carbon Footprint
One way to compensate for your emissions is by purchasing high-quality carbon credits.
Carbon credits are used to help fund projects that avoid, reduce or remove CO₂ emissions. This includes nature-based solutions such as reforestation and improved forest management, or technology-based solutions such as the production of biochar and carbon capture and storage (CCS).
While carbon credits offer a potential solution for individuals to help reduce global emissions, public awareness remains a significant challenge. A BCG-Patch survey revealed that only 34% of U.S. consumers are familiar with carbon credits, and only 3% have purchased them in the past.
About Carbon Streaming
By financing the creation or expansion of carbon projects, Carbon Streaming Corporation secures the rights to future carbon credits generated by these sustainable projects. You can then purchase these carbon credits to help fund climate solutions around the world and compensate for your own emissions.
Ready to get involved?
>> Learn more about purchasing carbon credits at Carbon Streaming

-

 Technology2 weeks ago
Ranked: The Most Popular Smartphone Brands in the U.S.
-

 Automotive1 week ago
Almost Every EV Stock is Down After Q1 2024
-

 Money1 week ago
Where Does One U.S. Tax Dollar Go?
-

 Green2 weeks ago
Ranked: Top Countries by Total Forest Loss Since 2001
-

 Real Estate2 weeks ago
Visualizing America’s Shortage of Affordable Homes
-

 Maps2 weeks ago
Mapped: Average Wages Across Europe
-

 Mining2 weeks ago
Charted: The Value Gap Between the Gold Price and Gold Miners
-

 Demographics2 weeks ago
Visualizing the Size of the Global Senior Population