Money
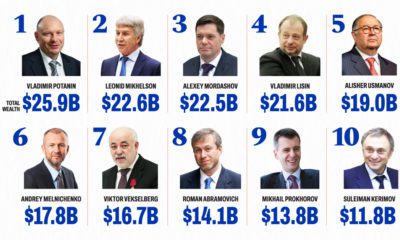
Ranked: The Most Expensive Sports Team Sales in History
Article/Editing:
Ranking the Biggest Sports Team Sales in History
After a record-setting year in 2022, professional sports team sales are on an uptick yet again.
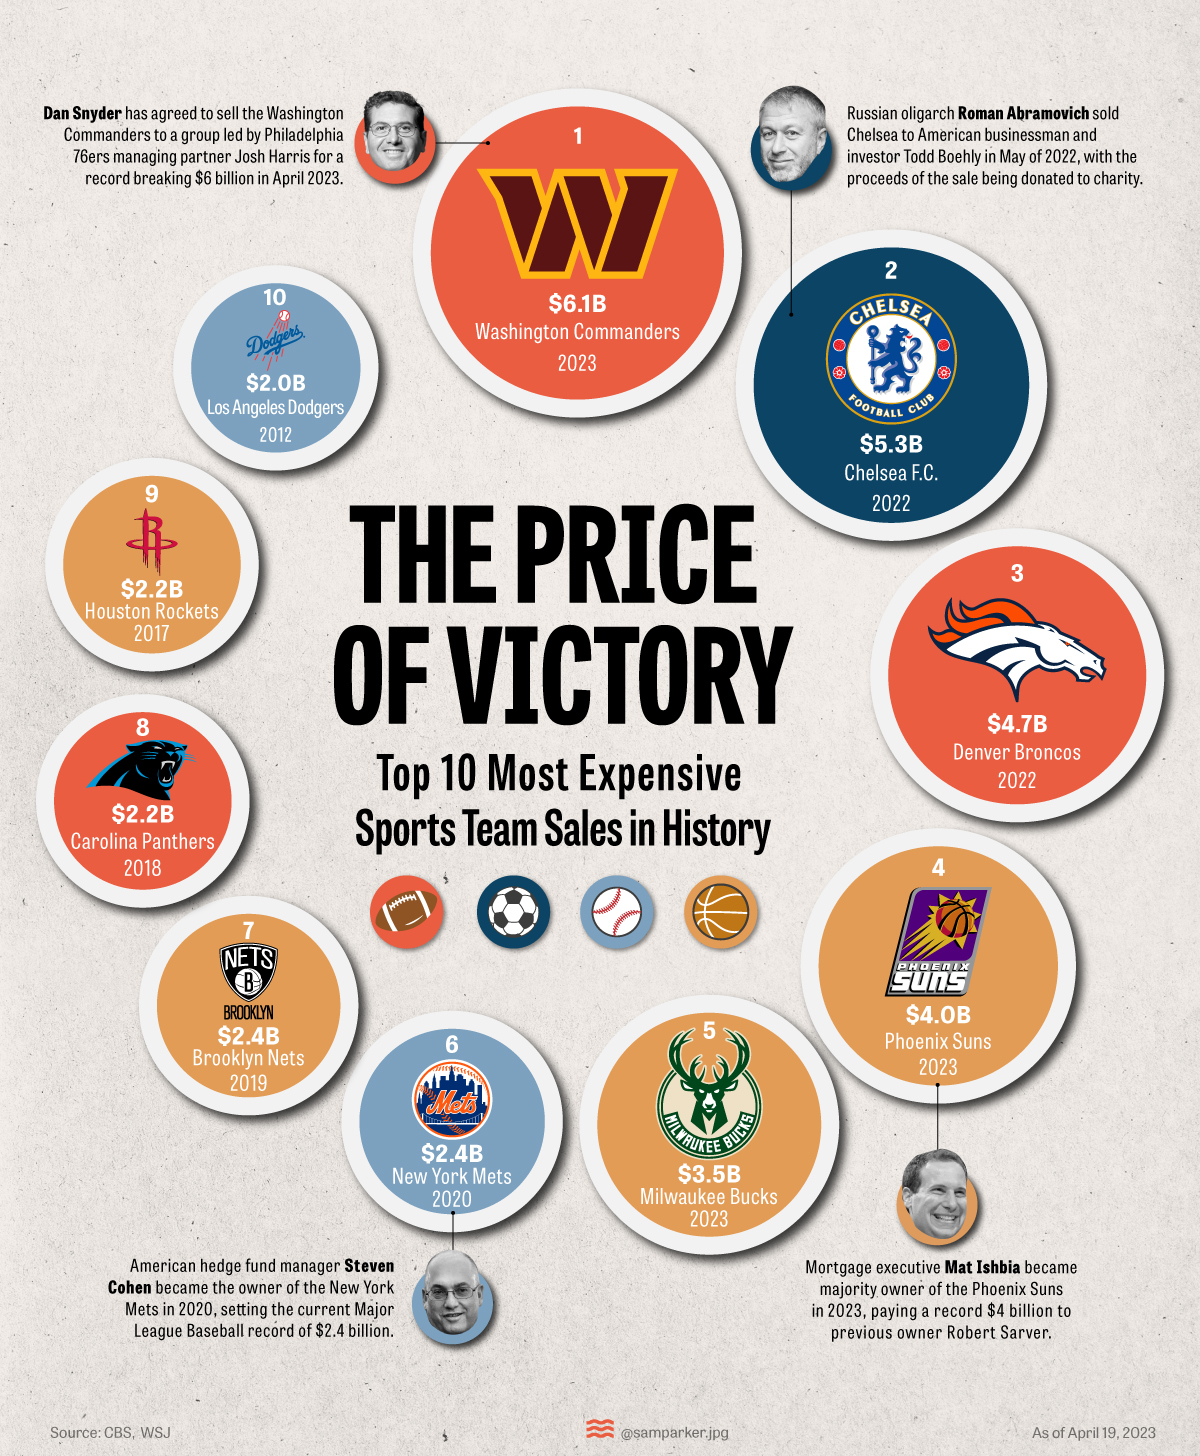
The tentative $6.05 billion Washington Commanders sale, already approved by other NFL owners, will be the highest amount paid for a sports team once completed.
This graphic from Sam Parker shows how the Commanders’ April 2023 deal measures up against the biggest sports team sales in history, using data from the Wall Street Journal and CBS Sports.
Washington Commanders Sale vs. Other Franchise Fortunes
Valuations have become significantly larger in the last couple of years, with the largest sales all occurring after 2010. Here are the 10 most highly-priced sales for a professional sports team franchise globally.
| Rank | Team | Price | Year of Sale |
|---|---|---|---|
| 1 | 🏈 Washington Commanders | $6.1B | 2023 |
| 2 | ⚽ Chelsea Football Club | $5.3B | 2022 |
| 3 | 🏈 Denver Broncos | $4.7B | 2022 |
| 4 | 🏀 Phoenix Suns | $4.0B | 2023 |
| 5 | 🏀 Milwaukee Bucks | $3.5B | 2023 |
| 6 | ⚾ New York Mets | $2.4B | 2020 |
| 7 | 🏀 Brooklyn Nets | $2.4B | 2019 |
| 8 | 🏈 Carolina Panthers | $2.2B | 2018 |
| 9 | 🏀 Houston Rockets | $2.2B | 2017 |
| 10 | ⚾ Los Angeles Dodgers | $2.0B | 2012 |
The Washington Commanders sale takes the top spot at $6.1 billion, even though it could still be de-throned. It’s been reported that a $7 billion dollar bid for the team is still in play as well.
Dan Snyder, the current owner of the team, is one of the world’s richest people in sports. He purchased the team for $800 million in 1999 and, if the $6.1 billion sale completes, will have made a cumulative return of over 650%.
Chelsea Football Club is the only non-U.S. sale on the list. The sports team was previously owned by Roman Abramovich, a Russian oligarch who was subject to sanctions after Russia’s invasion of Ukraine and was forced to sell the team.
Hedge fund billionaire Todd Boehly, who was part of the consortium that purchased Chelsea, is also part owner of number 10 on the list: the LA Dodgers. Boehly is said to have helped with one of the “most dramatic turnarounds in North American sports” through his purchase of the Dodgers in 2012 for $2.0 billion, with the team wining the MLB World Series in 2020.
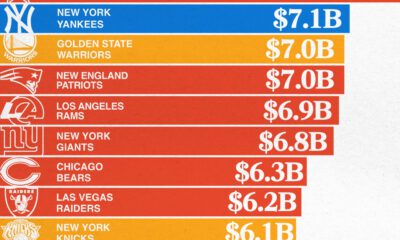
Will any sale top the Washington Commanders number? NFL teams specifically are some of the world’s most valuable teams, so the sale of a team such as the Dallas Cowboys or Los Angeles Rams could be worth more.
Other competition could come from soccer teams, including Chelsea rivals Manchester United or Liverpool. Manchester United’s owners put the club up for sale in 2022, hoping for a valuation of £5 billion to £6 billion ($6.2 billion to $7.5 billion).
Why Are Sports Team Sale Prices So High?
Sports teams haven’t always collected such sky-high prices like the Washington Commanders sale. In fact, sports teams used to be the investment of choice for eccentric entrepreneurs and were considered money-losing propositions.
So what’s changed? There are a number of factors driving high valuations and passionate interest from billionaires:
- Media deals: Digitization means sports now have a global audience, and broadcast rights have become a major driver of leagues’ revenue growth. For example, the NFL has $115 billion in long-term media rights deals with major TV networks, Amazon, and Google’s YouTube TV.
- Industry monopoly: There were once a handful of professional baseball leagues, but Major League Baseball earned an exemption from antitrust (pro-competition) laws in 1922. Other sports leagues have conglomerated to become the biggest and best representatives of their sport, making it nearly impossible for new entrants to compete.
- League benefits: Contracts negotiated at a league level are equally split between every league’s sports team. The Packers, the only NFL team with public financial statements, earned 60% of their income from national sources in 2022. Most leagues also have salary caps which limit player costs.
- Favorable Taxes: In 2004, the U.S. federal government introduced a rule allowing sports team owners to write off most of their purchase price against team profits over 15 years.
Beyond these factors, perhaps the biggest driver of sports team value is the prestige associated with owning one.
“Sports teams are a bit of a vanity asset, like owning a Picasso, and the highest bidder is going to be a very rich person who wants to own the team so they (can) call themselves an owner of a sports team.” — Stephen Dodson, Portfolio Manager of Bretton Fund

This article was published as a part of Visual Capitalist's Creator Program, which features data-driven visuals from some of our favorite Creators around the world.


Money
Charted: Which City Has the Most Billionaires in 2024?
Just two countries account for half of the top 20 cities with the most billionaires. And the majority of the other half are found in Asia.


Charted: Which Country Has the Most Billionaires in 2024?
This was originally posted on our Voronoi app. Download the app for free on iOS or Android and discover incredible data-driven charts from a variety of trusted sources.
Some cities seem to attract the rich. Take New York City for example, which has 340,000 high-net-worth residents with investable assets of more than $1 million.
But there’s a vast difference between being a millionaire and a billionaire. So where do the richest of them all live?
Using data from the Hurun Global Rich List 2024, we rank the top 20 cities with the highest number of billionaires in 2024.
A caveat to these rich lists: sources often vary on figures and exact rankings. For example, in last year’s reports, Forbes had New York as the city with the most billionaires, while the Hurun Global Rich List placed Beijing at the top spot.
Ranked: Top 20 Cities with the Most Billionaires in 2024
The Chinese economy’s doldrums over the course of the past year have affected its ultra-wealthy residents in key cities.
Beijing, the city with the most billionaires in 2023, has not only ceded its spot to New York, but has dropped to #4, overtaken by London and Mumbai.
| Rank | City | Billionaires | Rank Change YoY |
|---|---|---|---|
| 1 | 🇺🇸 New York | 119 | +1 |
| 2 | 🇬🇧 London | 97 | +3 |
| 3 | 🇮🇳 Mumbai | 92 | +4 |
| 4 | 🇨🇳 Beijing | 91 | -3 |
| 5 | 🇨🇳 Shanghai | 87 | -2 |
| 6 | 🇨🇳 Shenzhen | 84 | -2 |
| 7 | 🇭🇰 Hong Kong | 65 | -1 |
| 8 | 🇷🇺 Moscow | 59 | No Change |
| 9 | 🇮🇳 New Delhi | 57 | +6 |
| 10 | 🇺🇸 San Francisco | 52 | No Change |
| 11 | 🇹🇭 Bangkok | 49 | +2 |
| 12 | 🇹🇼 Taipei | 45 | +2 |
| 13 | 🇫🇷 Paris | 44 | -2 |
| 14 | 🇨🇳 Hangzhou | 43 | -5 |
| 15 | 🇸🇬 Singapore | 42 | New to Top 20 |
| 16 | 🇨🇳 Guangzhou | 39 | -4 |
| 17T | 🇮🇩 Jakarta | 37 | +1 |
| 17T | 🇧🇷 Sao Paulo | 37 | No Change |
| 19T | 🇺🇸 Los Angeles | 31 | No Change |
| 19T | 🇰🇷 Seoul | 31 | -3 |
In fact all Chinese cities on the top 20 list have lost billionaires between 2023–24. Consequently, they’ve all lost ranking spots as well, with Hangzhou seeing the biggest slide (-5) in the top 20.
Where China lost, all other Asian cities—except Seoul—in the top 20 have gained ranks. Indian cities lead the way, with New Delhi (+6) and Mumbai (+3) having climbed the most.
At a country level, China and the U.S combine to make up half of the cities in the top 20. They are also home to about half of the world’s 3,200 billionaire population.
In other news of note: Hurun officially counts Taylor Swift as a billionaire, estimating her net worth at $1.2 billion.

-

 Education1 week ago
How Hard Is It to Get Into an Ivy League School?
-

 Technology2 weeks ago
Ranked: Semiconductor Companies by Industry Revenue Share
-

 Markets2 weeks ago
Ranked: The World’s Top Flight Routes, by Revenue
-

 Demographics2 weeks ago
Population Projections: The World’s 6 Largest Countries in 2075
-

 Markets2 weeks ago
The Top 10 States by Real GDP Growth in 2023
-

 Demographics2 weeks ago
The Smallest Gender Wage Gaps in OECD Countries
-

 Economy2 weeks ago
Where U.S. Inflation Hit the Hardest in March 2024
-

 Green2 weeks ago
Top Countries By Forest Growth Since 2001