Misc
Ranked: The Most Valuable NFL Teams in 2022
Article/Editing:
Ranked: The Most Valuable NFL Teams in 2022
The world’s most valuable sports teams include internationally beloved soccer clubs, massive NBA franchises, and renowned MLB teams. But, it’s the National Football League (NFL) that has arguably the most valuable teams in the world.
In June 2022, the Denver Broncos sold for $4.65 billion, a record for the most expensive team purchase. But if other teams were to sell, they’d potentially command an even greater price tag.
Which teams, and conferences, reign supreme in value? This graphic by Truman Du uses data from Forbes last calculated in August 2022 to show the most valuable NFL teams.
NFL Teams by Value
To calculate team values, Forbes used enterprise values (total team equity plus net debt) and factored in each team’s stadium-related revenue. This includes non-NFL revenue that accrues to each team’s owner, but doesn’t account for the stadium’s real estate value.
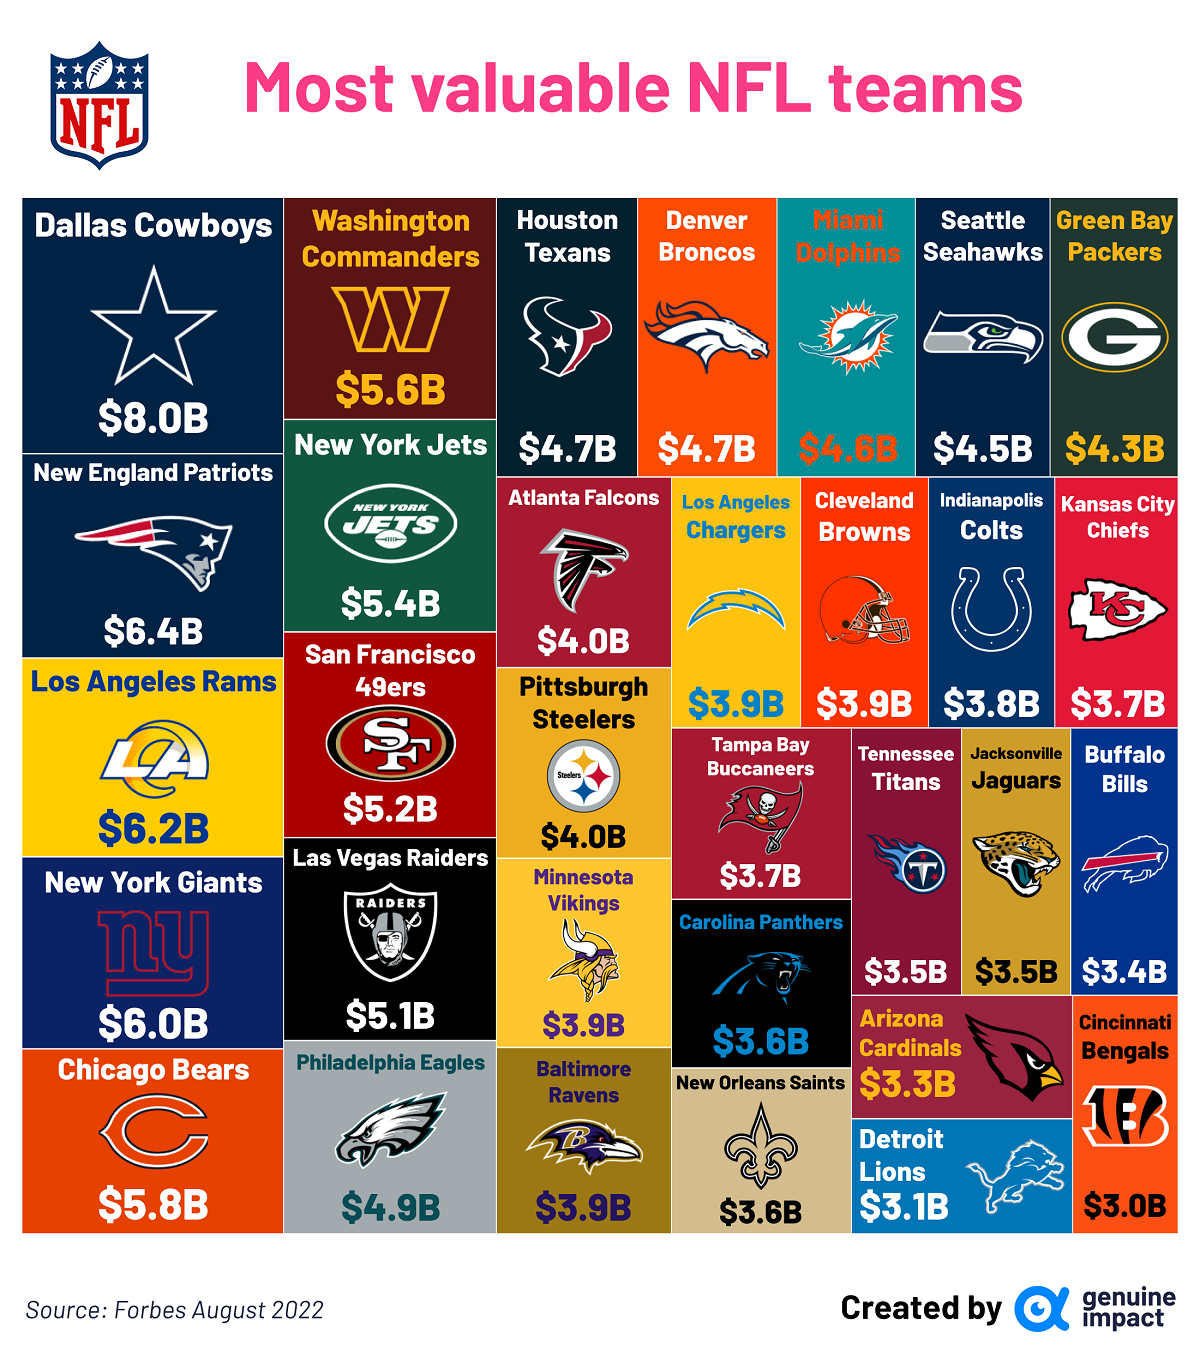
The findings? NFL teams continue to become more valuable, rising in 2022 to an average of $4.47 billion, an increase of 28% year-over-year.
| Rank | NFL Team | Value (Aug 2022) |
|---|---|---|
| 1 | Dallas Cowboys | $8.00B |
| 2 | New England Patriots | $6.40B |
| 3 | Los Angeles Rams | $6.20B |
| 4 | New York Giants | $6.00B |
| 5 | Chicago Bears | $5.80B |
| 6 | Washington Commanders | $5.60B |
| 7 | New York Jets | $5.40B |
| 8 | San Francisco 49ers | $5.20B |
| 9 | Las Vegas Raiders | $5.10B |
| 10 | Philadelphia Eagles | $4.90B |
| 11 | Houston Texans | $4.70B |
| 12 | Denver Broncos | $4.65B |
| 13 | Miami Dolphins | $4.60B |
| 14 | Seattle Seahawks | $4.50B |
| 15 | Green Bay Packers | $4.25B |
| 16 | Atlanta Falcons | $4.00B |
| 17 | Pittsburgh Steelers | $3.98B |
| 18 | Minnesota Vikings | $3.93B |
| 19 | Baltimore Ravens | $3.90B |
| 20 | Los Angeles Chargers | $3.88B |
| 21 | Cleveland Browns | $3.85B |
| 22 | Indianapolis Colts | $3.80B |
| 23 | Kansas City Chiefs | $3.70B |
| 24 | Tampa Bay Buccaneers | $3.68B |
| 25 | Carolina Panthers | $3.60B |
| 26 | New Orleans Saints | $3.58B |
| 27 | Tennessee Titans | $3.50B |
| 28 | Jacksonville Jaguars | $3.48B |
| 29 | Buffalo Bills | $3.40B |
| 30 | Arizona Cardinals | $3.27B |
| 31 | Detroit Lions | $3.05B |
| 32 | Cincinnati Bengals | $3.00B |
At the top of the rankings, the Dallas Cowboys sit at an estimated valuation of $8 billion, making them the most valuable sports team in the world.
They were the first team to generate over $1 billion in annual revenue thanks to massive sponsorship deals, including an estimated $220 million in stadium advertising and sponsorship revenue.
This is especially impressive, since NFL teams actually share just over 70% of football-related revenue. As Forbes points out, the Cowboys have been the most successful at capitalizing on stadium and branding in order to boost external revenues.
Most Valuable NFL Teams by Conference
Truman also broke down NFL team valuations by conference, highlighting the extra monetary weight one has over the other.
The National Football Conference (NFC) and the American Football Conference (AFC) were formed in 1970 after the NFL merged with the rival American Football League. Over time and as the league has expanded, the conferences have shifted and realigned to end up at 4 divisions of 4 teams for 16 teams each as of 2022.
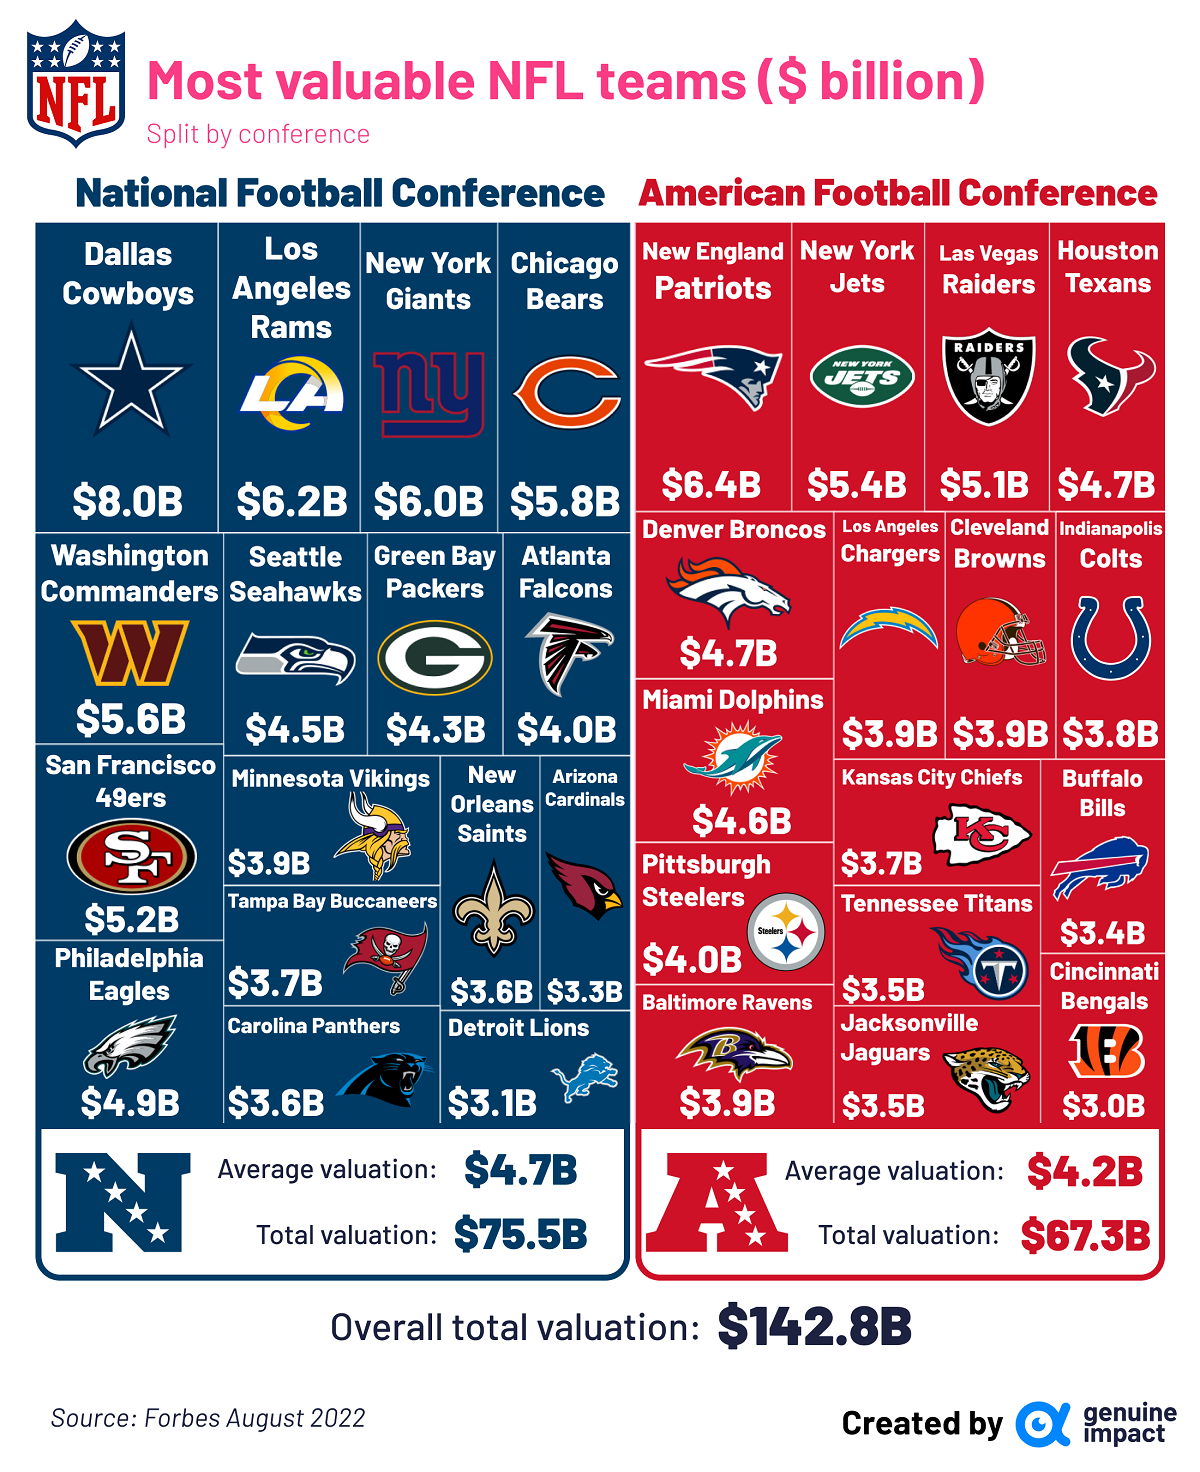
Impressively, NFC teams had an average valuation about $500 million higher than the AFC. It also had five of the six most valuable teams, with just the #2 New England Patriots representing the AFC at the top.
But with the most recent record sale taking place in the AFC (Denver Broncos), and more potential high-profile relocations and sales in the wings, the landscape of NFL team values might shift yet again in the near future.

This article was published as a part of Visual Capitalist's Creator Program, which features data-driven visuals from some of our favorite Creators around the world.


VC+
VC+: Get Our Key Takeaways From the IMF’s World Economic Outlook
A sneak preview of the exclusive VC+ Special Dispatch—your shortcut to understanding IMF’s World Economic Outlook report.

Have you read IMF’s latest World Economic Outlook yet? At a daunting 202 pages, we don’t blame you if it’s still on your to-do list.
But don’t worry, you don’t need to read the whole April release, because we’ve already done the hard work for you.
To save you time and effort, the Visual Capitalist team has compiled a visual analysis of everything you need to know from the report—and our VC+ Special Dispatch is available exclusively to VC+ members. All you need to do is log into the VC+ Archive.
If you’re not already subscribed to VC+, make sure you sign up now to access the full analysis of the IMF report, and more (we release similar deep dives every week).
For now, here’s what VC+ members get to see.
Your Shortcut to Understanding IMF’s World Economic Outlook
With long and short-term growth prospects declining for many countries around the world, this Special Dispatch offers a visual analysis of the key figures and takeaways from the IMF’s report including:
- The global decline in economic growth forecasts
- Real GDP growth and inflation forecasts for major nations in 2024
- When interest rate cuts will happen and interest rate forecasts
- How debt-to-GDP ratios have changed since 2000
- And much more!

Get the Full Breakdown in the Next VC+ Special Dispatch
VC+ members can access the full Special Dispatch by logging into the VC+ Archive, where you can also check out previous releases.
Make sure you join VC+ now to see exclusive charts and the full analysis of key takeaways from IMF’s World Economic Outlook.
Don’t miss out. Become a VC+ member today.
What You Get When You Become a VC+ Member
VC+ is Visual Capitalist’s premium subscription. As a member, you’ll get the following:
- Special Dispatches: Deep dive visual briefings on crucial reports and global trends
- Markets This Month: A snappy summary of the state of the markets and what to look out for
- The Trendline: Weekly curation of the best visualizations from across the globe
- Global Forecast Series: Our flagship annual report that covers everything you need to know related to the economy, markets, geopolitics, and the latest tech trends
- VC+ Archive: Hundreds of previously released VC+ briefings and reports that you’ve been missing out on, all in one dedicated hub
You can get all of the above, and more, by joining VC+ today.

-

 Energy1 week ago
The World’s Biggest Nuclear Energy Producers
-

 Money2 weeks ago
Which States Have the Highest Minimum Wage in America?
-

 Technology2 weeks ago
Ranked: Semiconductor Companies by Industry Revenue Share
-

 Markets2 weeks ago
Ranked: The World’s Top Flight Routes, by Revenue
-

 Countries2 weeks ago
Population Projections: The World’s 6 Largest Countries in 2075
-

 Markets2 weeks ago
The Top 10 States by Real GDP Growth in 2023
-

 Demographics2 weeks ago
The Smallest Gender Wage Gaps in OECD Countries
-

 United States2 weeks ago
Where U.S. Inflation Hit the Hardest in March 2024