Maps
Mapped: Immigration by Country, as a Percentage of the Population
Article/Editing:
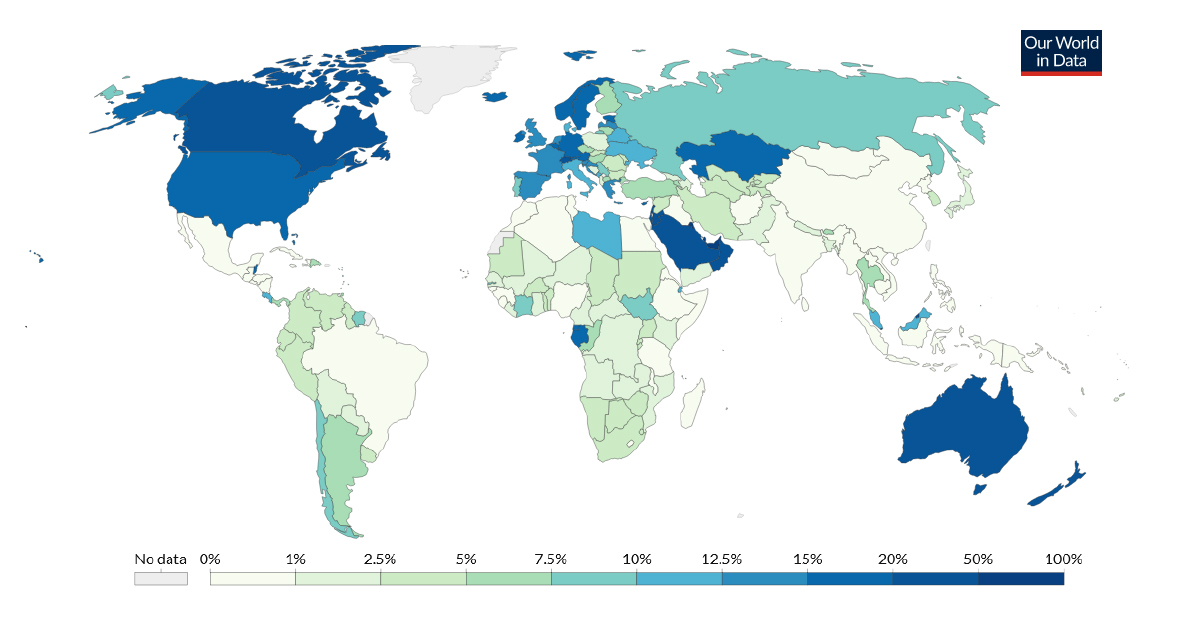
Immigration by Country, as a Percentage of the Population
Many people move countries for work, study, or family. However, they may also be displaced by climate change, conflict, or economic instability.
There were 272 million immigrants in 2020, amounting to 3.5% of the global population. Where do they end up?
This interactive map from Our World in Data highlights immigration by country, as a percentage of the total population, using data from the United Nations (UN) Populations Division.
What Is an Immigrant?
The UN defines an immigrant as someone who has been living in a country other than their country of birth for one year or longer. In addition to new citizens or residents, a variety of people fit under this definition:
- Foreign workers
- International students
- Refugees
The UN also includes estimates of unauthorized immigrants living in various countries. On the flip side, tourists, temporary workers, and overseas military personnel are typically not included.
Immigration by Country Over Time
With this definition in mind, here’s a breakdown of immigration by country as a percentage of the nation’s population.
| Country | 1990 | 2020 | Absolute Change | Relative Change |
|---|---|---|---|---|
| Afghanistan | 0.47% | 0.37% | -0.10 p.p. | -20% |
| Albania | 2.01% | 1.70% | -0.31 p.p. | -16% |
| Algeria | 1.06% | 0.57% | -0.49 p.p. | -46% |
| American Samoa | 45.18% | 30.35%² | -14.83 p.p. | -33% |
| Andorra | 71.35% | 58.98% | -12.37 p.p. | -17% |
| Angola | 0.28% | 2.00% | 1.71 p.p. | 606% |
| Anguilla | 30.59% | 33.24%² | 2.66 p.p. | 9% |
| Antigua and Barbuda | 19.24% | 30.01% | 10.77 p.p. | 56% |
| Argentina | 5.06% | 5.05% | >-0.01 p.p. | >-1% |
| Armenia | 18.62% | 6.42% | -12.20 p.p. | -65% |
| Aruba | 22.84% | 34.52%² | 11.67 p.p. | 51% |
| Australia | 23.32% | 30.14% | 6.82 p.p. | 29% |
| Austria | 10.27% | 19.30% | 9.03 p.p. | 88% |
| Azerbaijan | 4.98% | 2.49% | -2.49 p.p. | -50% |
| Bahamas | 10.48% | 16.17% | 5.69 p.p. | 54% |
| Bahrain | 34.93% | 55.01% | 20.09 p.p. | 58% |
| Bangladesh | 0.85% | 1.28% | 0.43 p.p. | 50% |
| Barbados | 9.21% | 12.13% | 2.93 p.p. | 32% |
| Belarus | 12.30% | 11.29% | -1.01 p.p. | -8% |
| Belgium | 12.80% | 17.30% | 4.51 p.p. | 35% |
| Belize | 16.21% | 15.60% | -0.61 p.p. | -4% |
| Benin | 1.54% | 3.25% | 1.71 p.p. | 111% |
| Bhutan | 4.49% | 6.95% | 2.46 p.p. | 55% |
| Bolivia | 1.07% | 1.41% | 0.33 p.p. | 31% |
| Bosnia and Herzegovina | 1.25% | 1.10% | -0.16 p.p. | -12% |
| Botswana | 2.14% | 4.69% | 2.55 p.p. | 119% |
| Brazil | 0.54% | 0.51% | -0.03 p.p. | -5% |
| Brunei | 28.29% | 25.59% | -2.70 p.p. | -10% |
| Bulgaria | 0.24% | 2.65% | 2.41 p.p. | 992% |
| Burkina Faso | 3.97% | 3.46% | -0.50 p.p. | -13% |
| Burundi | 6.13% | 2.90% | -3.23 p.p. | -53% |
| Cambodia | 0.43% | 0.47% | 0.05 p.p. | 11% |
| Cameroon | 2.26% | 2.18% | -0.08 p.p. | -3% |
| Canada | 15.73% | 21.33% | 5.59 p.p. | 36% |
| Cape Verde | 2.64% | 2.84% | 0.20 p.p. | 7% |
| Central African Republic | 2.40% | 1.83% | -0.56 p.p. | -23% |
| Chad | 1.25% | 3.33% | 2.09 p.p. | 167% |
| Chile | 0.81% | 8.61% | 7.79 p.p. | 962% |
| China | 0.03% | 0.07% | 0.04 p.p. | 125% |
| Colombia | 0.32% | 3.75% | 3.43 p.p. | 1089% |
| Comoros | 3.42% | 1.44% | -1.98 p.p. | -58% |
| Congo | 5.49% | 7.02% | 1.53 p.p. | 28% |
| Costa Rica | 13.39% | 10.22% | -3.17 p.p. | -24% |
| Cote d'Ivoire | 15.23% | 9.72% | -5.51 p.p. | -36% |
| Croatia | 9.95% | 12.86% | 2.91 p.p. | 29% |
| Cuba | 0.33% | 0.03% | -0.30 p.p. | -92% |
| Cyprus | 5.71% | 15.77% | 10.05 p.p. | 176% |
| Czechia | 1.07% | 5.05% | 3.98 p.p. | 373% |
| Democratic Republic of Congo | 2.18% | 1.06% | -1.11 p.p. | -51% |
| Denmark | 4.58% | 12.39% | 7.81 p.p. | 171% |
| Djibouti | 20.70% | 12.12% | -8.58 p.p. | -41% |
| Dominica | 3.58% | 11.51% | 7.93 p.p. | 222% |
| Dominican Republic | 4.08% | 5.57% | 1.48 p.p. | 36% |
| Ecuador | 0.77% | 4.45% | 3.68 p.p. | 478% |
| Egypt | 0.31% | 0.53% | 0.22 p.p. | 72% |
| El Salvador | 0.90% | 0.66% | -0.24 p.p. | -27% |
| Equatorial Guinea | 0.65% | 16.44% | 15.78 p.p. | 2413% |
| Eritrea | 0.53% | 0.39% | -0.13 p.p. | -25% |
| Estonia | 24.41% | 15.02% | -9.38 p.p. | -38% |
| Eswatini | 9.12% | 2.83% | -6.29 p.p. | -69% |
| Ethiopia | 2.41% | 0.94% | -1.47 p.p. | -61% |
| Faeroe Islands | 9.01% | 10.96%² | 1.95 p.p. | 22% |
| Falkland Islands | 42.69% | 50.53%² | 7.84 p.p. | 18% |
| Fiji | 1.82% | 1.57% | -0.25 p.p. | -14% |
| Finland | 1.27% | 6.97% | 5.70 p.p. | 450% |
| France | 10.41% | 13.06% | 2.65 p.p. | 25% |
| French Guiana | 54.35% | 41.09%² | -13.26 p.p. | -24% |
| Gabon | 13.50% | 18.72% | 5.22 p.p. | 39% |
| Gambia | 12.36% | 8.92% | -3.44 p.p. | -28% |
| Georgia | 5.63% | 1.99% | -3.64 p.p. | -65% |
| Germany | 7.51% | 18.81% | 11.30 p.p. | 151% |
| Ghana | 1.12% | 1.53% | 0.42 p.p. | 37% |
| Greece | 6.04% | 12.86% | 6.81 p.p. | 113% |
| Greenland | 16.71% | 10.52%² | -6.19 p.p. | -37% |
| Grenada | 4.43% | 6.41% | 1.98 p.p. | 45% |
| Guadeloupe | 18.72% | 21.13%² | 2.41 p.p. | 13% |
| Guatemala | 2.85% | 0.47% | -2.38 p.p. | -83% |
| Guinea | 6.35% | 0.93% | -5.43 p.p. | -85% |
| Guinea-Bissau | 1.58% | 0.91% | -0.66 p.p. | -42% |
| Guyana | 0.55% | 3.96% | 3.41 p.p. | 619% |
| Haiti | 0.27% | 0.17% | -0.11 p.p. | -39% |
| Honduras | 5.46% | 0.40% | -5.06 p.p. | -93% |
| Hong Kong | 38.73% | 39.52% | 0.78 p.p. | 2% |
| Hungary | 3.35% | 6.05% | 2.70 p.p. | 81% |
| Iceland | 3.76% | 19.17% | 15.41 p.p. | 410% |
| India | 0.87% | 0.35% | -0.52 p.p. | -59% |
| Indonesia | 0.26% | 0.13% | -0.13 p.p. | -49% |
| Iran | 7.61% | 3.33% | -4.28 p.p. | -56% |
| Iraq | 0.48% | 0.91% | 0.43 p.p. | 89% |
| Ireland | 6.49% | 17.64% | 11.15 p.p. | 172% |
| Israel | 36.70% | 22.57% | -14.13 p.p. | -39% |
| Italy | 2.50% | 10.56% | 8.06 p.p. | 322% |
| Jamaica | 0.85% | 0.80% | -0.05 p.p. | -6% |
| Japan | 0.86% | 2.19% | 1.33 p.p. | 154% |
| Jordan | 32.15% | 33.89% | 1.74 p.p. | 5% |
| Kazakhstan | 22.09% | 19.88% | -2.21 p.p. | -10% |
| Kenya | 1.26% | 1.95% | 0.70 p.p. | 55% |
| Kiribati | 2.99% | 2.62% | -0.37 p.p. | -12% |
| Kuwait | 51.27% | 72.83% | 21.55 p.p. | 42% |
| Kyrgyzstan | 14.25% | 3.05% | -11.20 p.p. | -79% |
| Laos | 0.54% | 0.67% | 0.13 p.p. | 25% |
| Latvia | 24.25% | 12.69% | -11.55 p.p. | -48% |
| Lebanon | 18.68% | 25.09% | 6.41 p.p. | 34% |
| Lesotho | 0.48% | 0.56% | 0.08 p.p. | 16% |
| Liberia | 4.58% | 1.74% | -2.84 p.p. | -62% |
| Libya | 10.30% | 12.03% | 1.73 p.p. | 17% |
| Liechtenstein | 37.88% | 67.85% | 29.97 p.p. | 79% |
| Lithuania | 9.45% | 5.33% | -4.12 p.p. | -44% |
| Luxembourg | 29.81% | 47.62% | 17.81 p.p. | 60% |
| Madagascar | 0.21% | 0.13% | -0.08 p.p. | -38% |
| Malawi | 11.99% | 1.00% | -10.99 p.p. | -92% |
| Malaysia | 3.86% | 10.74% | 6.88 p.p. | 178% |
| Maldives | 3.89% | 12.96% | 9.07 p.p. | 233% |
| Mali | 1.90% | 2.40% | 0.50 p.p. | 26% |
| Malta | 4.17% | 25.99% | 21.83 p.p. | 524% |
| Marshall Islands | 2.45% | 5.57% | 3.12 p.p. | 127% |
| Martinique | 10.77% | 16.75%² | 5.98 p.p. | 55% |
| Mauritania | 5.49% | 3.92% | -1.57 p.p. | -29% |
| Mauritius | 0.34% | 2.27% | 1.93 p.p. | 564% |
| Mexico | 0.83% | 0.93% | 0.10 p.p. | 12% |
| Moldova | 12.46% | 2.59% | -9.88 p.p. | -79% |
| Monaco | 69.17% | 67.78% | -1.39 p.p. | -2% |
| Mongolia | 0.31% | 0.65% | 0.34 p.p. | 111% |
| Montenegro | 12.58%¹ | 11.30% | -1.27 p.p. | -10% |
| Montserrat | 18.76% | 21.79%² | 3.03 p.p. | 16% |
| Morocco | 0.22% | 0.28% | 0.06 p.p. | 25% |
| Mozambique | 0.94% | 1.08% | 0.14 p.p. | 15% |
| Myanmar | 0.32% | 0.14% | -0.18 p.p. | -56% |
| Namibia | 8.42% | 4.30% | -4.11 p.p. | -49% |
| Nauru | 29.61% | 20.32% | -9.30 p.p. | -31% |
| Nepal | 2.27% | 1.67% | -0.60 p.p. | -26% |
| Netherlands | 7.90% | 13.76% | 5.86 p.p. | 74% |
| New Caledonia | 22.20% | 25.45%² | 3.25 p.p. | 15% |
| New Zealand | 15.24% | 28.65% | 13.41 p.p. | 88% |
| Nicaragua | 0.99% | 0.64% | -0.35 p.p. | -36% |
| Niger | 1.44% | 1.44% | >-0.01 p.p. | >-1% |
| Nigeria | 0.48% | 0.64% | 0.16 p.p. | 32% |
| North Korea | 0.17% | 0.19% | 0.02 p.p. | 14% |
| North Macedonia | 4.77% | 6.30% | 1.54 p.p. | 32% |
| Norway | 4.53% | 15.72% | 11.19 p.p. | 247% |
| Oman | 16.78% | 46.47% | 29.69 p.p. | 177% |
| Pakistan | 5.77% | 1.48% | -4.28 p.p. | -74% |
| Palau | 18.59% | 28.12% | 9.53 p.p. | 51% |
| Palestine | 13.72% | 5.35% | -8.37 p.p. | -61% |
| Panama | 2.54% | 7.26% | 4.72 p.p. | 186% |
| Papua New Guinea | 0.73% | 0.35% | -0.38 p.p. | -52% |
| Paraguay | 4.64% | 2.38% | -2.26 p.p. | -49% |
| Peru | 0.26% | 3.71% | 3.46 p.p. | 1345% |
| Philip.p.ines | 0.25% | 0.21% | -0.04 p.p. | -17% |
| Poland | 2.97% | 2.16% | -0.81 p.p. | -27% |
| Portugal | 4.40% | 9.83% | 5.42 p.p. | 123% |
| Puerto Rico | 9.12% | 7.59%² | -1.53 p.p. | -17% |
| Qatar | 65.04% | 77.27% | 12.23 p.p. | 19% |
| Reunion | 9.47% | 14.39%² | 4.91 p.p. | 52% |
| Romania | 0.58% | 3.67% | 3.09 p.p. | 534% |
| Russia | 7.81% | 7.97% | 0.16 p.p. | 2% |
| Rwanda | 2.19% | 3.97% | 1.77 p.p. | 81% |
| Saint Kitts and Nevis | 7.97% | 14.52% | 6.55 p.p. | 82% |
| Saint Lucia | 3.84% | 4.54% | 0.70 p.p. | 18% |
| Saint Pierre and Miquelon | 19.69% | 19.14%² | -0.55 p.p. | -3% |
| Saint Vincent and the Grenadines | 3.69% | 4.27% | 0.58 p.p. | 16% |
| Samoa | 2.06% | 2.03% | -0.03 p.p. | -2% |
| San Marino | 13.72% | 16.33% | 2.61 p.p. | 19% |
| Sao Tome and Principe | 4.68% | 0.98% | -3.71 p.p. | -79% |
| Saudi Arabia | 30.79% | 38.65% | 7.86 p.p. | 26% |
| Senegal | 3.59% | 1.64% | -1.95 p.p. | -54% |
| Serbia | 1.04% | 9.42% | 8.38 p.p. | 803% |
| Seychelles | 5.27% | 13.27% | 8.00 p.p. | 152% |
| Sierra Leone | 5.14% | 0.67% | -4.47 p.p. | -87% |
| Singapore | 24.14% | 43.14% | 19.00 p.p. | 79% |
| Slovakia | 0.78% | 3.61% | 2.83 p.p. | 362% |
| Slovenia | 8.88% | 13.37% | 4.50 p.p. | 51% |
| Solomon Islands | 1.35% | 0.37% | -0.99 p.p. | -73% |
| Somalia | 6.62% | 0.37% | -6.25 p.p. | -94% |
| South Africa | 3.16% | 4.82% | 1.66 p.p. | 52% |
| South Korea | 0.10% | 3.37% | 3.27 p.p. | 3238% |
| South Sudan | 2.43%¹ | 7.88% | 5.46 p.p. | 225% |
| Spain | 2.10% | 14.63% | 12.54 p.p. | 598% |
| Sri Lanka | 0.24% | 0.19% | -0.05 p.p. | -22% |
| Sudan | 6.96% | 3.15% | -3.82 p.p. | -55% |
| Suriname | 4.46% | 8.15% | 3.68 p.p. | 83% |
| Sweden | 9.21% | 19.84% | 10.63 p.p. | 116% |
| Switzerland | 20.93% | 28.79% | 7.86 p.p. | 38% |
| Syria | 5.74% | 4.96% | -0.77 p.p. | -13% |
| Tajikistan | 8.12% | 2.89% | -5.22 p.p. | -64% |
| Tanzania | 2.28% | 0.71% | -1.56 p.p. | -69% |
| Thailand | 0.94% | 5.20% | 4.27 p.p. | 457% |
| Togo | 2.25% | 3.38% | 1.13 p.p. | 50% |
| Tonga | 3.06% | 3.54% | 0.48 p.p. | 16% |
| Trinidad and Tobago | 4.15% | 5.63% | 1.49 p.p. | 36% |
| Tunisia | 0.46% | 0.51% | 0.05 p.p. | 10% |
| Turkey | 2.16% | 7.18% | 5.02 p.p. | 233% |
| Turkmenistan | 8.32% | 3.23% | -5.09 p.p. | -61% |
| Tuvalu | 3.57% | 2.03% | -1.54 p.p. | -43% |
| Uganda | 3.14% | 3.76% | 0.63 p.p. | 20% |
| Ukraine | 13.39% | 11.43% | -1.97 p.p. | -15% |
| United Arab Emirates | 71.46% | 88.13% | 16.67 p.p. | 23% |
| United Kingdom | 6.39% | 13.79% | 7.40 p.p. | 116% |
| United States | 9.22% | 15.30% | 6.08 p.p. | 66% |
| Uruguay | 3.15% | 3.12% | -0.04 p.p. | -1% |
| Uzbekistan | 8.10% | 3.47% | -4.63 p.p. | -57% |
| Vanuatu | 1.57% | 1.06% | -0.51 p.p. | -33% |
| Venezuela | 5.22% | 4.66% | -0.56 p.p. | -11% |
| Vietnam | 0.04% | 0.08% | 0.04 p.p. | 93% |
| Western Sahara | 0.97% | 0.83%² | -0.14 p.p. | -15% |
| World | 2.87% | 3.60% | 0.73 p.p. | 25% |
| Yemen | 1.01% | 1.30% | 0.28 p.p. | 28% |
| Zambia | 3.48% | 1.02% | -2.46 p.p. | -71% |
| Zimbabwe | 6.08% | 2.80% | -3.28 p.p. | -54% |
¹Data as of 2010 due to data availability
²Data as of 2015 due to data availability
Higher immigration levels are generally correlated with higher standards of living and advanced economies. For instance, North America, Europe, and Oceania all have a relatively high proportion of immigrants.
The United States is home to the largest number of immigrants—over 50 million—which now make up 15% of the country’s population. Since 1990, the proportion of immigrants in the country has continued to rise. As with most advanced economies, immigration has helped to counter a decline in fertility rates.
Over the last 30 years, the United Arab Emirates (UAE) has had the highest immigration by country, with 88% of its population being defined as immigrants in 2020. The country has the highest GDP per capita of any of its neighboring countries, and draws many migrant workers.
Meanwhile, South Korea has seen the largest relative increase in immigrants over the last three decades. Faced with the lowest fertility rate in the world and an aging population, the country has enacted policy reforms to encourage immigration, including a formal guest worker program and local voting rights for permanent foreign residents.
Integration or Separation?
Immigrants can help fill labor gaps and drive economic innovation in their new country of residence. Depending on their destination, they may benefit from things like higher pay, access to better education, and a more stable political climate.
Notably, countries respond to immigration in different ways. In one study measuring what governments are doing to integrate migrants, Sweden ranked at the top. The country offers non-EU citizens equal access to education, labor market rights and its social safety net, and it also has strong anti-discrimination laws.
On the flip side, immigrants may face challenges integrating into other countries. For instance, the UAE’s kafala (sponsorship) system is structured so that employment visas are granted by local individuals or companies rather than the state. This gives employers enhanced power over their workers, and in the past it has resulted in alleged human rights abuses.

This article was published as a part of Visual Capitalist's Creator Program, which features data-driven visuals from some of our favorite Creators around the world.


Maps
The Largest Earthquakes in the New York Area (1970-2024)
The earthquake that shook buildings across New York in April 2024 was the third-largest quake in the Northeast U.S. over the past 50 years.


The Largest Earthquakes in the New York Area
This was originally posted on our Voronoi app. Download the app for free on Apple or Android and discover incredible data-driven charts from a variety of trusted sources.
The 4.8 magnitude earthquake that shook buildings across New York on Friday, April 5th, 2024 was the third-largest quake in the U.S. Northeast area over the past 50 years.
In this map, we illustrate earthquakes with a magnitude of 4.0 or greater recorded in the Northeastern U.S. since 1970, according to the United States Geological Survey (USGS).
Shallow Quakes and Older Buildings
The earthquake that struck the U.S. Northeast in April 2024 was felt by millions of people from Washington, D.C., to north of Boston. It even caused a full ground stop at Newark Airport.
The quake, occurring just 5 km beneath the Earth’s surface, was considered shallow, which is what contributed to more intense shaking at the surface.
According to the USGS, rocks in the eastern U.S. are significantly older, denser, and harder than those on the western side, compressed by time. This makes them more efficient conduits for seismic energy. Additionally, buildings in the Northeast tend to be older and may not adhere to the latest earthquake codes.
Despite disrupting work and school life, the earthquake was considered minor, according to the Michigan Technological University magnitude scale:
| Magnitude | Earthquake Effects | Estimated Number Each Year |
|---|---|---|
| 2.5 or less | Usually not felt, but can be recorded by seismograph. | Millions |
| 2.5 to 5.4 | Often felt, but only causes minor damage. | 500,000 |
| 5.5 to 6.0 | Slight damage to buildings and other structures. | 350 |
| 6.1 to 6.9 | May cause a lot of damage in very populated areas. | 100 |
| 7.0 to 7.9 | Major earthquake. Serious damage. | 10-15 |
| 8.0 or greater | Great earthquake. Can totally destroy communities near the epicenter. | One every year or two |
The largest earthquake felt in the area over the past 50 years was a 5.3 magnitude quake that occurred in Au Sable Forks, New York, in 2002. It damaged houses and cracked roads in a remote corner of the Adirondack Mountains, but caused no injuries.
| Date | Magnitude | Location | State |
|---|---|---|---|
| April 20, 2002 | 5.3 | Au Sable Forks | New York |
| October 7, 1983 | 5.1 | Newcomb | New York |
| April 5, 2024 | 4.8 | Whitehouse Station | New Jersey |
| October 16, 2012 | 4.7 | Hollis Center | Maine |
| January 16, 1994 | 4.6 | Sinking Spring | Pennsylvania |
| January 19, 1982 | 4.5 | Sanbornton | New Hampshire |
| September 25, 1998 | 4.5 | Adamsville | Pennsylvania |
| June 9, 1975 | 4.2 | Altona | New York |
| May 29, 1983 | 4.2 | Peru | Maine |
| April 23, 1984 | 4.2 | Conestoga | Pennsylvania |
| January 16, 1994 | 4.2 | Sinking Spring | Pennsylvania |
| November 3, 1975 | 4 | Long Lake | New York |
| June 17, 1991 | 4 | Worcester | New York |
The largest earthquake in U.S. history, however, was the 1964 Good Friday quake in Alaska, measuring 9.2 magnitude and killing 131 people.

-

 Mining1 week ago
Gold vs. S&P 500: Which Has Grown More Over Five Years?
-

 Markets2 weeks ago
Ranked: The Most Valuable Housing Markets in America
-

 Money2 weeks ago
Which States Have the Highest Minimum Wage in America?
-

 AI2 weeks ago
Ranked: Semiconductor Companies by Industry Revenue Share
-

 Markets2 weeks ago
Ranked: The World’s Top Flight Routes, by Revenue
-

 Countries2 weeks ago
Population Projections: The World’s 6 Largest Countries in 2075
-

 Markets2 weeks ago
The Top 10 States by Real GDP Growth in 2023
-

 Demographics2 weeks ago
The Smallest Gender Wage Gaps in OECD Countries