Datastream
The Data Behind America’s H-1B Visa Program


The Briefing
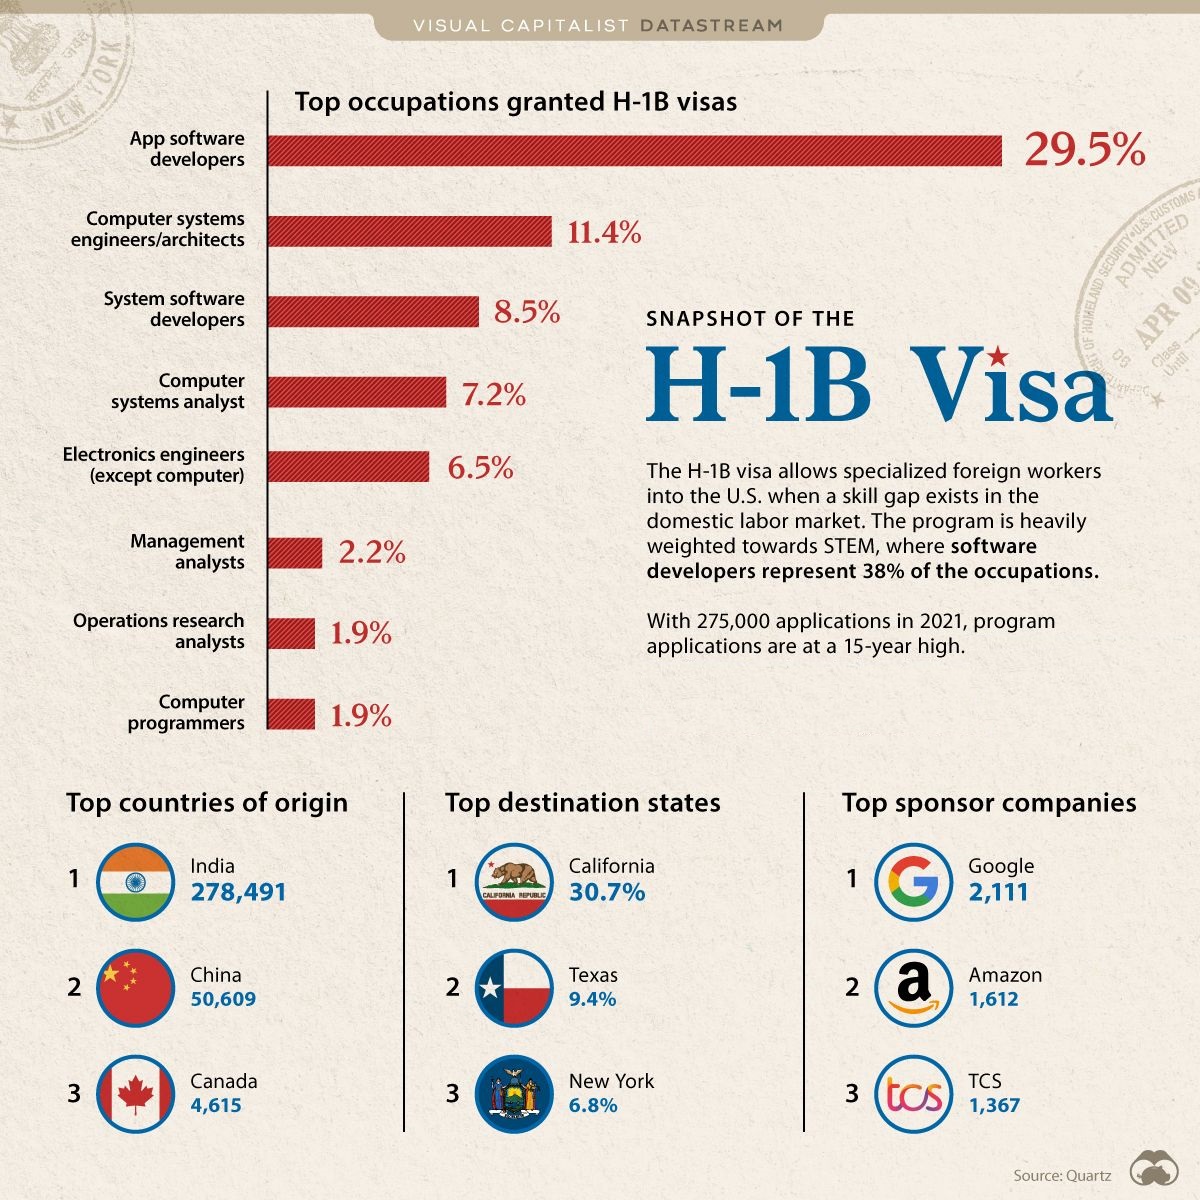
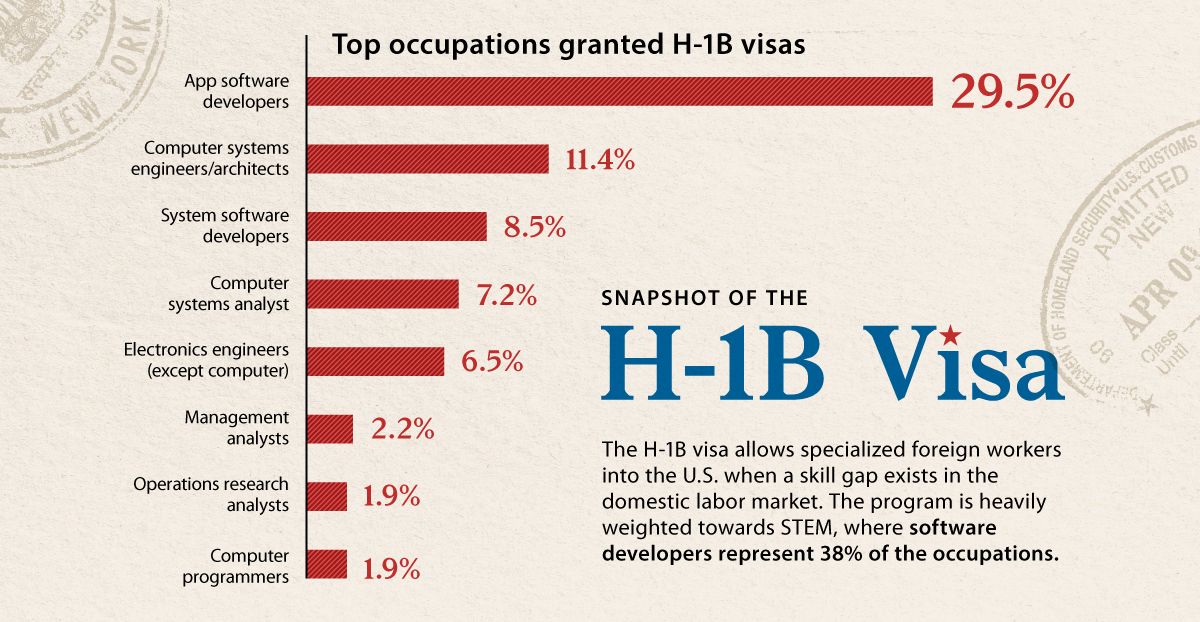
- The H-1B visa is extremely tech focused, with total software developers making up 38% of all applications
- More than 275,000 applications were filed in fiscal 2021, but only 85,000 will be accepted
H-1B Visa Origins
The H-1B Visa is an immigration program that brings highly skilled workers into America when a shortage of those skills exists in the domestic labor market. The program came to life as part of the Immigration Act of 1990, under the George H.W. Bush administration. Although the program was temporarily suspended for 10 months under the Trump administration, this stoppage has since been lifted by Biden.
Though regulations permit specialized knowledge workers from various fields, it is primarily tech jobs that crowd these occupations. For instance, software developers and computer systems engineers/architects collectively cover almost 50% of all roles.
Competition Intensifies
The H-1B visa is highly competitive. In fiscal 2021, program applications hit 275,000, a 15-year high. The program follows a lottery system where 85,000 applicants are selected at random. Today, that means a given applicant has about a 30% chance of getting in.
| Year | Number of Applicants |
|---|---|
| 2021 | 275,000 |
| 2020 | 200,000 |
| 2019 | 187,500 |
| 2018 | 200,000 |
| 2017 | 237,500 |
| 2016 | 225,000 |
| 2015 | 175,000 |
| 2014 | 125,000 |
Although the system is a lottery, the first 20,000 spots are reserved for those with a master’s degree or higher, so those holding a higher education tend to have improved odds.
Roughly two-thirds of applicants come from India. The large Indian presence exists in the sponsor companies list as well.
Tata Consultancy Services (TCS) is an IT services and consulting company, headquartered in Mumbai, India. In addition to being a top visa sponsor, they’re also among the top two US recruiters of IT services talent, an industry India thrives in. The company trades on the National Stock Exchange of India (NSE) and hold a market cap of $160 billion (₹12 trillion).
America’s Immigration Question
Unlike some other immigration programs, the H-1B visa is not permanent, with a duration of stay between three to six years, contingent on maintaining employment. Should a termination occur, the person must leave the U.S. within the 60-day grace period.
America’s view on immigration can fluctuate over time, affecting application numbers in some cases, like for university and MBA programs. A 2020 poll showed that “the social and political climate in the U.S.” and “feeling welcome in the U.S.” were two growing factors for a decline in international students over the last few years.
But as of now, it looks like this sentiment hasn’t transferred over to H-1B Visa applicants and the program remains more attractive than ever.
Where does this data come from?
Source: Quartz
Notes: Data comes from both 2019 and 2020


Datastream
Can You Calculate Your Daily Carbon Footprint?
Discover how the average person’s carbon footprint impacts the environment and learn how carbon credits can offset your carbon footprint.


The Briefing
- A person’s carbon footprint is substantial, with activities such as food consumption creating as much as 4,500 g of CO₂ emissions daily.
- By purchasing carbon credits from Carbon Streaming Corporation, you can offset your own emissions and fund positive climate action.
Your Everyday Carbon Footprint
While many large businesses and countries have committed to net-zero goals, it is essential to acknowledge that your everyday activities also contribute to global emissions.
In this graphic, sponsored by Carbon Streaming Corporation, we will explore how the choices we make and the products we use have a profound impact on our carbon footprint.
Carbon Emissions by Activity
Here are some of the daily activities and products of the average person and their carbon footprint, according to Clever Carbon.
| Household Activities & Products | CO2 Emissions (g) |
|---|---|
| 💡 Standard Light Bulb (100 watts, four hours) | 172 g |
| 📱 Mobile Phone Use (195 minutes per day)* | 189 g |
| 👕 Washing Machine (0.63 kWh) | 275 g |
| 🔥 Electric Oven (1.56 kWh) | 675 g |
| ♨️ Tumble Dryer (2.5 kWh) | 1,000 g |
| 🧻 Toilet Roll (2 ply) | 1,300 g |
| 🚿 Hot Shower (10 mins) | 2,000 g |
| 🚙 Daily Commute (one hour, by car) | 3,360 g |
| 🍽️ Average Daily Food Consumption (three meals of 600 calories) | 4,500 g |
| *Phone use based on yearly use of 69kg per the source, Reboxed | |
Your choice of transportation plays a crucial role in determining your carbon footprint. For instance, a 15 km daily commute to work on public transport generates an average of 1,464 g of CO₂ emissions. Compared to 3,360 g—twice the volume for a journey the same length by car.
By opting for more sustainable modes of transport, such as cycling, walking, or public transportation, you can significantly reduce your carbon footprint.
Addressing Your Carbon Footprint
One way to compensate for your emissions is by purchasing high-quality carbon credits.
Carbon credits are used to help fund projects that avoid, reduce or remove CO₂ emissions. This includes nature-based solutions such as reforestation and improved forest management, or technology-based solutions such as the production of biochar and carbon capture and storage (CCS).
While carbon credits offer a potential solution for individuals to help reduce global emissions, public awareness remains a significant challenge. A BCG-Patch survey revealed that only 34% of U.S. consumers are familiar with carbon credits, and only 3% have purchased them in the past.
About Carbon Streaming
By financing the creation or expansion of carbon projects, Carbon Streaming Corporation secures the rights to future carbon credits generated by these sustainable projects. You can then purchase these carbon credits to help fund climate solutions around the world and compensate for your own emissions.
Ready to get involved?
>> Learn more about purchasing carbon credits at Carbon Streaming

-

 Maps2 weeks ago
Mapped: Average Wages Across Europe
-

 Money1 week ago
Which States Have the Highest Minimum Wage in America?
-

 Real Estate1 week ago
Ranked: The Most Valuable Housing Markets in America
-

 Markets1 week ago
Charted: Big Four Market Share by S&P 500 Audits
-

 AI1 week ago
The Stock Performance of U.S. Chipmakers So Far in 2024
-

 Automotive1 week ago
Almost Every EV Stock is Down After Q1 2024
-

 Money2 weeks ago
Where Does One U.S. Tax Dollar Go?
-

 Green2 weeks ago
Ranked: Top Countries by Total Forest Loss Since 2001