Misc
Countries with the Highest (and Lowest) Proportion of Immigrants
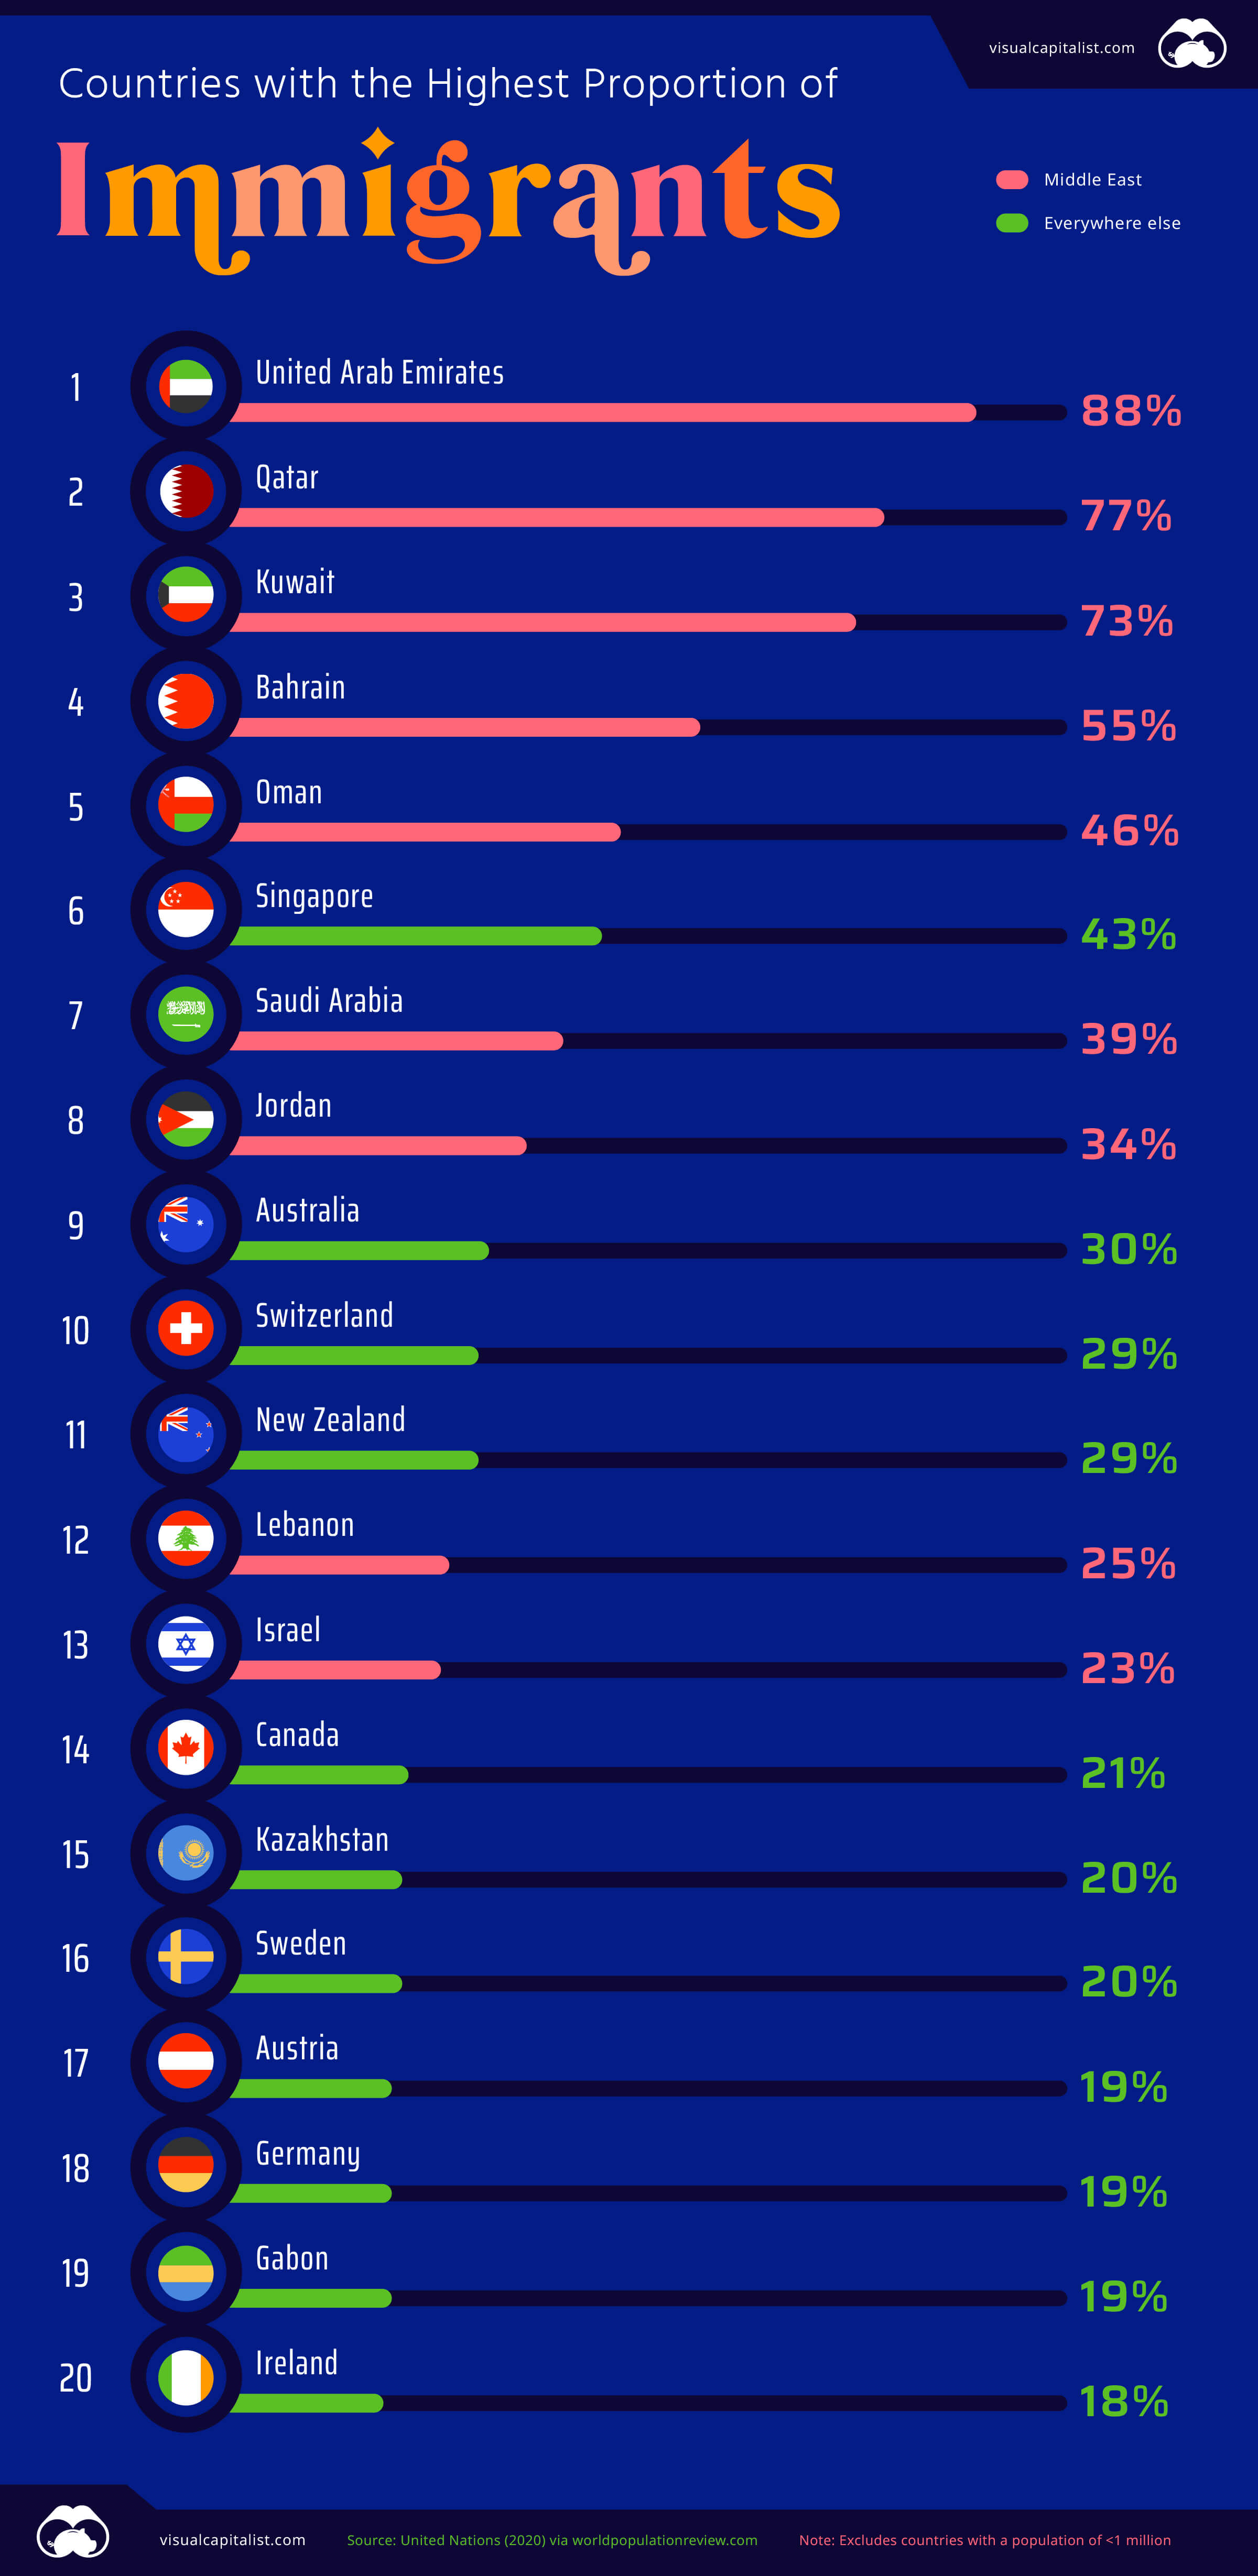
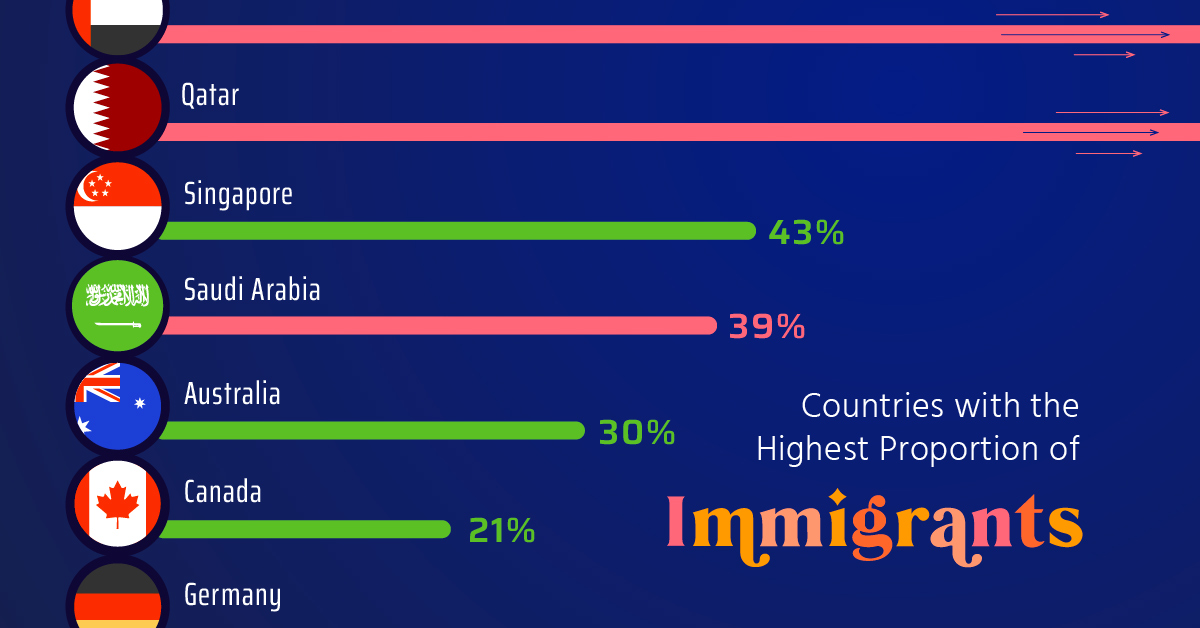
Countries with the Highest Proportion of Immigrants
For people living in cosmopolitan urban centers, it’s easy to overestimate the prevalence of immigrants around the world.
The median proportion of foreign-born people in all countries is just over 5%. In countries with a population greater than one million, only four are majority foreign-born, and only eight surpass the one-third mark.
Here are the top 20 countries with the highest proportion of immigrants in their populations:
| Country | Immigrants as a percentage of population |
|---|---|
| 🇦🇪 United Arab Emirates | 88% |
| 🇶🇦 Qatar | 77% |
| 🇰🇼 Kuwait | 73% |
| 🇧🇭 Bahrain | 55% |
| 🇴🇲 Oman | 46% |
| 🇸🇬 Singapore | 43% |
| 🇸🇦 Saudi Arabia | 39% |
| 🇯🇴 Jordan | 34% |
| 🇦🇺 Australia | 30% |
| 🇨🇭 Switzerland | 29% |
| 🇳🇿 New Zealand | 29% |
| 🇱🇧 Lebanon | 25% |
| 🇮🇱 Israel | 23% |
| 🇨🇦 Canada | 21% |
| 🇰🇿 Kazakhstan | 20% |
| 🇸🇪 Sweden | 20% |
| 🇦🇹 Austria | 19% |
| 🇩🇪 Germany | 19% |
| 🇬🇦 Gabon | 19% |
| 🇮🇪 Ireland | 18% |
Source: UN via World Population Review. Note: Only countries with a population of greater than one million are included.
The United Arab Emirates comes out on top for the highest proportion of immigrants in its population. Impressively, the small Middle Eastern nation ranks sixth in the world for total immigrant population (8.7 million people).
Other countries on the Arabian Peninsula also rank at the top of this list. In Qatar, current host of the 2022 World Cup, 3-in-4 people are immigrants. The high proportion of foreign workers in the country also results in an extreme demographic skew—approximately 75% of the population of Qatar is male.
The one extreme outlier in the region is war-torn Yemen, where only 1.3% of the population are immigrants.
Outside the Middle East, Singapore (43%) takes top spot, followed by Australia (30%).
Spotlight on U.S. Immigration
Although the United States is outside the top 20, it still has by far the most immigrants of any other country (50 million vs. 16 million in second-place Germany).
About 15% of people in the U.S. are immigrants—numbers which are comparable to the historic high in the late 19th century. The proportion of foreign-born people in the country has been on the rise since the 1970s, and is projected to continue rising in coming decades. Around 2030, immigration is expected to surpass natural increases as a driver of population growth.
Countries with the Lowest Proportion of Immigrants
A few countries are magnets for immigration, while a great many more receive very little immigration. This can simply be due to lack of demand, or because of more extreme circumstances such as war or a failing economy. In other cases, immigration policies may limit the number of people who can migrate to a country.
Here are the top 20 countries with the lowest proportion of immigrants in their populations:
| Country | Immigrants as a percentage of population |
|---|---|
| 🇨🇺 Cuba | 0.03% |
| 🇨🇳 China | 0.07% |
| 🇻🇳 Vietnam | 0.08% |
| 🇮🇩 Indonesia | 0.13% |
| 🇲🇬 Madagascar | 0.13% |
| 🇲🇲 Myanmar | 0.14% |
| 🇭🇹 Haiti | 0.17% |
| 🇰🇵 North Korea | 0.19% |
| 🇱🇰 Sri Lanka | 0.19% |
| 🇵🇭 Philippines | 0.21% |
| 🇲🇦 Morocco | 0.28% |
| 🇮🇳 India | 0.35% |
| 🇵🇬 Papua New Guinea | 0.35% |
| 🇦🇫 Afghanistan | 0.37% |
| 🇸🇴 Somalia | 0.37% |
| 🇪🇷 Eritrea | 0.39% |
| 🇭🇳 Honduras | 0.40% |
| 🇬🇹 Guatemala | 0.47% |
| 🇰🇭 Cambodia | 0.47% |
| 🇹🇳 Tunisia | 0.51% |
Cuba has the lowest level of foreign-born people in its population. The Caribbean nation makes it very difficult for foreign nationals obtain permanent residency.
China comes in second last. In absolute terms, the million or so immigrants living in China may sound like a lot, but pales in comparison to the overall population of 1.4 billion.
Interestingly, Japan–which is the poster child for low immigration–isn’t on the list above. The country’s foreign-born population sits at just over 2%.


VC+
VC+: Get Our Key Takeaways From the IMF’s World Economic Outlook
A sneak preview of the exclusive VC+ Special Dispatch—your shortcut to understanding IMF’s World Economic Outlook report.

Have you read IMF’s latest World Economic Outlook yet? At a daunting 202 pages, we don’t blame you if it’s still on your to-do list.
But don’t worry, you don’t need to read the whole April release, because we’ve already done the hard work for you.
To save you time and effort, the Visual Capitalist team has compiled a visual analysis of everything you need to know from the report—and our VC+ Special Dispatch is available exclusively to VC+ members. All you need to do is log into the VC+ Archive.
If you’re not already subscribed to VC+, make sure you sign up now to access the full analysis of the IMF report, and more (we release similar deep dives every week).
For now, here’s what VC+ members get to see.
Your Shortcut to Understanding IMF’s World Economic Outlook
With long and short-term growth prospects declining for many countries around the world, this Special Dispatch offers a visual analysis of the key figures and takeaways from the IMF’s report including:
- The global decline in economic growth forecasts
- Real GDP growth and inflation forecasts for major nations in 2024
- When interest rate cuts will happen and interest rate forecasts
- How debt-to-GDP ratios have changed since 2000
- And much more!

Get the Full Breakdown in the Next VC+ Special Dispatch
VC+ members can access the full Special Dispatch by logging into the VC+ Archive, where you can also check out previous releases.
Make sure you join VC+ now to see exclusive charts and the full analysis of key takeaways from IMF’s World Economic Outlook.
Don’t miss out. Become a VC+ member today.
What You Get When You Become a VC+ Member
VC+ is Visual Capitalist’s premium subscription. As a member, you’ll get the following:
- Special Dispatches: Deep dive visual briefings on crucial reports and global trends
- Markets This Month: A snappy summary of the state of the markets and what to look out for
- The Trendline: Weekly curation of the best visualizations from across the globe
- Global Forecast Series: Our flagship annual report that covers everything you need to know related to the economy, markets, geopolitics, and the latest tech trends
- VC+ Archive: Hundreds of previously released VC+ briefings and reports that you’ve been missing out on, all in one dedicated hub
You can get all of the above, and more, by joining VC+ today.

-

 Misc1 week ago
How Hard Is It to Get Into an Ivy League School?
-

 Technology2 weeks ago
Ranked: Semiconductor Companies by Industry Revenue Share
-

 Markets2 weeks ago
Ranked: The World’s Top Flight Routes, by Revenue
-

 Demographics2 weeks ago
Population Projections: The World’s 6 Largest Countries in 2075
-

 Markets2 weeks ago
The Top 10 States by Real GDP Growth in 2023
-

 Demographics2 weeks ago
The Smallest Gender Wage Gaps in OECD Countries
-

 United States2 weeks ago
Where U.S. Inflation Hit the Hardest in March 2024
-

 Green2 weeks ago
Top Countries By Forest Growth Since 2001