Sports
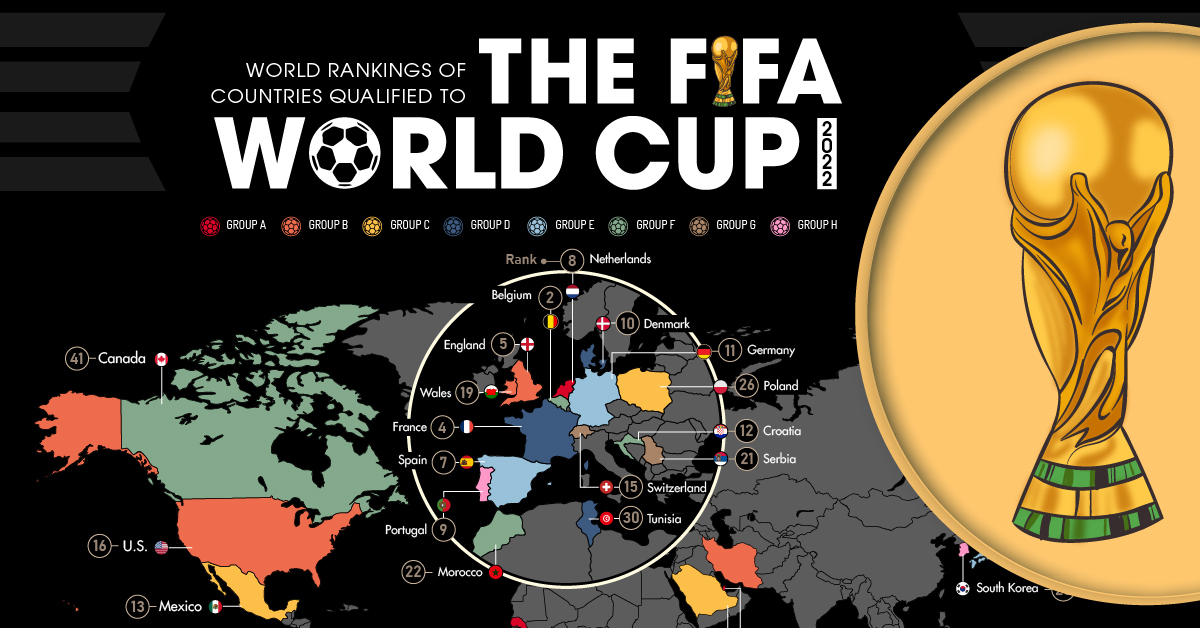
Mapped: The 32 Teams Playing in the 2022 FIFA World Cup
Article/Editing:
Mapped: The 32 Teams Playing in the 2022 FIFA World Cup
The FIFA World Cup is one of the most-watched sporting events in the world—in 2018, nearly 3.6 billion people tuned in to watch the tournament.
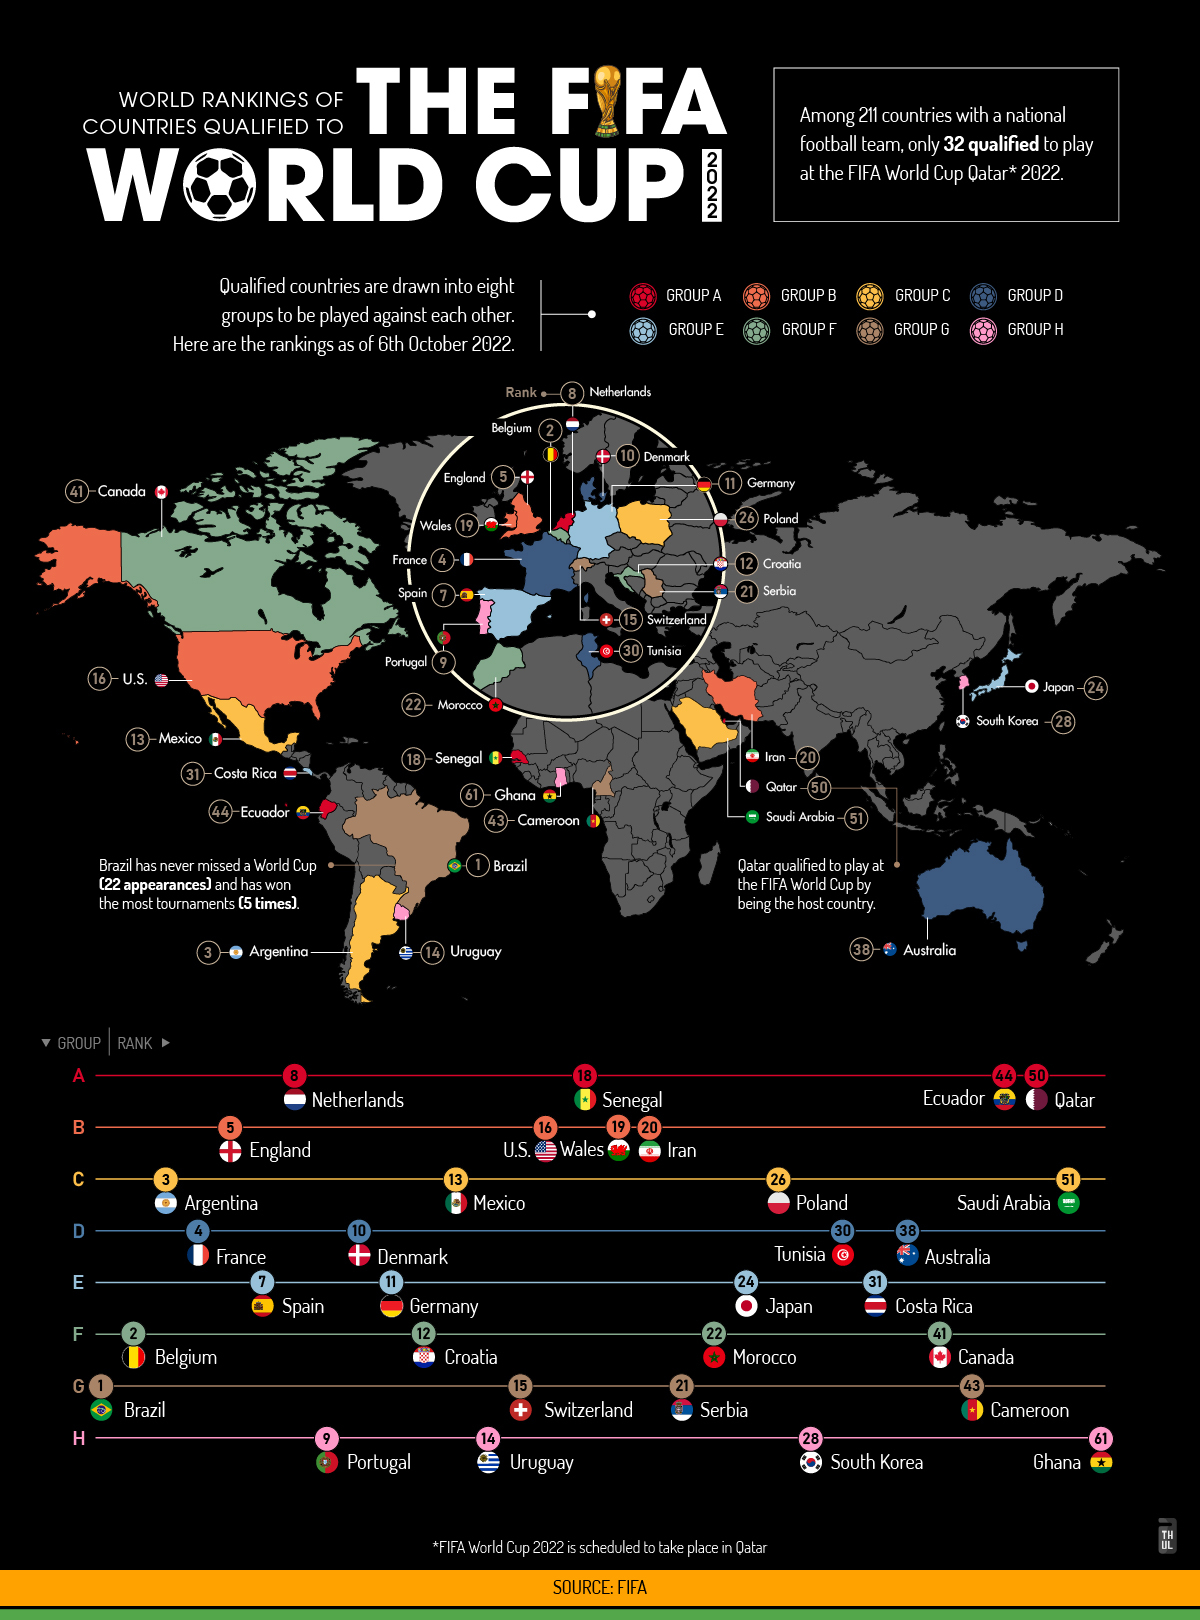
Starting on November 20th, that excitement will return as 32 teams from around the world will compete in the 22nd FIFA World Cup Championship in Qatar.
This graphic by Athul Alexander shows the teams that will be playing against one another this year, and their latest pre-tournament FIFA rankings.
The Ranks of the 32 Qualifying Teams
The FIFA World Ranking is used to compare the 211 teams that are part of the FIFA association. They attempt to measure the progression and current ability of the each national football team.
The ranking is determined using a number of different metrics, including the number of games a team has won and how “important” those results were, such as in major tournaments or against strong opponents.
But high-ranking teams don’t qualify for the World Cup directly. Instead, ranks are used for seeding in regional qualifying tournaments, as each region (also known as a “confederation”) has a select number of slots.
This means that every World Cup, many lower-ranked teams end up qualifying for the event over higher-ranked teams. For 2022, the biggest example of this is Italy’s national team (ranked #6), which failed to qualify.
Here’s a look at the World Ranking of the 32 qualifying teams, as of Oct 6, 2022:
| Country | FIFA Rank | Total Points |
|---|---|---|
| 🇧🇷 Brazil | 1 | 1841.30 |
| 🇧🇪 Belgium | 2 | 1816.71 |
| 🇦🇷 Argentina | 3 | 1773.88 |
| 🇫🇷 France | 4 | 1759.78 |
| 🏴 England | 5 | 1728.47 |
| 🇪🇸 Spain | 7 | 1715.22 |
| 🇳🇱 Netherlands | 8 | 1694.51 |
| 🇵🇹 Portugal | 9 | 1676.56 |
| 🇩🇰 Denmark | 10 | 1666.57 |
| 🇩🇪 Germany | 11 | 1650.21 |
| 🇭🇷 Croatia | 12 | 1645.64 |
| 🇲🇽 Mexico | 13 | 1644.89 |
| 🇺🇾 Uruguay | 14 | 1638.71 |
| 🇨🇭 Switzerland | 15 | 1635.92 |
| 🇺🇸 USA | 16 | 1627.48 |
| 🇸🇳 Senegal | 18 | 1584.38 |
| 🏴 Wales | 19 | 1569.82 |
| 🇮🇷 IR Iran | 20 | 1564.61 |
| 🇷🇸 Serbia | 21 | 1563.62 |
| 🇲🇦 Morocco | 22 | 1563.50 |
| 🇯🇵 Japan | 24 | 1559.54 |
| 🇵🇱 Poland | 26 | 1548.59 |
| 🇰🇷 Korea Republic | 28 | 1530.30 |
| 🇹🇳 Tunisia | 30 | 1507.54 |
| 🇨🇷 Costa Rica | 31 | 1503.59 |
| 🇦🇺 Australia | 38 | 1488.72 |
| 🇨🇦 Canada | 41 | 1475.00 |
| 🇨🇲 Cameroon | 43 | 1471.44 |
| 🇪🇨 Ecuador | 44 | 1464.39 |
| 🇶🇦 Qatar | 50 | 1439.89 |
| 🇸🇦 Saudi Arabia | 51 | 1437.78 |
| 🇬🇭 Ghana | 61 | 1393.00 |
The highest-ranked team is Brazil with 1841.30 points. The South American team holds the record for most World Cup wins with five total—in 1958, 1962, 1970, 1994, and 2002.
Next on the ranking is Belgium, with 1816.71 points. Belgium has yet to win the World Cup, however, in 2018 they made it to the semi-finals and ended up getting third place.
The Eight Groups for 2022
Each team’s ranking upon qualifying for the FIFA World Cup tournament is also used for seeding purposes to establish the groups.
The association first organizes the teams into four pots, based on their FIFA Ranking. Then, groups are established by randomly drawing teams from each pot.
Here’s a look at the eight different groups for 2022:
| Group | Country (Top Rank) | Country (Top Middle Rank) | Country (Bottom Middle Rank) | Country (Bottom Rank) |
|---|---|---|---|---|
| A | Netherlands | Senegal | Ecuador | Qatar |
| B | England | U.S. | Wales | Iran |
| C | Argentia | Mexico | Poland | Saudi Arabia |
| D | France | Denmark | Tunisia | Australia |
| E | Spain | Germany | Japan | Costa Rica |
| F | Belgium | Croatia | Morocco | Canada |
| G | Brazil | Switzerland | Serbia | Cameroon |
| H | Portugal | Uruguay | South Korea | Ghana |
The groups can’t have more than two teams from the same region, with the exception of Europe, which has double the amount of slots.
These groups will play each other in the first stage of the tournament, after which the top two teams from each group will move on to the bracket round.
Past FIFA World Cup Winners
Since 1930, the FIFA World Cup has been hosted every four years, apart from 1942 and 1946, when it was canceled during WWII.
Here’s a look at past cup winners, as well as the runner-ups, since 1930:
| Year | Winning Team | Score | Runners-up |
|---|---|---|---|
| 1930 | Uruguay | 4–2 | Argentina |
| 1934 | Italy | 2–1 | Czechoslovakia |
| 1938 | Italy | 4–2 | Hungary |
| 1950 | Uruguay | 2–1 | Brazil |
| 1954 | West Germany | 3–2 | Hungary |
| 1958 | Brazil | 5–2 | Sweden |
| 1962 | Brazil | 3–1 | Czechoslovakia |
| 1966 | England | 4–2 | West Germany |
| 1970 | Brazil | 4–1 | Italy |
| 1974 | West Germany | 2–1 | Netherlands |
| 1978 | Argentina | 3–1 | Netherlands |
| 1982 | Italy | 3–1 | West Germany |
| 1986 | Argentina | 3–2 | West Germany |
| 1990 | West Germany | 1–0 | Argentina |
| 1994 | Brazil | 0–0 (a.e.t.) (3–2 pen.) | Italy |
| 1998 | France | 3–0 | Brazil |
| 2002 | Brazil | 2–0 | Germany |
| 2006 | Italy | 1–1 (a.e.t.) (5–3 pen.) | France |
| 2010 | Spain | 1–0 (a.e.t.) | Netherlands |
| 2014 | Germany | 1–0 (a.e.t.) | Argentina |
| 2018 | France | 4–2 | Croatia |
*a.e.t mean “won after extra time,” pen. means “won by penalty kicks”
What’s expected for this year? While it’s technically anyone’s game, Brazil has a 15/4 chance of winning this year’s cup, according to bet365.

This article was published as a part of Visual Capitalist's Creator Program, which features data-driven visuals from some of our favorite Creators around the world.


Culture
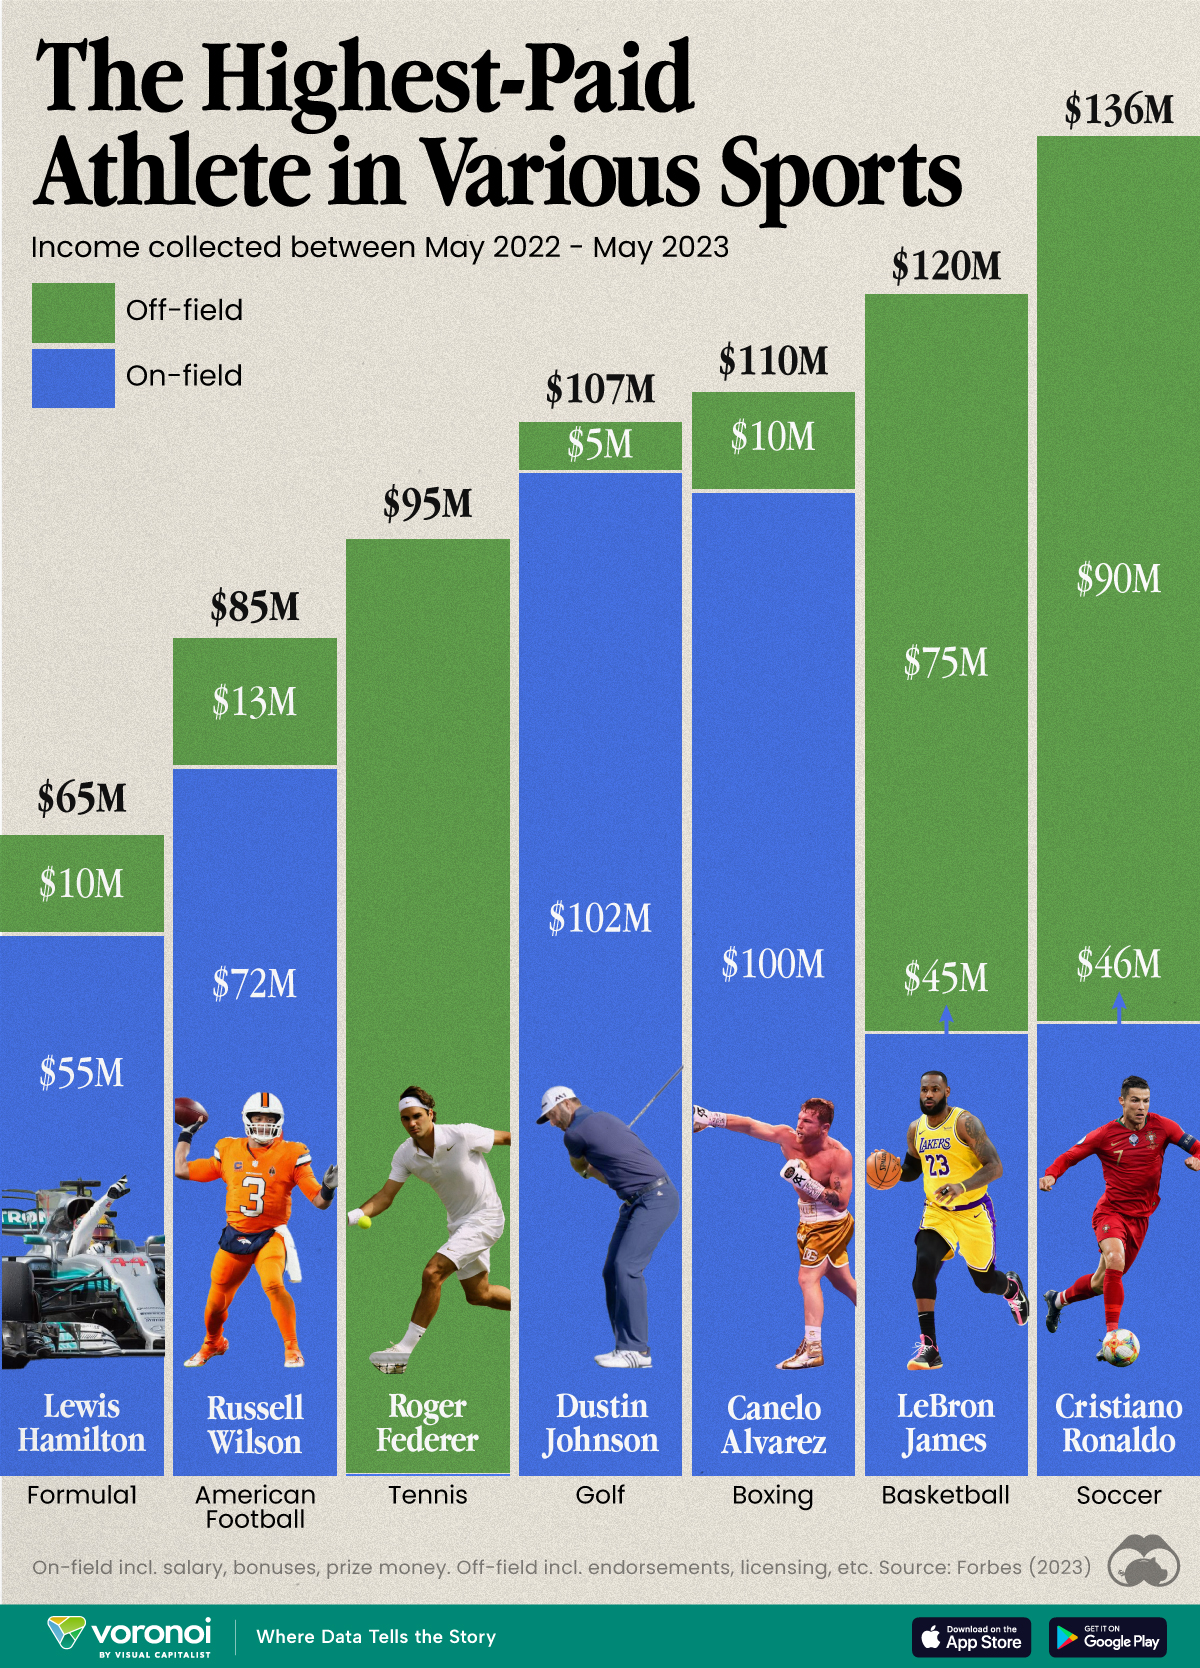
The Highest Earning Athletes in Seven Professional Sports
We illustrate how much the highest earning athletes across seven different sports make, and where they get their money from.
The Highest Earning Athletes in Seven Professional Sports
This was originally posted on our Voronoi app. Download the app for free on Apple or Android and discover incredible data-driven charts from a variety of trusted sources.
How much money do the world’s biggest athletes really make? And how do they compare across different sports?
We visualized the highest earning athletes in various professional sports, according to calculations from Forbes. Earnings reported here cover the period of May 2022 to May 2023. Earnings includes on-field (salary, bonuses, prize money) and off-field (endorsements, licensing, etc).
Forbes’ research included talking to industry insiders, following news reports, and parsing salary databases. Please see their methodology page for further details.
Who is the Highest Paid Athlete in the World?
Cristiano Ronaldo was the highest-paid athlete in the world, making an estimated $136 million between May 2022 and May 2023. His move to Saudi Arabian club Al Nassr set a record for the biggest contract in the sport at the time.
Here’s how he compared to the top earners in some other sports.
| Athlete | Sport | Total Earnings (May 2022–23) |
|---|---|---|
| Cristiano Ronaldo | ⚽ Soccer | $136M |
| LeBron James | 🏀 Basketball | $120M |
| Canelo Alvarez | 🥊 Boxing | $110M |
| Dustin Johnson | ⛳ Golf | $107M |
| Roger Federer | 🎾 Tennis | $95M |
| Russell Wilson | 🏈 American Football | $85M |
| Lewis Hamilton | 🏎️ Formula 1 | $65M |
Note: Figures are rounded.
Los Angeles Lakers superstar LeBron James made the most money in basketball (just under $120 million), which is almost twice as much as Formula 1’s top earner, Lewis Hamilton, who took home about $65 million in 2022–23.
Something else to note is how off-court earnings can contribute significantly to total income for some athletes.
| Athlete | Sport | On-Field Earnings | Off-Field Earnings |
|---|---|---|---|
| Cristiano Ronaldo | ⚽ Soccer | $46M | $90M |
| LeBron James | 🏀 Basketball | $45M | $75M |
| Canelo Alvarez | 🥊 Boxing | $100M | $10M |
| Dustin Johnson | ⛳ Golf | $102M | $5M |
| Roger Federer | 🎾 Tennis | $0.1M | $95M |
| Russell Wilson | 🏈 American Football | $72M | $13M |
| Lewis Hamilton | 🏎️ Formula 1 | $55M | $10M |
Note: Figures are rounded.
This is most apparent with Roger Federer, who retired in 2022, after playing his last Laver Cup. However, his massive deals with Uniqlo, Rolex, and Mercedes, as well as his stake in running company On, still keeps him towards the top of the these lists.
Together with Ronaldo and James, these three athletes are widely considered the face of their sport, undoubtedly helping them secure lucrative endorsements and business deals.

-

 Markets1 week ago
U.S. Debt Interest Payments Reach $1 Trillion
-

 Markets2 weeks ago
Ranked: The Most Valuable Housing Markets in America
-

 Money2 weeks ago
Which States Have the Highest Minimum Wage in America?
-

 AI2 weeks ago
Ranked: Semiconductor Companies by Industry Revenue Share
-

 Markets2 weeks ago
Ranked: The World’s Top Flight Routes, by Revenue
-

 Countries2 weeks ago
Population Projections: The World’s 6 Largest Countries in 2075
-

 Markets2 weeks ago
The Top 10 States by Real GDP Growth in 2023
-

 Money2 weeks ago
The Smallest Gender Wage Gaps in OECD Countries