Weathering Physical Climate Risks: A Guide for Financial Professionals
Weathering Physical Climate Risks
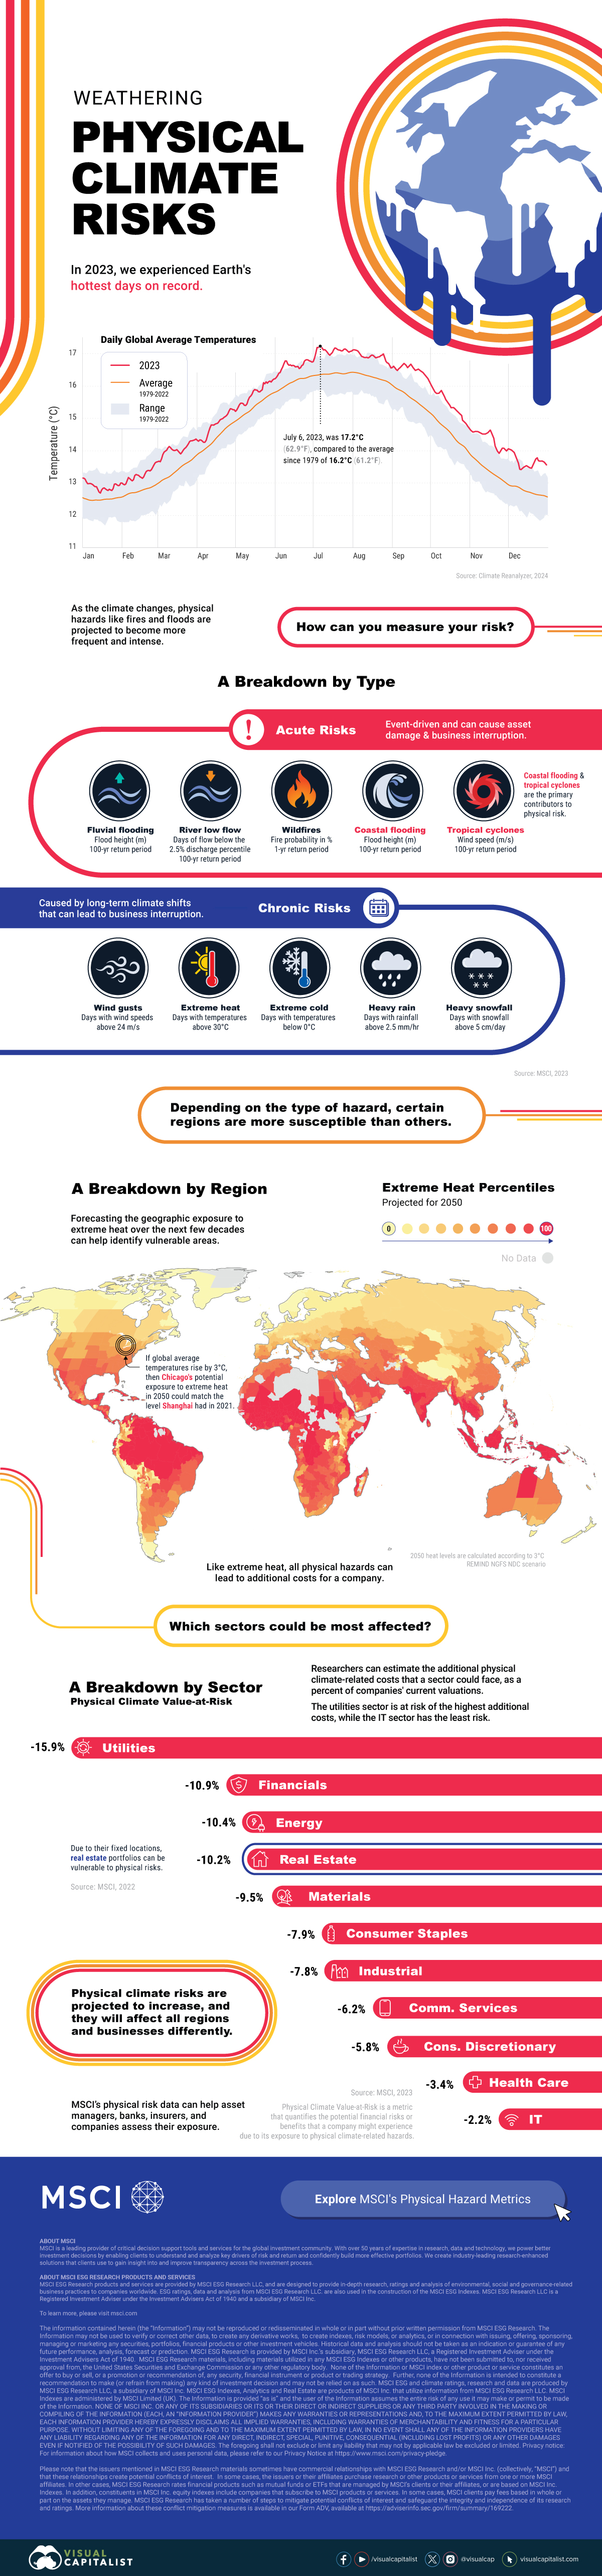
In 2023, we experienced Earth’s hottest days on record.
July had 21 of the hottest 30 days ever recorded. The hottest day, July 6, 2023, was 17.2℃ (62.9℉) compared to the average since 1979 of 16.2℃ (61.2℉).
How could a changing climate create climate risks for your company or portfolio? In this graphic from MSCI, we explore how you can measure your risk, along with the regions and sectors that could be most affected.
Types of Physical Hazards That Create Climate Risks
As the climate changes, scientists predict that physical hazards like fires and floods will become more frequent and intense. There are two types of hazards that lead to climate risks.
Events drive acute risks, which can cause business interruption and asset damage.
| Hazard | How it’s Measured |
|---|---|
| Fluvial flooding | Flood height (m) of a 100-year return period flood event |
| River low flow | Days of flow with less than 2.5% discharge of a 100-year return period |
| Wildfires | Fire probability in % of a 1-year return period |
| Coastal flooding | Flood height (m) of a 100-year return period flood event |
| Tropical cyclones | Wind speed (m/s) of a 100-year return period tropical cyclone |
On the other hand, long-term shifts drive chronic risks and can cause business interruption.
| Hazard | How it’s Measured |
|---|---|
| Wind gusts | Days with wind speeds above 24 m/s |
| Extreme heat | Days with temperatures above 30°C |
| Extreme cold | Days with temperatures below 0°C |
| Heavy rain | Days with rainfall above 2.5 mm/hr |
| Heavy snowfall | Days with snowfall above 5 cm/day |
Depending on the type of hazard, certain regions are more susceptible than others.
A Breakdown by Region
Forecasting the geographic exposure to extreme heat over the next few decades can help identify vulnerable areas.
Below, we show the 2050 projections for extreme heat percentiles for select areas. The projections assume a global average temperatures rise of 3℃. The higher an area’s number, the greater exposure to extreme heat.
| Area | Extreme Heat Percentiles, 2050P |
|---|---|
| 🇬🇧 London, UK | 11 |
| 🇨🇭 Zürich, Switzerland | 15 |
| 🇫🇷 Île-de-France, France (incl. Paris) | 23 |
| 🇩🇪 Berlin, Germany | 23 |
| 🇨🇦 Ontario, Canada (incl. Toronto) | 30 |
| 🇺🇸 New York, U.S. (incl. New York City) | 40 |
| 🇯🇵 Tokyo, Japan | 47 |
| 🇦🇺 New South Wales, Australia (incl. Sydney) | 47 |
| 🇨🇳 Shanghai, China | 61 |
| 🇮🇳 Maharashtra, India (incl. Mumbai) | 93 |
Select countries are the most heavily weighted in the MSCI ACWI IMI index. We selected the most populated cities within these countries.
Areas that are further north are generally projected to have lower exposure, but even these areas will not be immune to climate risks. For example, Chicago’s potential extreme heat exposure in 2050 could match the level Shanghai had in 2021 if global temperatures rise by 3℃.
Like extreme heat, all physical hazards can lead to additional costs for a company. But which sectors could be most affected?
A Breakdown by Sector
Research suggests that the utilities sector is at risk of the highest additional costs relative to company valuations, while the IT sector has the least risk.
| Sector | Physical Climate Value-at-Risk |
|---|---|
| Utilities | -15.9% |
| Financials | -10.9% |
| Energy | -10.4% |
| Real Estate | -10.2% |
| Materials | -9.5% |
| Consumer Staples | -7.9% |
| Industrial | -7.8% |
| Communication Services | -6.2% |
| Consumer Discretionary | -5.8% |
| Health Care | -3.4% |
| IT | -2.2% |
Physical Climate Value-at-Risk is a metric that quantifies the potential financial risks or benefits that a company might experience due to its exposure to physical climate-related hazards. It is measured as a percent of current company valuations.
Due to their fixed locations, real estate portfolios can also be vulnerable to physical risks.
Gauging Your Exposure to Physical Climate Risks
Scientists predict that physical climate risks will increase, and they will affect all regions and businesses differently.
MSCI’s physical risk data can help asset managers, banks, insurers, and companies assess their exposure.
Understand your risks with MSCI’s physical hazard metrics.

-

 Economy2 days ago
Economic Growth Forecasts for G7 and BRICS Countries in 2024
The IMF has released its economic growth forecasts for 2024. How do the G7 and BRICS countries compare?
-

 Markets1 week ago
U.S. Debt Interest Payments Reach $1 Trillion
U.S. debt interest payments have surged past the $1 trillion dollar mark, amid high interest rates and an ever-expanding debt burden.
-

 United States2 weeks ago
Ranked: The Largest U.S. Corporations by Number of Employees
We visualized the top U.S. companies by employees, revealing the massive scale of retailers like Walmart, Target, and Home Depot.
-

 Markets2 weeks ago
The Top 10 States by Real GDP Growth in 2023
This graphic shows the states with the highest real GDP growth rate in 2023, largely propelled by the oil and gas boom.
-

 Markets2 weeks ago
Ranked: The World’s Top Flight Routes, by Revenue
In this graphic, we show the highest earning flight routes globally as air travel continued to rebound in 2023.
-

 Markets3 weeks ago
Ranked: The Most Valuable Housing Markets in America
The U.S. residential real estate market is worth a staggering $47.5 trillion. Here are the most valuable housing markets in the country.