Ranked: Air Pollution by Economy

Ranked: Air Pollution by Economy
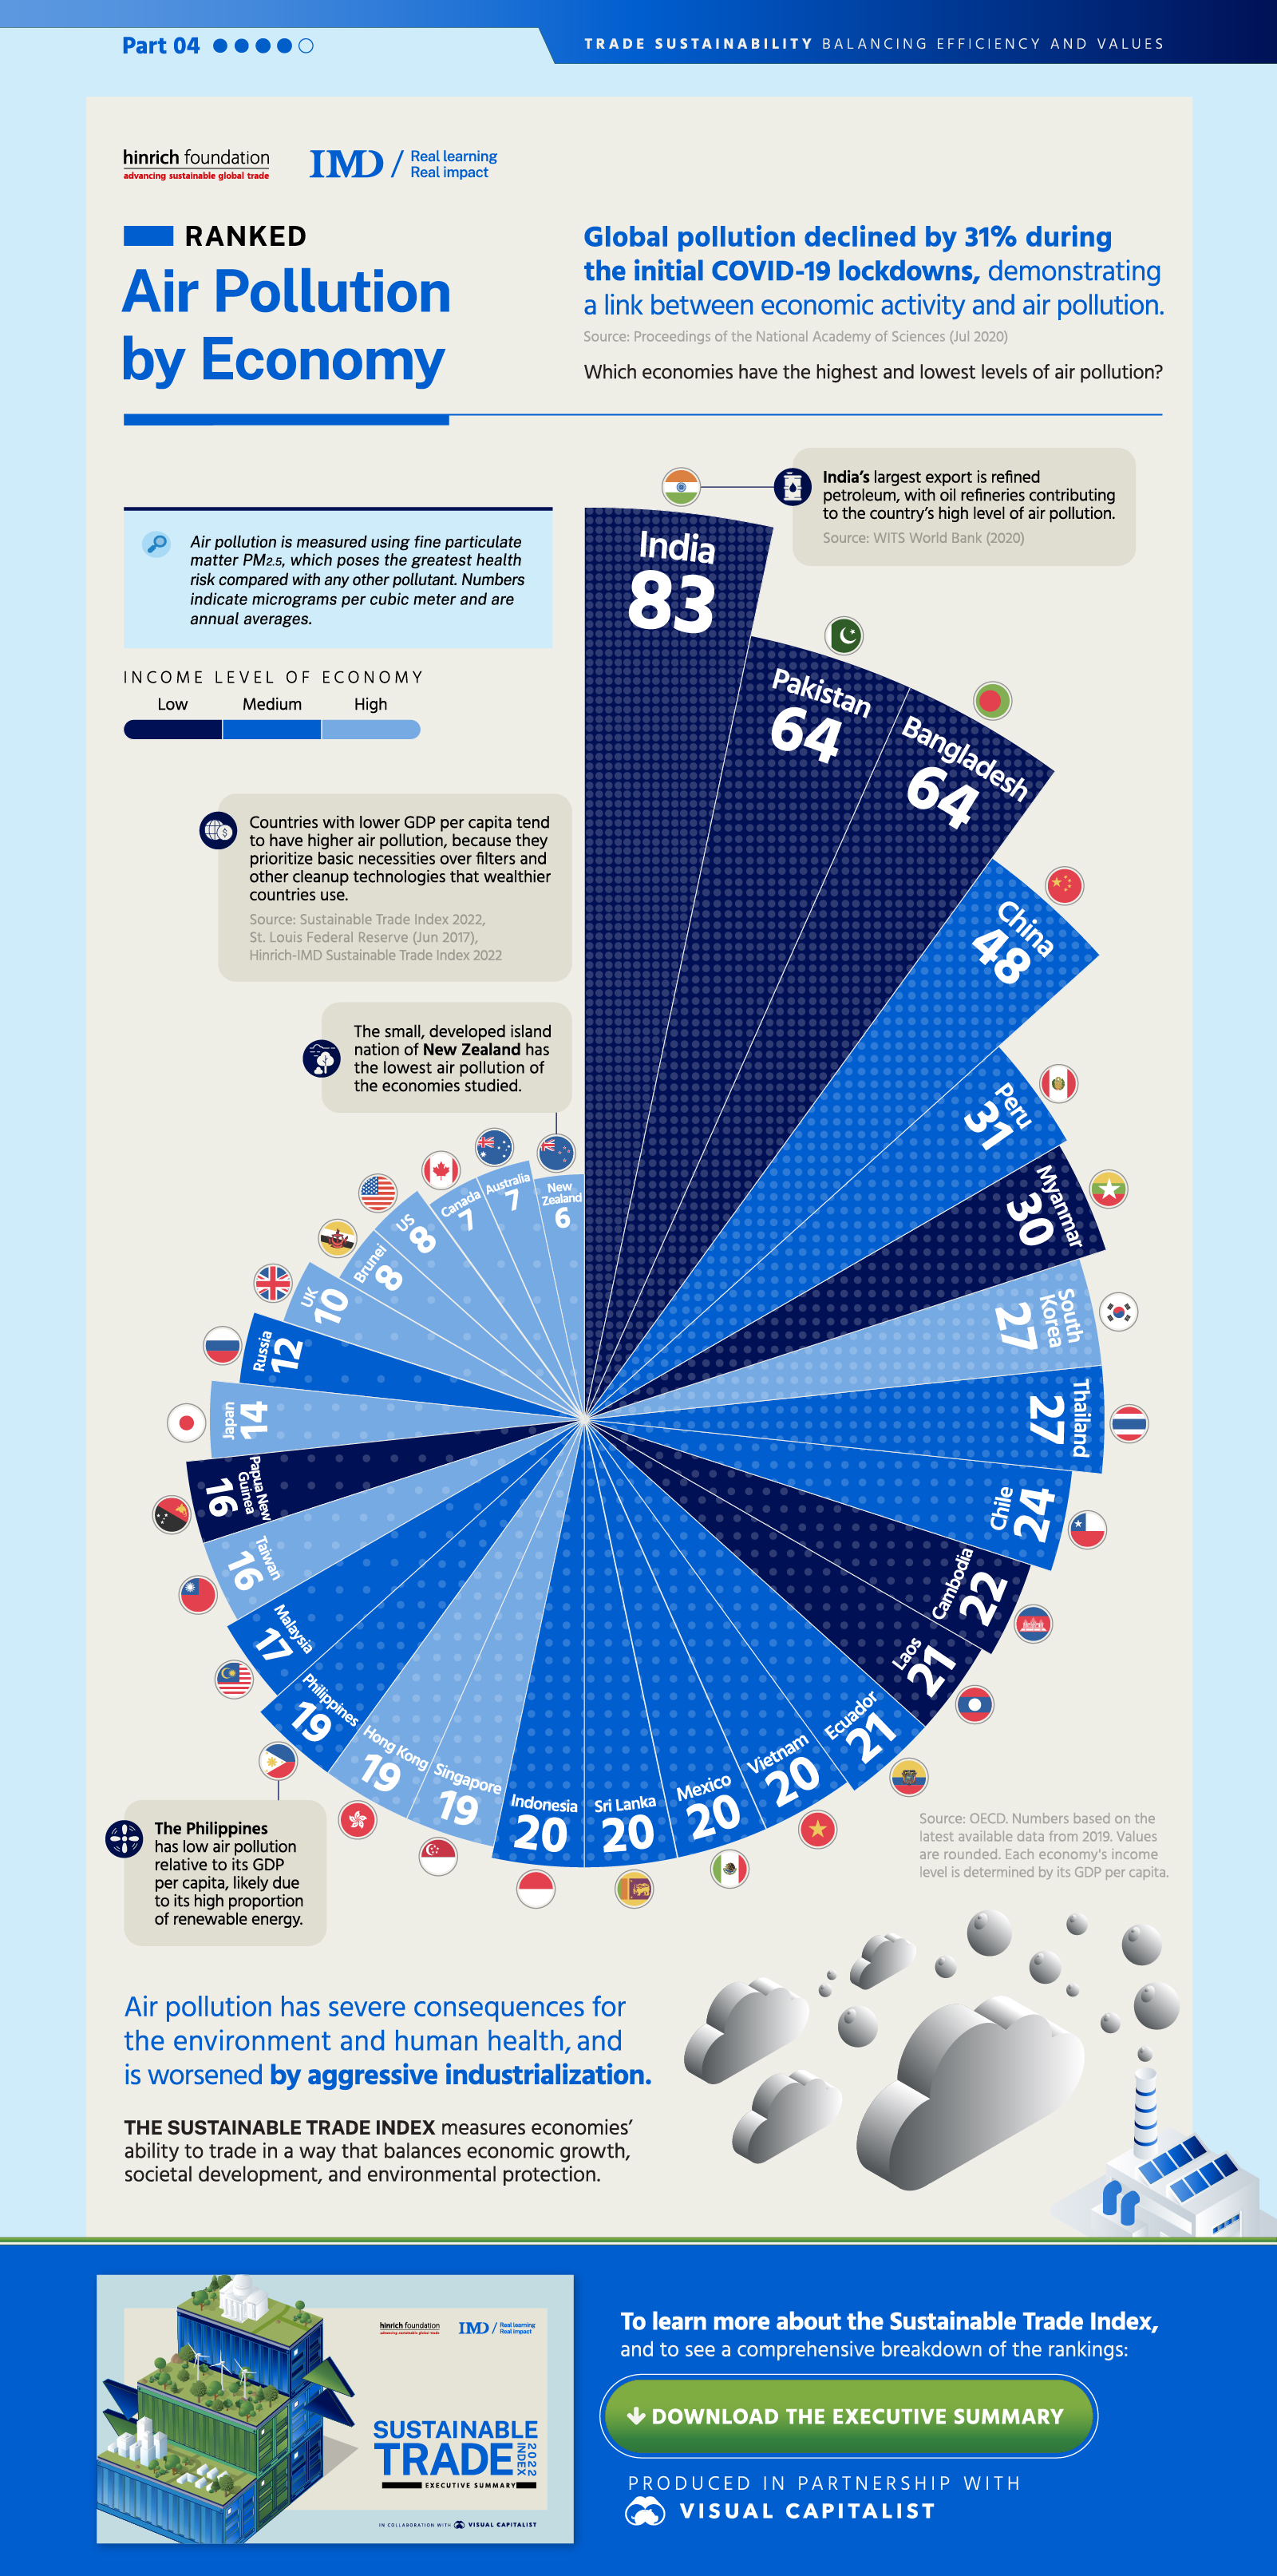
Global air pollution declined by 31% during the initial COVID-19 lockdowns, demonstrating a link between economic activity and air quality.
This graphic from The Hinrich Foundation, the fourth in a five-part series on the sustainability of trade, explores how air pollution varies by economy. It pulls data from the 2022 Sustainable Trade Index, which The Hinrich Foundation produced in collaboration with the IMD World Competitiveness Center.
What is Air Pollution?
In this dataset, air pollution is measured using fine particulate matter known as PM2.5. These particles are less than 2.5 microns in diameter, which is about 28 times smaller than the diameter of human hair. They are made up of things like combustion particles, compounds, and metals.
Not only does their presence cause the air to become hazy, they also pose the greatest health risk compared with any other pollutant. When they are inhaled into the lungs, they can cause respiratory diseases and even death. In fact, air pollution is one of the world’s leading risk factors for death, and is linked to 12% of deaths globally.
A Geographic Breakdown of Pollution
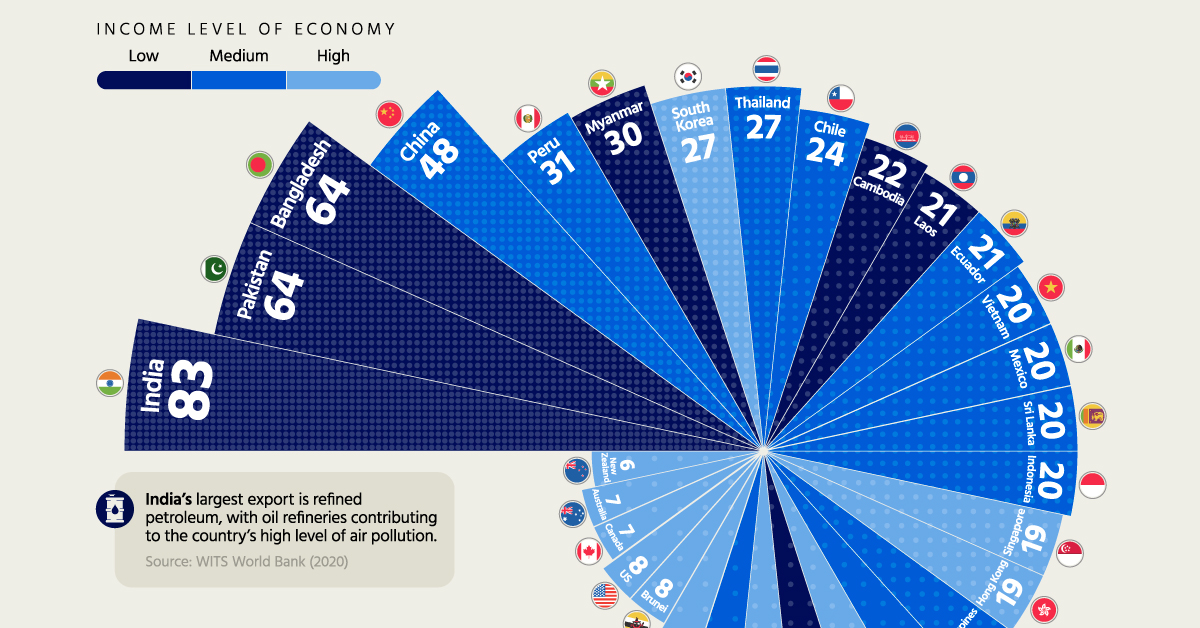
Air pollution levels have a wide spectrum around the world. Countries with lower GDP per capita tend to have higher pollution because they have less stringent air quality regulations, congested transportation systems, and rapidly developing industrial sectors. They also prioritize basic necessities such as food and shelter. On the other hand, high income economies can afford cleanup technologies such as filters that trap airborne particles.
The following table shows how air pollution breaks down for select economies that are covered in the 2022 Sustainable Trade Index. Numbers indicate micrograms of PM2.5 particles per cubic meter, with higher numbers indicating more pollution.
| Rank | Economy | PM2.5 per Cubic Meter | Income Level of Economy |
|---|---|---|---|
| 1 | 🇳🇿 New Zealand | 6 | High |
| 2 | 🇦🇺 Australia | 7 | High |
| 3 | 🇨🇦 Canada | 7 | High |
| 4 | 🇺🇸 United States | 8 | High |
| 5 | 🇧🇳 Brunei | 8 | High |
| 6 | 🇬🇧 United Kingdom | 10 | High |
| 7 | 🇷🇺 Russia | 12 | Medium |
| 8 | 🇯🇵 Japan | 14 | High |
| 9 | 🇵🇬 Papua New Guinea | 16 | Low |
| 10 | 🇹🇼 Taiwan | 16 | High |
| 11 | 🇲🇾 Malaysia | 17 | Medium |
| 12 | 🇵🇭 Philippines | 19 | Medium |
| 13 | 🇭🇰 Hong Kong | 19 | High |
| 14 | 🇸🇬 Singapore | 19 | High |
| 15 | 🇮🇩 Indonesia | 20 | Medium |
| 16 | 🇱🇰 Sri Lanka | 20 | Medium |
| 17 | 🇲🇽 Mexico | 20 | Medium |
| 18 | 🇻🇳 Vietnam | 20 | Medium |
| 19 | 🇪🇨 Ecuador | 21 | Medium |
| 20 | 🇱🇦 Laos | 21 | Low |
| 21 | 🇰🇭 Cambodia | 22 | Low |
| 22 | 🇨🇱 Chile | 24 | Medium |
| 23 | 🇹🇭 Thailand | 27 | Medium |
| 24 | 🇰🇷 South Korea | 27 | High |
| 25 | 🇲🇲 Myanmar | 30 | Low |
| 26 | 🇵🇪 Peru | 31 | Medium |
| 27 | 🇨🇳 China | 48 | Medium |
| 28 | 🇧🇩 Bangladesh | 64 | Low |
| 29 | 🇵🇰 Pakistan | 64 | Low |
| 30 | 🇮🇳 India | 83 | Low |
India has the most polluted air of the economies in the Sustainable Trade Index. As a developing country with a large population, there are multiple contributing factors. For instance, agricultural burning, biomass combustion for cooking, and vehicle emissions all worsen the problem. The country is also the second-largest consumer of coal, and lacks tight emission standards on industries such as metal smelters and oil refineries.
The Philippines has low air pollution relative to its GDP per capita. This could be because 34% of its energy comes from renewable sources. Notably, the Philippines has the third-highest geothermal power capacity in the world. However, the country still faces considerable pollution issues, primarily due to vehicle emissions.
Want more insights into trade sustainability?
Download the 2022 Sustainable Trade Index for free.
New Zealand has the least polluted air of the economies in the index. Its good air quality is thanks in part to its low population density and island geography. The country is also impacted by large scale wind patterns which promote westerly winds and aid in pollutant dispersion. In order to further reduce pollutants, New Zealand is requiring vehicles to meet stricter emission standards.
Economic Activity and Air Pollution
Air pollution has severe consequences for the environment and human health. It is worsened by aggressive industrialization and some commercial activities. In fact, it’s estimated that industry accounts for 12% of PM2.5 particles globally. Industrial dust, energy production, and transportation are also significant contributors.
Of course, air pollution is just one variable that can help determine an economy’s trade sustainability. The Sustainable Trade Index uses a number of other metrics to measure economies’ ability to trade in a way that balances economic growth, societal development, and environmental protection. To learn more, visit the STI landing page where you can download the report for free.
The fifth piece in this series will introduce an upcoming report on the state of global carbon markets.

-

 Green3 days ago
Ranking the Top 15 Countries by Carbon Tax Revenue
This graphic highlights France and Canada as the global leaders when it comes to generating carbon tax revenue.
-

 Green4 days ago
Ranked: The Countries With the Most Air Pollution in 2023
South Asian nations are the global hotspot for pollution. In this graphic, we rank the world’s most polluted countries according to IQAir.
-

 Environment7 days ago
Top Countries By Forest Growth Since 2001
One country is taking reforestation very seriously, registering more than 400,000 square km of forest growth in two decades.
-

 Green2 weeks ago
Ranked: Top Countries by Total Forest Loss Since 2001
The country with the most forest loss since 2001 lost as much forest cover as the next four countries combined.
-

 Markets2 months ago
The World’s Top Cocoa Producing Countries
Here are the largest cocoa producing countries globally—from Côte d’Ivoire to Brazil—as cocoa prices hit record highs.
-

 Environment2 months ago
Charted: Share of World Forests by Country
We visualize which countries have the biggest share of world forests by area—and while country size plays a factor, so too, does the environment.