Conflicts of Interest Among Financial Advisory Firms
Conflicts of Interest Among Financial Advisory Firms
Can you trust your financial advisor? While the majority of advisory firms are always acting in their clients’ best interests, that’s not the case for all firms.
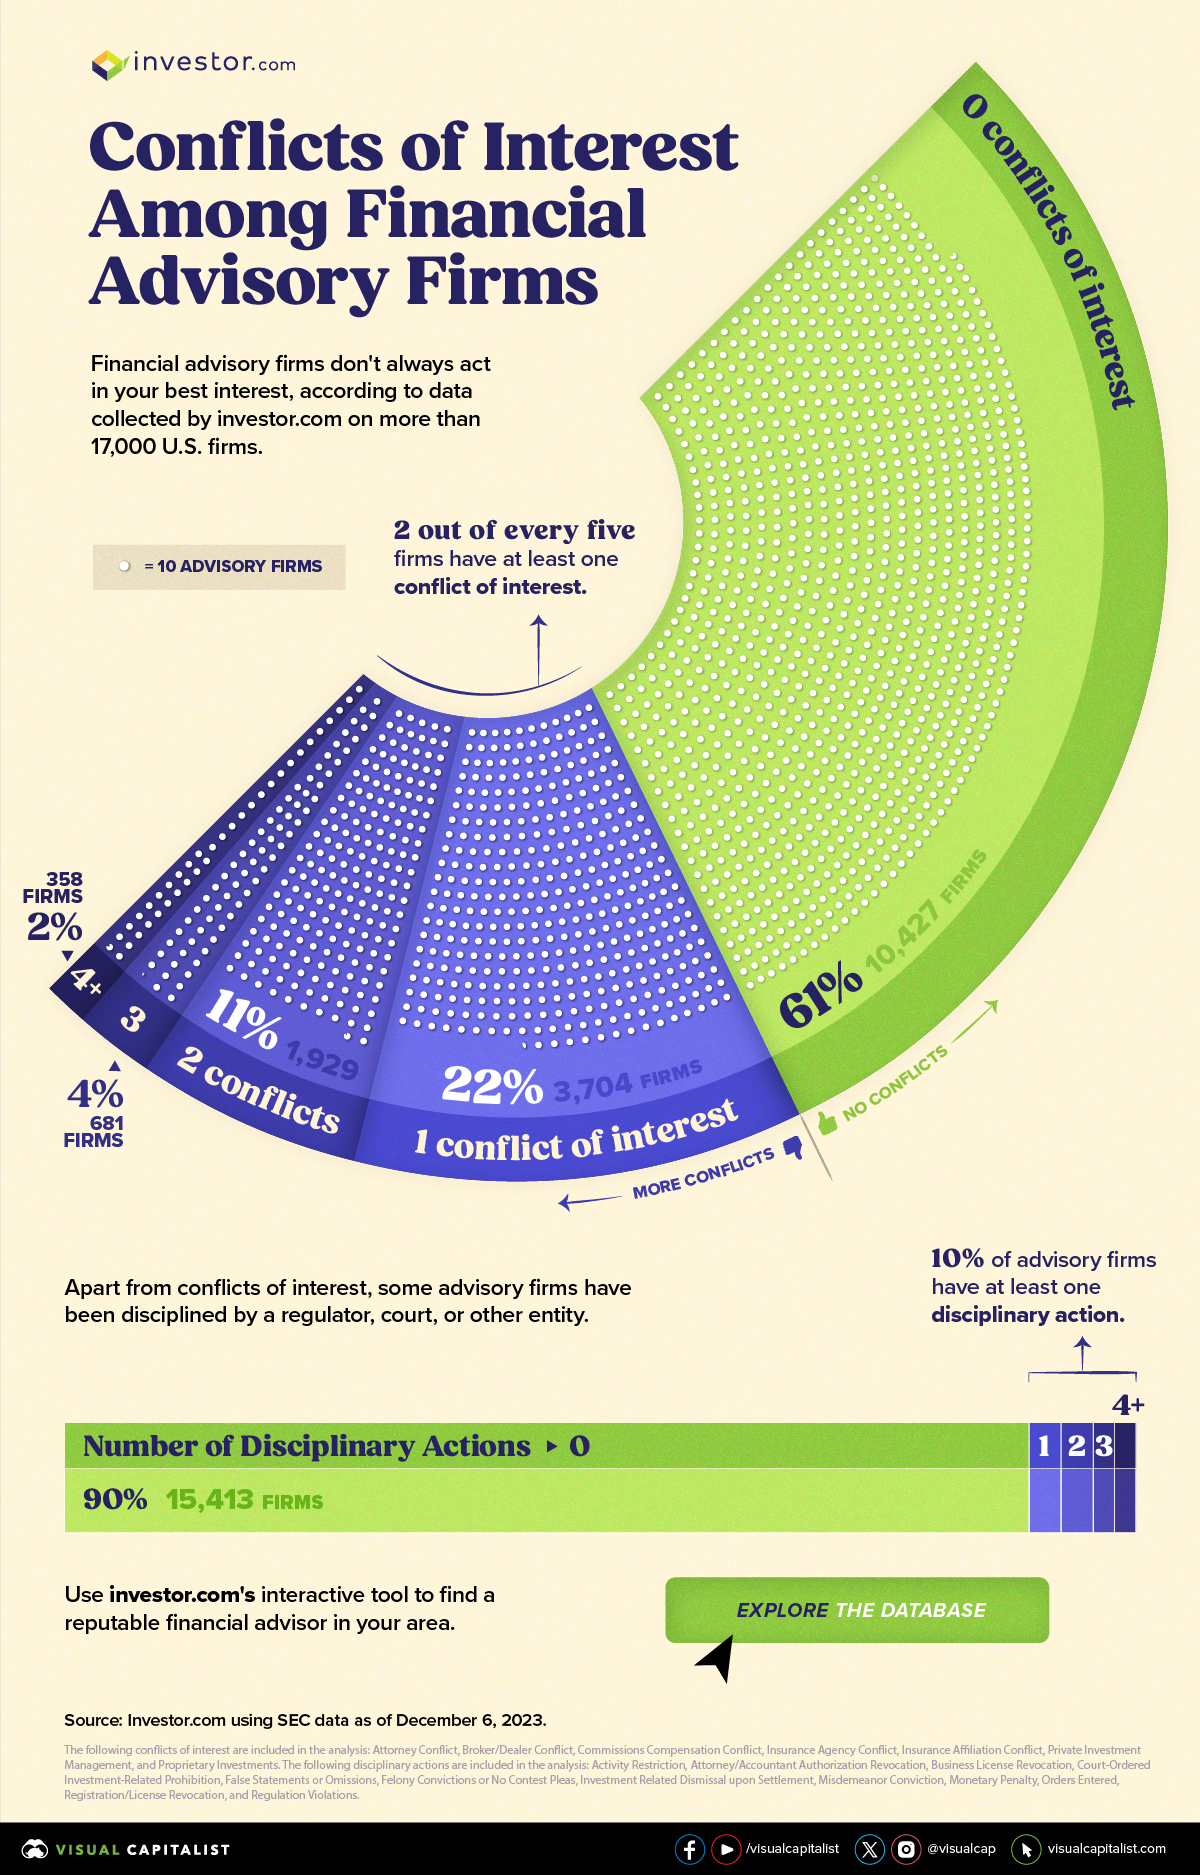
In this graphic from investor.com, we explore how common conflicts of interest are among U.S. advisory firms.
The Prevalence of Conflicts of Interest
According to data on more than 17,000 U.S. firms, two out of every five firms have at least one conflict of interest.
| Number of Conflicts of Interest | Number of Advisory Firms | Percent of Advisory Firms |
|---|---|---|
| 0 conflicts | 10,427 | 61% |
| 1 conflict | 3,704 | 22% |
| 2 conflicts | 1,929 | 11% |
| 3 conflicts | 681 | 4% |
| 4+ conflicts | 358 | 2% |
Source: investor.com analysis using SEC data as of December 6, 2023. The following conflicts of interest are included in the analysis: Attorney Conflict, Broker/Dealer Conflict, Commissions Compensation Conflict, Insurance Agency Conflict, Insurance Affiliation Conflict, Private Investment Management, and Proprietary Investments.
The most common conflicts of interest are when a firm acts as an insurance agent or is affiliated with an insurance agent. In these situations, an agent may be motivated to insure clients with high-commission products when lower-cost options may exist.
Following these two, the third most common conflict of interest happens when firms are both the broker and dealer. Firms that are broker-dealers, which buy and sell investments for clients and their own account, are not always required to put your best interests above their own. This means you could end up paying hidden fees or overall costs that are higher than necessary.
The Prevalence of Disciplinary Actions
Apart from conflicts of interest, some advisory firms have been disciplined by a regulator, court, or other entity. Notably, 10% of firms have at least one disciplinary action.
| Number of Disciplinary Actions | Number of Advisory Firms | Percent of Advisory Firms |
|---|---|---|
| 0 Disciplinary Actions | 15,413 | 90% |
| 1 Disciplinary Actions | 541 | 3% |
| 2 Disciplinary Actions | 509 | 3% |
| 3 Disciplinary Actions | 300 | 2% |
| 4+ Disciplinary Actions | 336 | 2% |
Source: investor.com analysis using SEC data as of December 6, 2023. The following disciplinary actions are included in the analysis: Activity Restriction, Attorney/Accountant Authorization Revocation, Business License Revocation, Court-Ordered Investment-Related Prohibition, False Statements or Omissions, Felony Convictions or No Contest Pleas, Investment Related Dismissal upon Settlement, Misdemeanor Conviction, Monetary Penalty, Orders Entered, Registration/License Revocation, and Regulation Violations.
The most common disciplinary actions are regulations violations, meaning a financial advisory firm has violated the rules of a regulator.
Ranking second in terms of frequency is orders entered, where a regulator enters an order against a firm or its affiliate for an investment-related activity. Orders force firms to do certain things like cease and desist rule violations, audit internal processes, or pay penalties. The Securities and Exchange Commission (SEC) alone ordered nearly $5 billion in financial remedies to be paid in fiscal 2023.
How to Find a Financial Advisor
With all of this in mind, it’s important to do your research and find an advisor you can trust. Check if an advisor has any conflicts of interest or a history of disciplinary action.
You can also check if they are a fiduciary in all their dealings with you, which means the advisor is always required to act in your best interests—unlike broker-dealers.
To simplify the task of finding a reliable financial advisor, investor.com has developed a powerful tool. Every month, they run the most recent SEC data on more than 17,000 firms through their trust algorithm. They use criteria like conflicts of interest and disciplinary action to assign a star rating for each company and identify the top firms.

Use investor.com’s interactive tool to find the most reputable financial advisors in your area.

-

 Investor Education6 months ago
The 20 Most Common Investing Mistakes, in One Chart
Here are the most common investing mistakes to avoid, from emotionally-driven investing to paying too much in fees.
-

 Stocks10 months ago
Visualizing BlackRock’s Top Equity Holdings
BlackRock is the world’s largest asset manager, with over $9 trillion in holdings. Here are the company’s top equity holdings.
-

 Investor Education11 months ago
10-Year Annualized Forecasts for Major Asset Classes
This infographic visualizes 10-year annualized forecasts for both equities and fixed income using data from Vanguard.
-

 Investor Education1 year ago
Visualizing 90 Years of Stock and Bond Portfolio Performance
How have investment returns for different portfolio allocations of stocks and bonds compared over the last 90 years?
-

 Debt2 years ago
Countries with the Highest Default Risk in 2022
In this infographic, we examine new data that ranks the top 25 countries by their default risk.
-

 Markets2 years ago
The Best Months for Stock Market Gains
This infographic analyzes over 30 years of stock market performance to identify the best and worst months for gains.

