

We chart the ever-widening gap between median incomes and the median price of houses in America, using data from the Federal Reserve from 1984 to 2022.


Wealth distribution in America is becoming increasingly unequal, with the wealth held by the top 0.1% reaching its highest level on record.
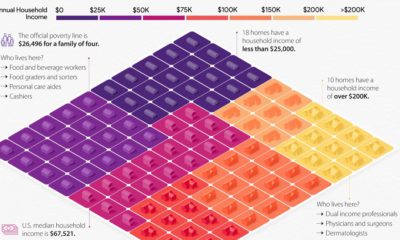

This visual breaks down U.S. household income categories as 100 homes, based on the most recent data from the U.S. Census Bureau.
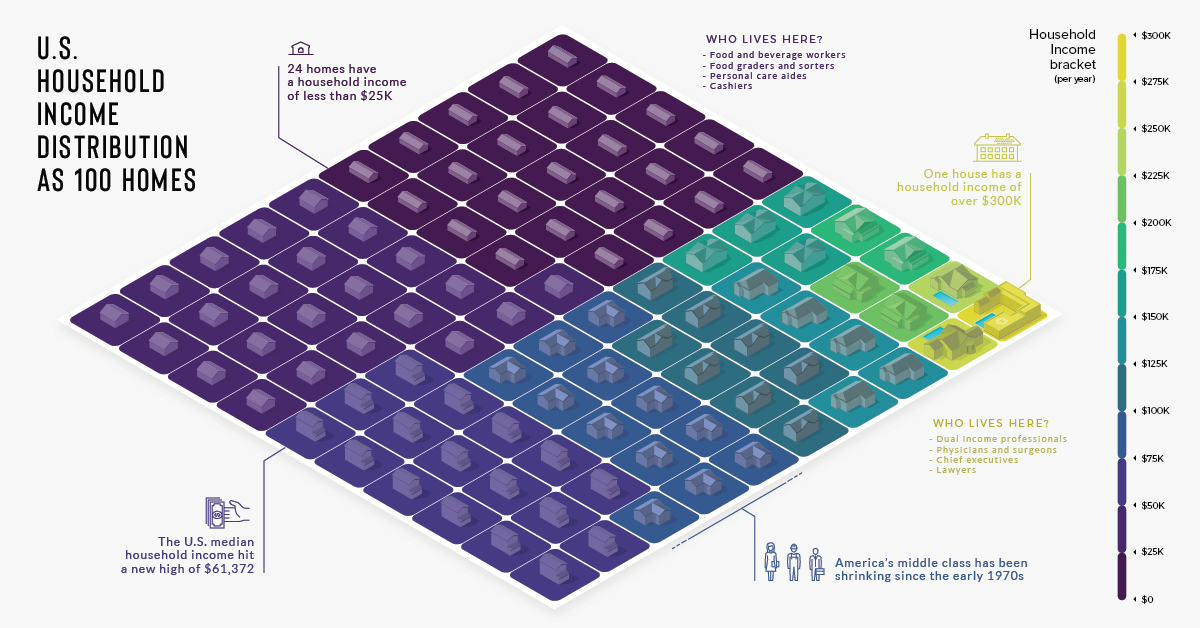
There are over 125 million households in the U.S., each with varying incomes. He's how they look distilled down into a visualization of 100 homes.
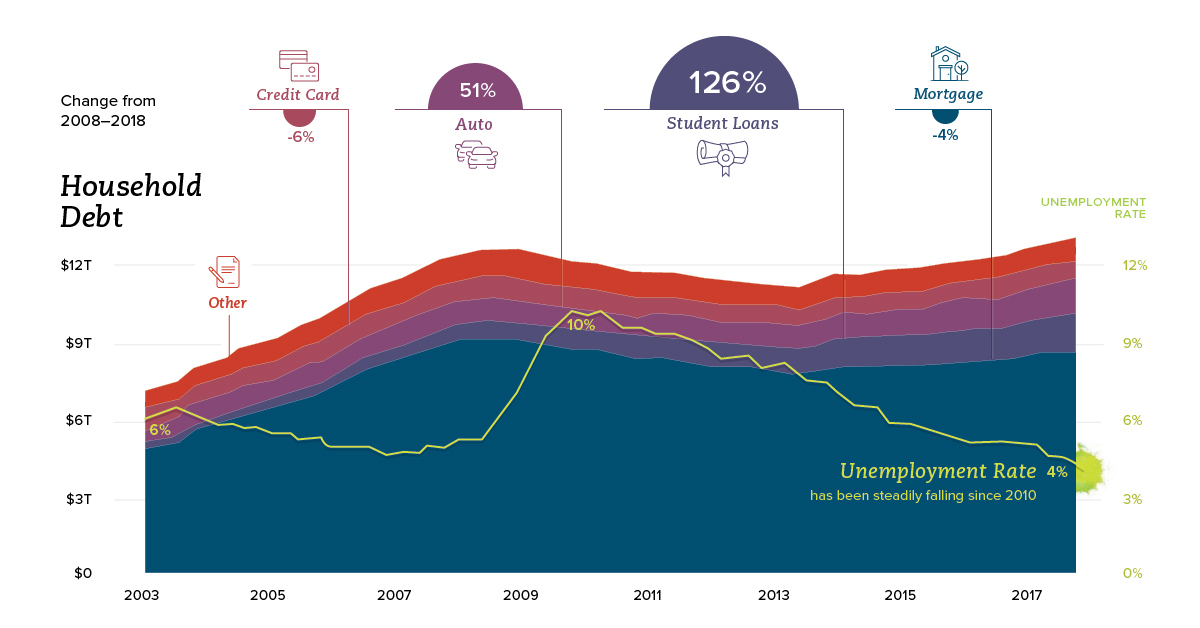
How are American household finances shifting in terms of income, savings, debt, and spending? This series of charts shows the trends you need to know.
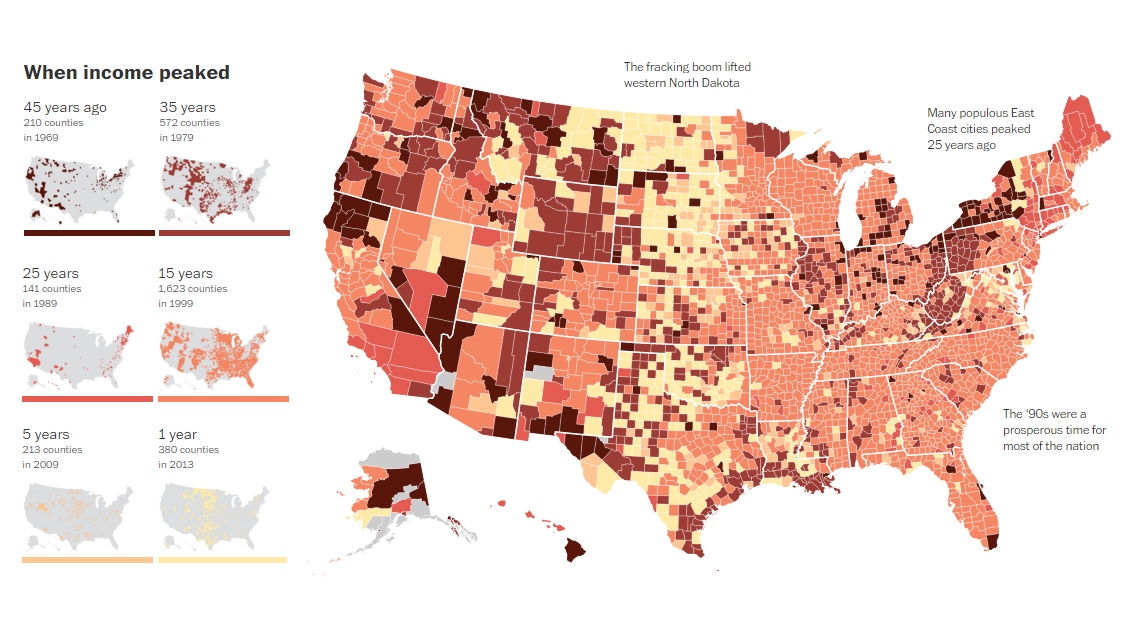
This map visualizes when the household median incomes of U.S. counties reached "peak income". For more than 80% of counties, this was over 15 years ago.


