Energy
Visualizing the World’s Largest Lithium Producers
![]() Subscribe to the Elements free mailing list for more like this
Subscribe to the Elements free mailing list for more like this


Visualizing the World’s Largest Lithium Producers in 2022
This was originally posted on Elements. Sign up to the free mailing list to get beautiful visualizations on real assets and resource megatrends each week.
Lithium has become essential in recent years, primarily due to the boom in electric vehicles and other clean technologies that rely on lithium batteries.
The global lithium-ion battery market was valued at $52 billion in 2022 and is expected to reach $194 billion in 2030.
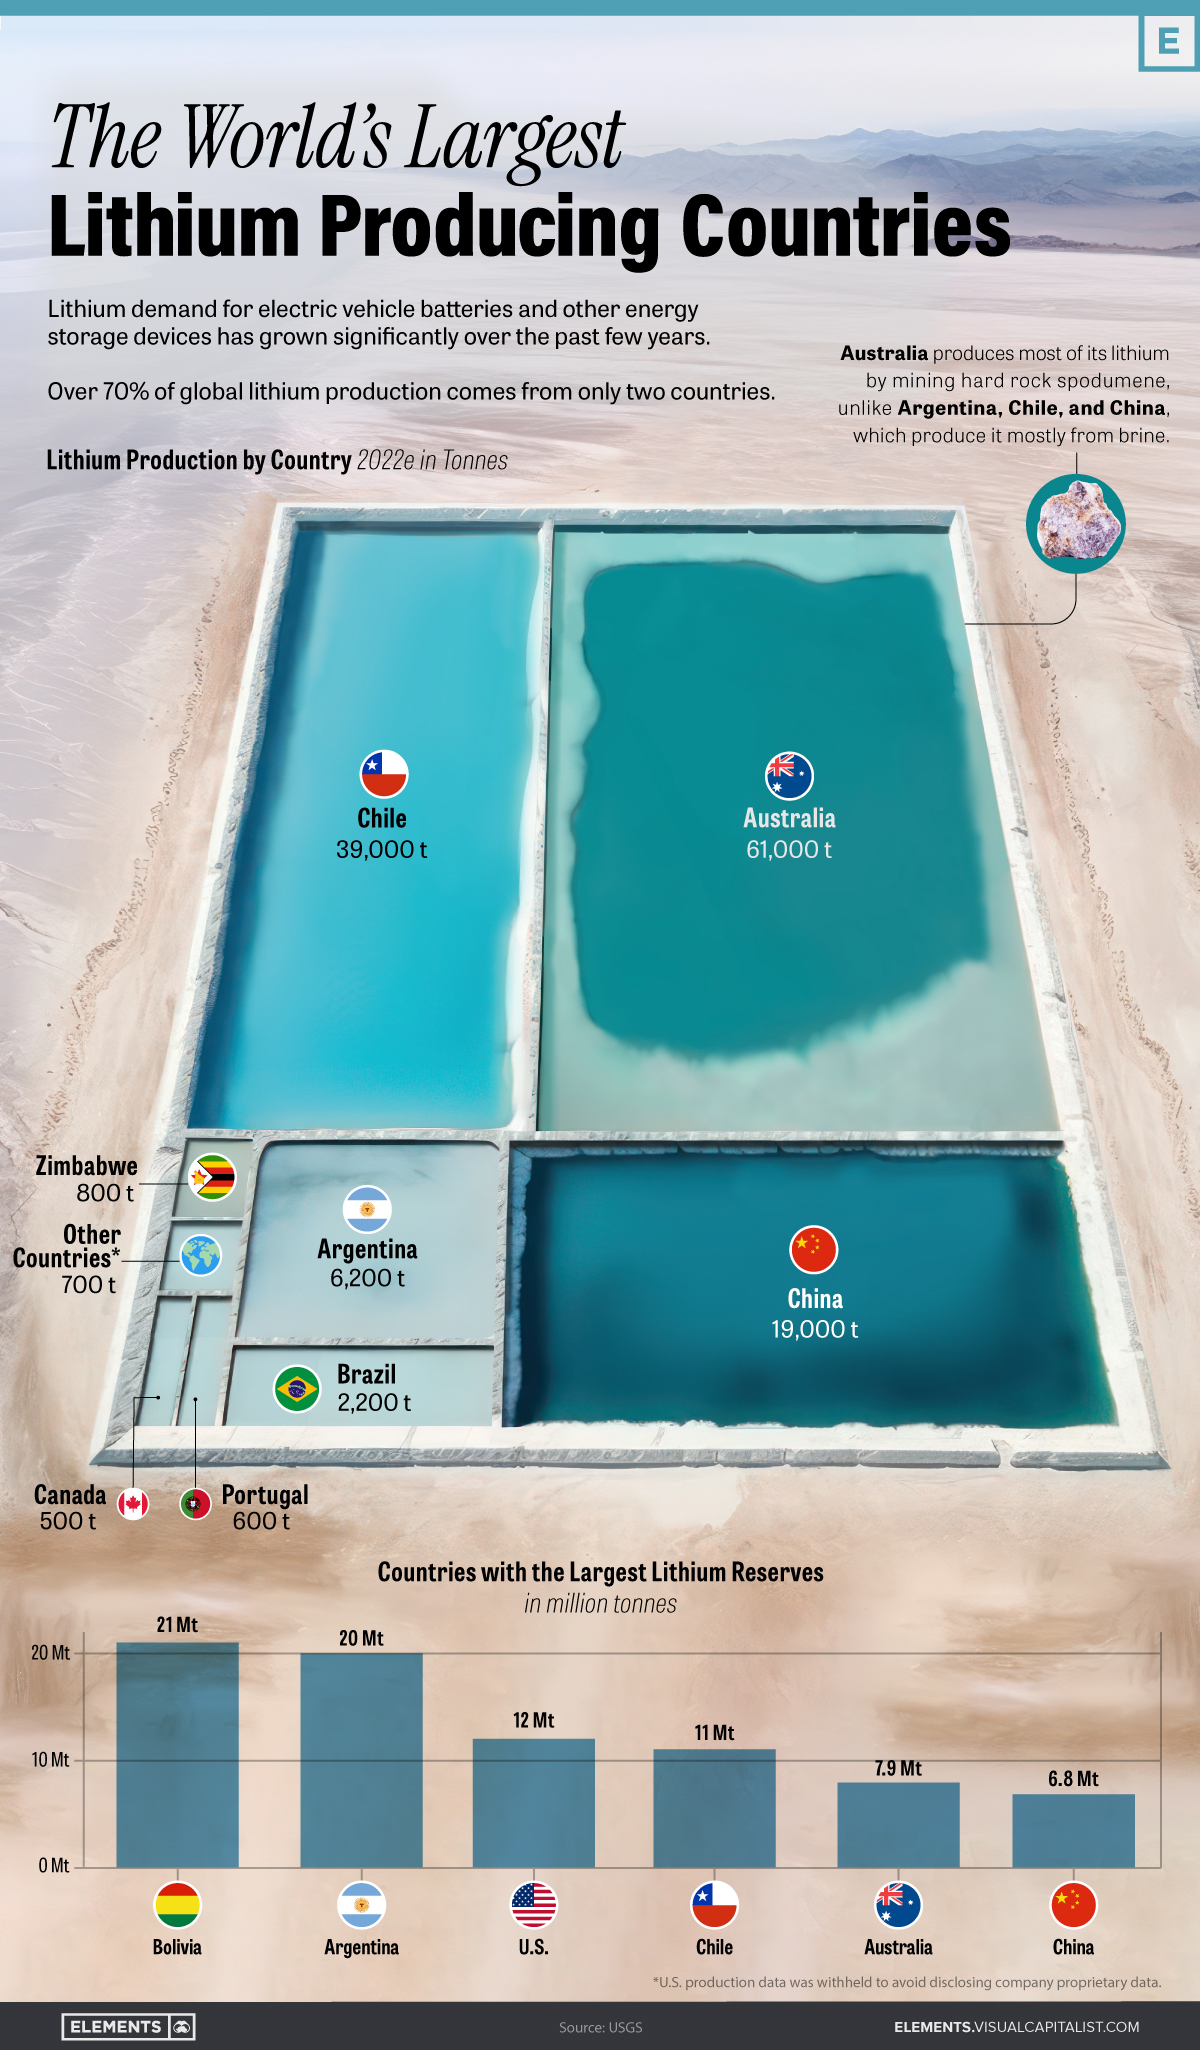
The infographic above uses data from the United States Geological Survey to explore the world’s largest lithium producing countries.
Australia and Chile: Dominating Global Lithium Supply
Australia and Chile stand out as the top producers of lithium, accounting for almost 77% of the global production in 2022.
| Rank | Country | Mine production 2022E (tonnes) | Share (%) |
|---|---|---|---|
| 1 | 🇦🇺 Australia | 61,000 | 46.9% |
| 2 | 🇨🇱 Chile | 39,000 | 30.0% |
| 3 | 🇨🇳 China | 19,000 | 14.6% |
| 4 | 🇦🇷 Argentina | 6,200 | 4.8% |
| 5 | 🇧🇷 Brazil | 2,200 | 1.7% |
| 6 | 🇿🇼 Zimbabwe | 800 | 0.6% |
| 7 | 🇵🇹 Portugal | 600 | 0.5% |
| 8 | 🇨🇦 Canada | 500 | 0.4% |
| 🌎 Other countries* | 700 | 0.5% | |
| 🌐 World Total | 130,000 | 100.0% |
*U.S. production data was withheld to avoid disclosing proprietary company data
Australia, the world’s leading producer, extracts lithium directly from hard rock mines, specifically the mineral spodumene.
Chile, along with Argentina, China, and other top producers, extracts lithium from brine.
Hard rock provides greater flexibility as lithium hosted in spodumene can be processed into either lithium hydroxide or lithium carbonate. It also offers faster processing and higher quality as spodumene typically contains higher lithium content.
Extracting lithium from brine, on the other hand, offers the advantage of lower production costs and a smaller impact on the environment. The following visual from Benchmark Minerals helps break down the carbon impact of different types of lithium extraction.
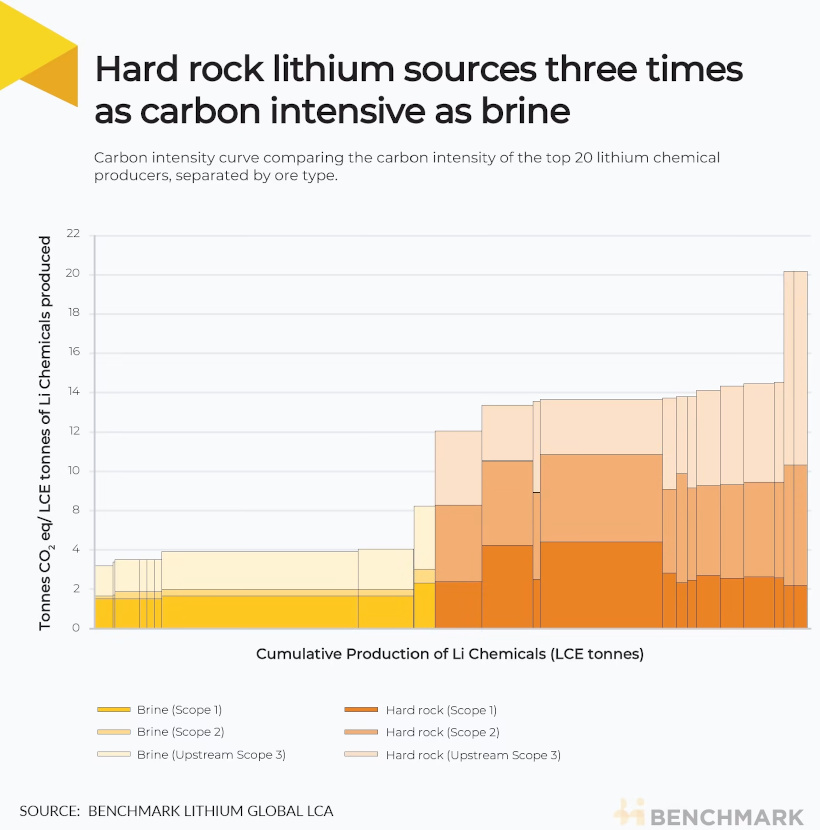
With that said, brine extraction can also face challenges related to water availability and environmental impacts on local ecosystems.
Historical Shifts in the Lithium Supply Chain
In the 1990s, the United States held the title of the largest lithium producer, producing over one-third of the global production in 1995.
However, Chile eventually overtook the U.S., experiencing a production boom in the Salar de Atacama, one of the world’s richest lithium brine deposits. Since then, Australia’s lithium production has also skyrocketed, now accounting for 47% of the world’s lithium production.
China, the world’s third-largest producer, not only focuses on developing domestic mines but has also strategically acquired approximately $5.6 billion worth of lithium assets in countries like Chile, Canada, and Australia over the past decade.
Furthermore, China currently hosts nearly 60% of the world’s lithium refining capacity for batteries, underlining its dominant position in the lithium supply chain.
Meeting Lithium Demand: The Need for New Production
As the world increases its production of batteries and electric vehicles, the demand for lithium is projected to soar.
In 2021, global lithium carbonate equivalent (LCE) production sat at 540,000 tonnes.
By 2025, demand is expected to reach 1.5 million tonnes of LCE. By 2030, this number is estimated to exceed 3 million tonnes.


Energy
Charted: 4 Reasons Why Lithium Could Be the Next Gold Rush
Visual Capitalist has partnered with EnergyX to show why drops in prices and growing demand may make now the right time to invest in lithium.


4 Reasons Why You Should Invest in Lithium
Lithium’s importance in powering EVs makes it a linchpin of the clean energy transition and one of the world’s most precious minerals.
In this graphic, Visual Capitalist partnered with EnergyX to explore why now may be the time to invest in lithium.
1. Lithium Prices Have Dropped
One of the most critical aspects of evaluating an investment is ensuring that the asset’s value is higher than its price would indicate. Lithium is integral to powering EVs, and, prices have fallen fast over the last year:
| Date | LiOH·H₂O* | Li₂CO₃** |
|---|---|---|
| Feb 2023 | $76 | $71 |
| March 2023 | $71 | $61 |
| Apr 2023 | $43 | $33 |
| May 2023 | $43 | $33 |
| June 2023 | $47 | $45 |
| July 2023 | $44 | $40 |
| Aug 2023 | $35 | $35 |
| Sept 2023 | $28 | $27 |
| Oct 2023 | $24 | $23 |
| Nov 2023 | $21 | $21 |
| Dec 2023 | $17 | $16 |
| Jan 2024 | $14 | $15 |
| Feb 2024 | $13 | $14 |
Note: Monthly spot prices were taken as close to the 14th of each month as possible.
*Lithium hydroxide monohydrate MB-LI-0033
**Lithium carbonate MB-LI-0029
2. Lithium-Ion Battery Prices Are Also Falling
The drop in lithium prices is just one reason to invest in the metal. Increasing economies of scale, coupled with low commodity prices, have caused the cost of lithium-ion batteries to drop significantly as well.
In fact, BNEF reports that between 2013 and 2023, the price of a Li-ion battery dropped by 82%.
| Year | Price per KWh |
|---|---|
| 2023 | $139 |
| 2022 | $161 |
| 2021 | $150 |
| 2020 | $160 |
| 2019 | $183 |
| 2018 | $211 |
| 2017 | $258 |
| 2016 | $345 |
| 2015 | $448 |
| 2014 | $692 |
| 2013 | $780 |

3. EV Adoption is Sustainable
One of the best reasons to invest in lithium is that EVs, one of the main drivers behind the demand for lithium, have reached a price point similar to that of traditional vehicle.
According to the Kelly Blue Book, Tesla’s average transaction price dropped by 25% between 2022 and 2023, bringing it in line with many other major manufacturers and showing that EVs are a realistic transport option from a consumer price perspective.
| Manufacturer | September 2022 | September 2023 |
|---|---|---|
| BMW | $69,000 | $72,000 |
| Ford | $54,000 | $56,000 |
| Volkswagon | $54,000 | $56,000 |
| General Motors | $52,000 | $53,000 |
| Tesla | $68,000 | $51,000 |
4. Electricity Demand in Transport is Growing
As EVs become an accessible transport option, there’s an investment opportunity in lithium. But possibly the best reason to invest in lithium is that the IEA reports global demand for the electricity in transport could grow dramatically by 2030:
| Transport Type | 2022 | 2025 | 2030 |
|---|---|---|---|
| Buses 🚌 | 23,000 GWh | 50,000 GWh | 130,000 GWh |
| Cars 🚙 | 65,000 GWh | 200,000 GWh | 570,000 GWh |
| Trucks 🛻 | 4,000 GWh | 15,000 GWh | 94,000 GWh |
| Vans 🚐 | 6,000 GWh | 16,000 GWh | 72,000 GWh |
The Lithium Investment Opportunity
Lithium presents a potentially classic investment opportunity. Lithium and battery prices have dropped significantly, and recently, EVs have reached a price point similar to other vehicles. By 2030, the demand for clean energy, especially in transport, will grow dramatically.
With prices dropping and demand skyrocketing, now is the time to invest in lithium.
EnergyX is poised to exploit lithium demand with cutting-edge lithium extraction technology capable of extracting 300% more lithium than current processes.

-

 Lithium5 days ago
Ranked: The Top 10 EV Battery Manufacturers in 2023
Asia dominates this ranking of the world’s largest EV battery manufacturers in 2023.
-

 Energy1 week ago
The World’s Biggest Nuclear Energy Producers
China has grown its nuclear capacity over the last decade, now ranking second on the list of top nuclear energy producers.
-

 Energy1 month ago
The World’s Biggest Oil Producers in 2023
Just three countries accounted for 40% of global oil production last year.
-

 Energy1 month ago
How Much Does the U.S. Depend on Russian Uranium?
Currently, Russia is the largest foreign supplier of nuclear power fuel to the U.S.
-

 Uranium2 months ago
Charted: Global Uranium Reserves, by Country
We visualize the distribution of the world’s uranium reserves by country, with 3 countries accounting for more than half of total reserves.
-

 Energy3 months ago
Visualizing the Rise of the U.S. as Top Crude Oil Producer
Over the last decade, the United States has established itself as the world’s top producer of crude oil, surpassing Saudi Arabia and Russia.

-

 Debt1 week ago
How Debt-to-GDP Ratios Have Changed Since 2000
-

 Countries2 weeks ago
Population Projections: The World’s 6 Largest Countries in 2075
-

 Markets2 weeks ago
The Top 10 States by Real GDP Growth in 2023
-

 Demographics2 weeks ago
The Smallest Gender Wage Gaps in OECD Countries
-

 United States2 weeks ago
Where U.S. Inflation Hit the Hardest in March 2024
-

 Green2 weeks ago
Top Countries By Forest Growth Since 2001
-

 United States2 weeks ago
Ranked: The Largest U.S. Corporations by Number of Employees
-

 Maps2 weeks ago
The Largest Earthquakes in the New York Area (1970-2024)