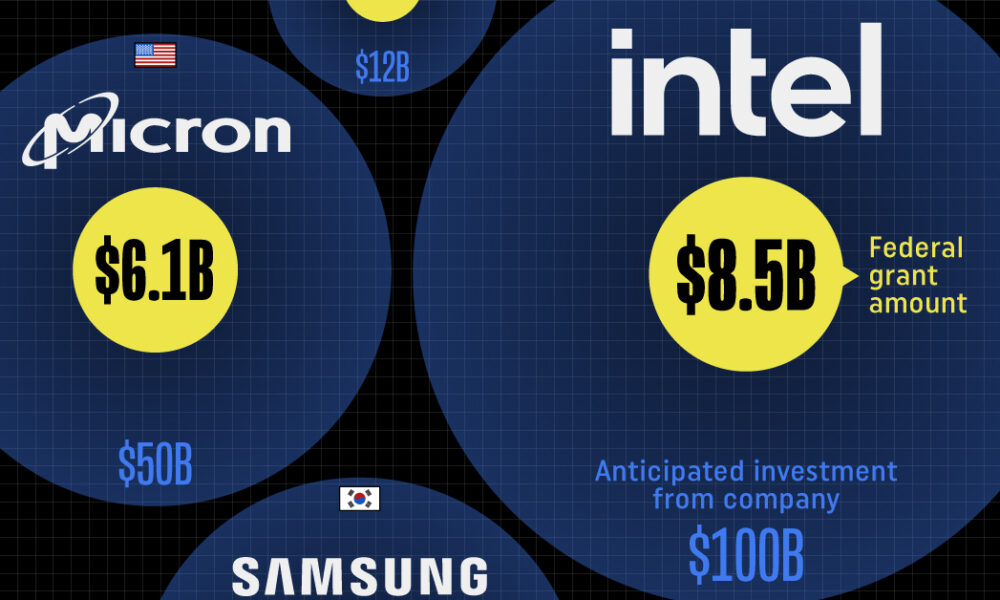
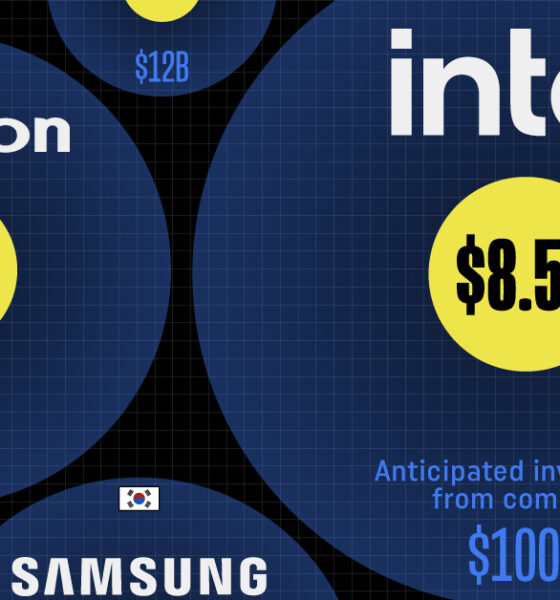
Intel, TSMC, and more have received billions in subsidies from the U.S. CHIPS Act in 2024.


Using our database of 700+ forecasts from reports, articles, interviews, and more, we highlight what experts think will happen in 2024.


Here are global risk projections for 2024 as tensions in the Middle East escalate and major economies face elections this year.


Where does the internet live? This graphic highlights the biggest data center markets in the world by electricity consumption.
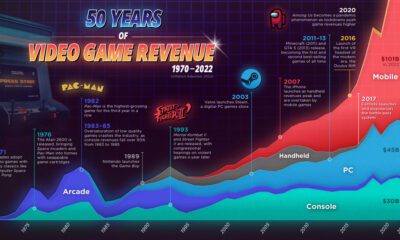

As technology has evolved, so too has the video game industry, consumer preferences, and drivers of growth. We do a deep dive.
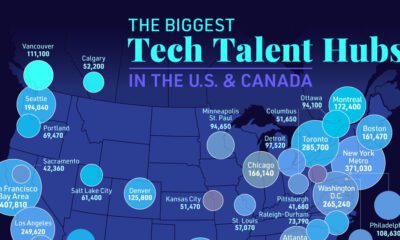

San Francisco and New York may be known as top tech talent hubs, but other cities are experiencing rapid growth in their tech labor pools.
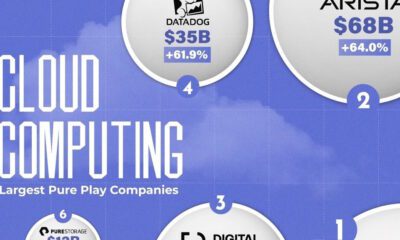

This graphic highlights the largest pure play cloud computing companies by market cap and annual return as of November 2023.
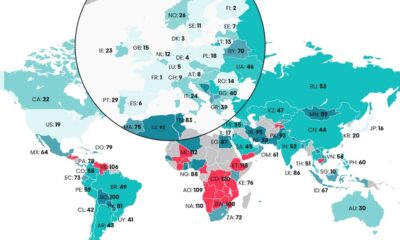

The Digital Quality of Life Index shows which countries are doing a better job than others in providing accessible and affordable internet.
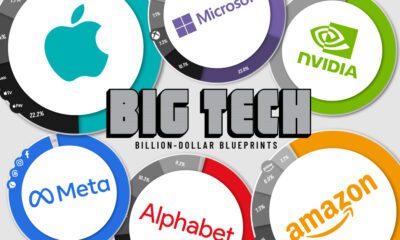

Thanks to the ubiquity of their products and services, these Big Tech companies have revenues bigger than many national GDPs.


AI and edge computing are some of the factors behind the stunning growth of the GPU cloud computing market, predicted to hit $25.5B by 2030.
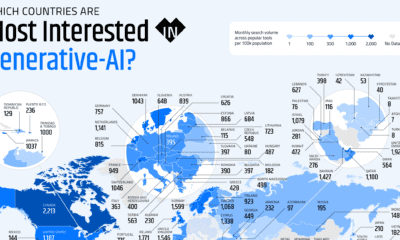

These graphics highlight interest in generative AI by country, covering interest in text, image, video, or audio generation.


 Creator Program