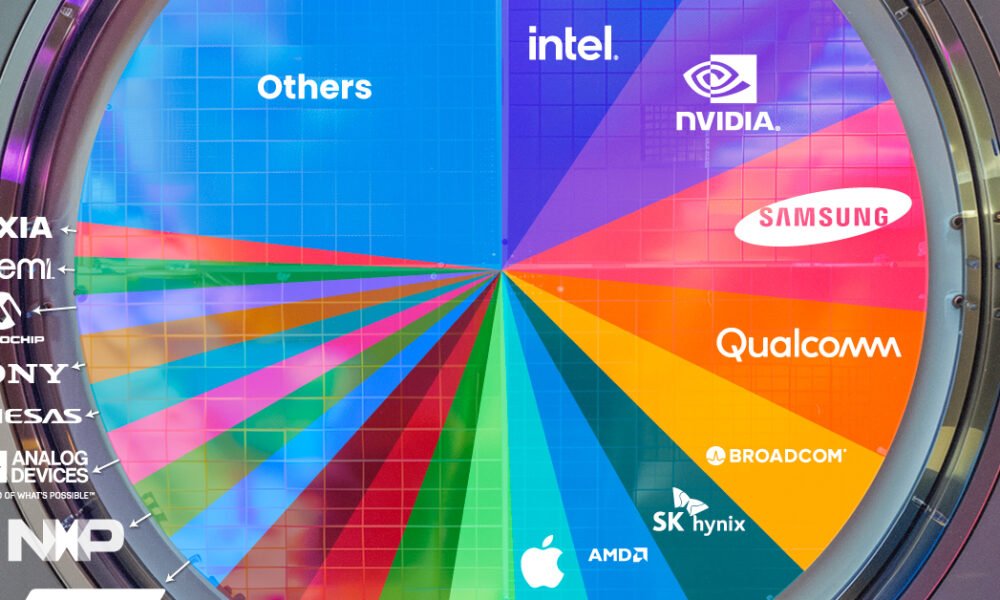
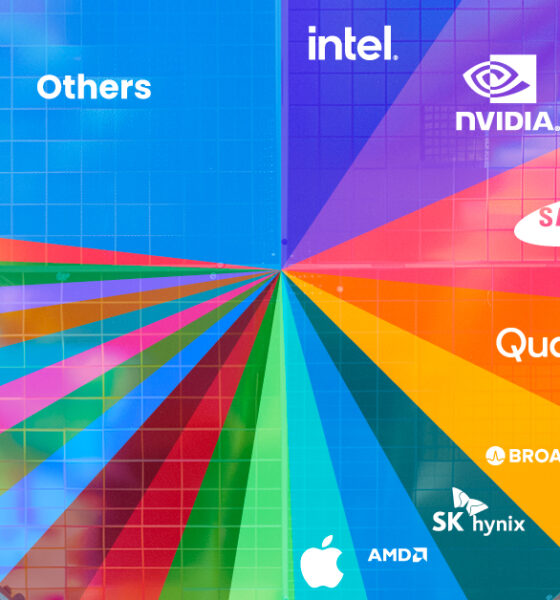
Nvidia is coming for Intel’s crown. Samsung is losing ground. AI is transforming the space. We break down revenue for...
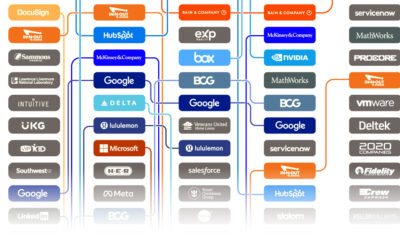

Glassdoor’s annual list is determined by an algorithm that converts reviews to ratings—here are America's 15 best places to work since 2020.


In 2023, iPhones accounted for more than half of Apple's revenue.


This graphic analyzes social platform usage among U.S. teenagers (13-17 years old), using data from a recent Pew Research study.
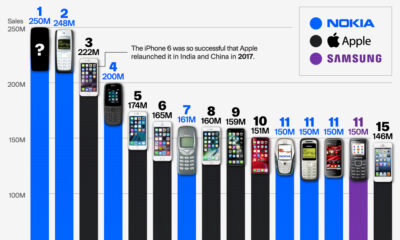

Samsungs, Motorolas, and iPhones, but which model tops the list of most sold mobile phones of all time?
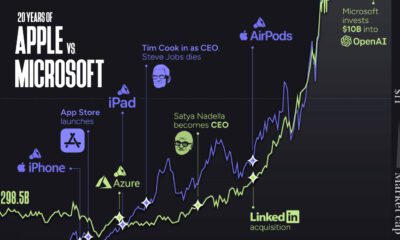

Apple and Microsoft have been switching places as the world’s most valuable company for years. We explore Apple vs. Microsoft over 20 years.


Artificial intelligence had its breakout year in 2023. As AI adoption grows, what were the most popular AI products last year?


We visualize some of the bigger tech layoffs in the year so far, from video game software provider Unity to big tech bastion Google.


Using our database of 700+ forecasts from reports, articles, interviews, and more, we highlight what experts think will happen in 2024.


Here are global risk projections for 2024 as tensions in the Middle East escalate and major economies face elections this year.


Where does the internet live? This graphic highlights the biggest data center markets in the world by electricity consumption.


 Creator Program