Economy
Visualizing 30 Years of Imports from U.S. Trading Partners
The following slider will automatically transition to highlight different trade entities. Use slider arrows on the sides to navigate manually.


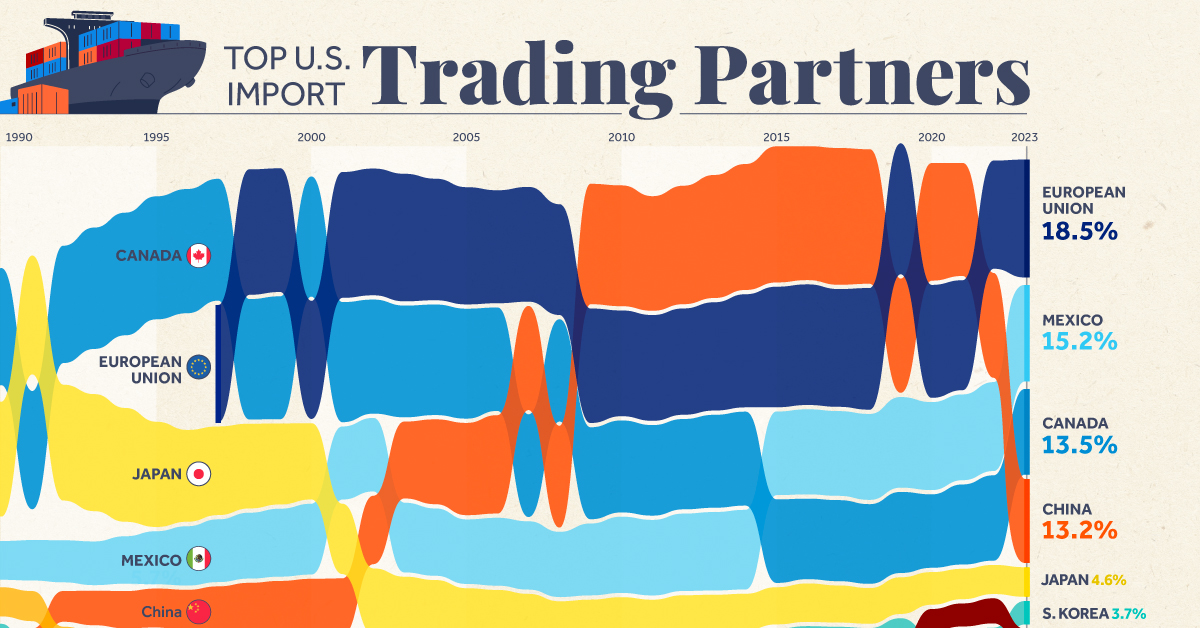
30 Years of Imports by Top U.S. Trading Partners
By the second quarter of 2023, the U.S. import bill had hit nearly $2 trillion.
But which countries are the top U.S. trading partners, and what do they ship to the largest economy in the world?
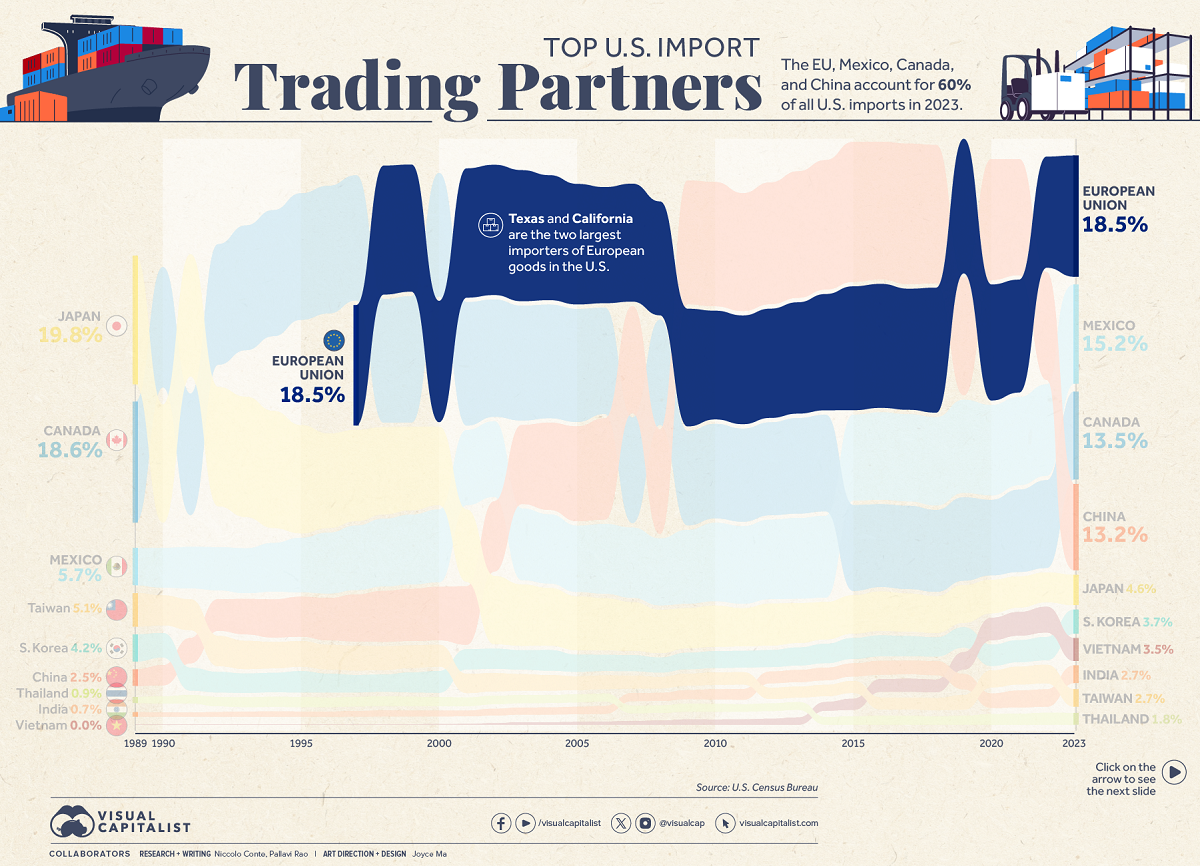
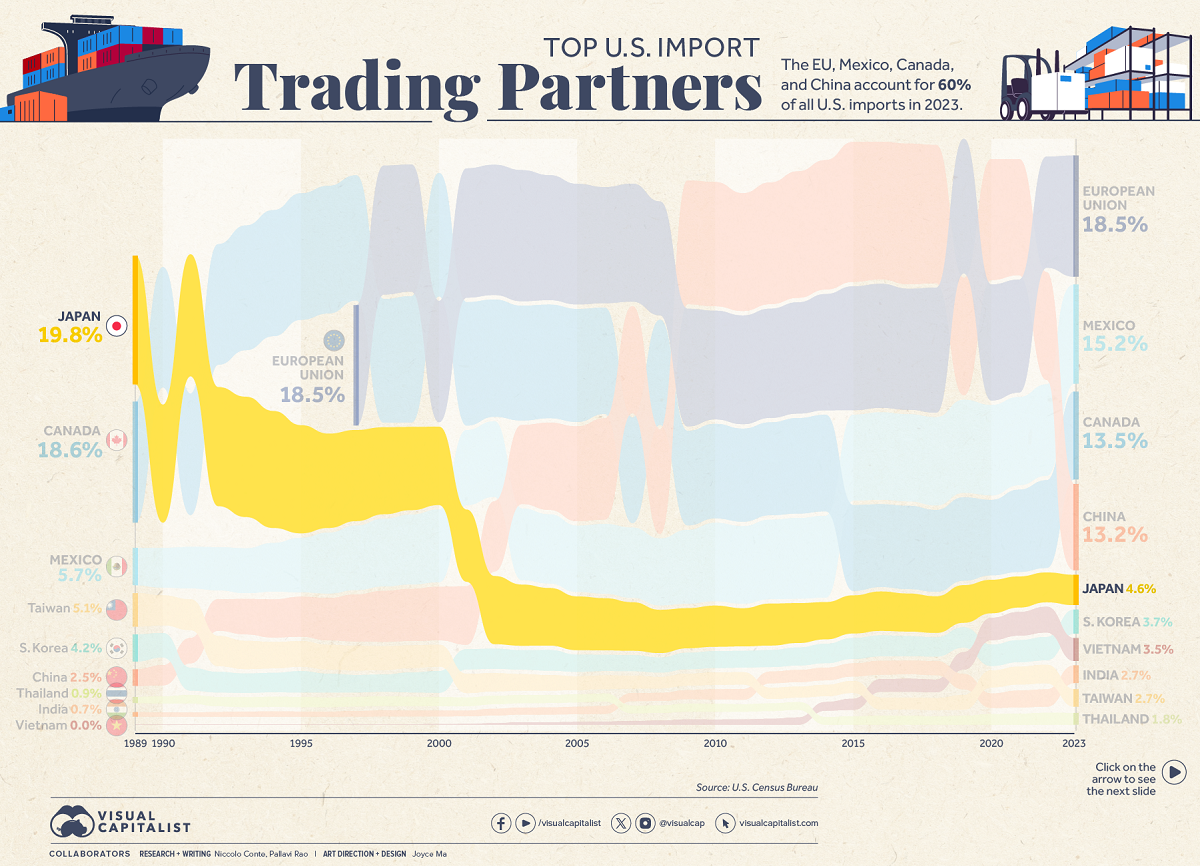
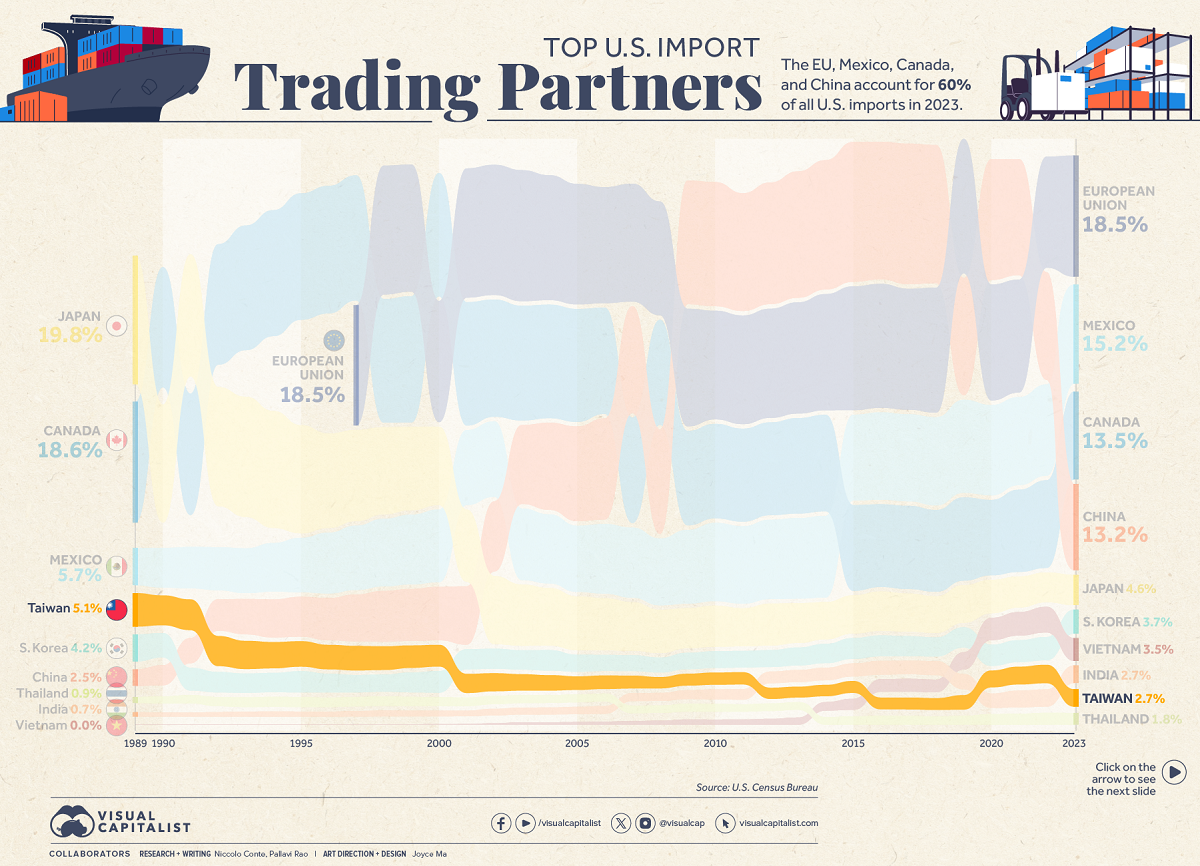
We use data as of July 2023 from the U.S. Census Bureau to create the chart above, showing America’s largest trading partners and how they’ve changed since 1989.
Ranked: U.S. Trading Partners by Imports (2023)
Through the first half of 2023, the EU was the biggest source of U.S. imports, accounting for nearly one-fifth of all goods and services imported into the country.
An interesting observation of this trade relationship is that the United States’ physical imports from (and exports to) the EU are essentially the same traded goods categories (medicines, machinery, and transportation equipment).
This is a representation of a phenomenon where richer countries tend to trade the same goods with each other, despite having the ability to manufacture domestically. The simple explanation behind this: consumers benefit from having more choice, and companies benefit from specialization and economies of scale.
Here are the major sources of U.S. imports in 2023 (through July), ranked below:
| Rank | Country/Trade Entity | U.S. Import Share (2023) |
|---|---|---|
| 1 | 🇪🇺 EU | 18.6% |
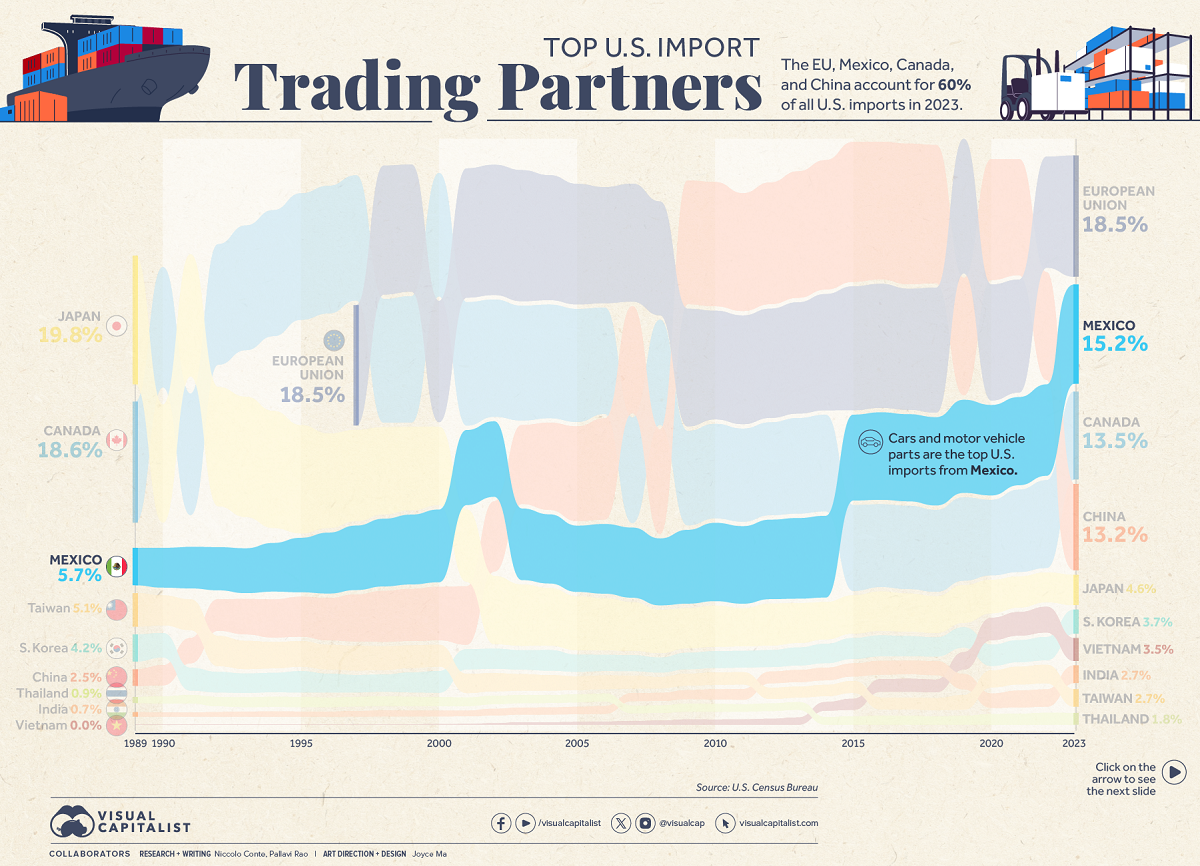
| 2 | 🇲🇽 Mexico | 15.2% |
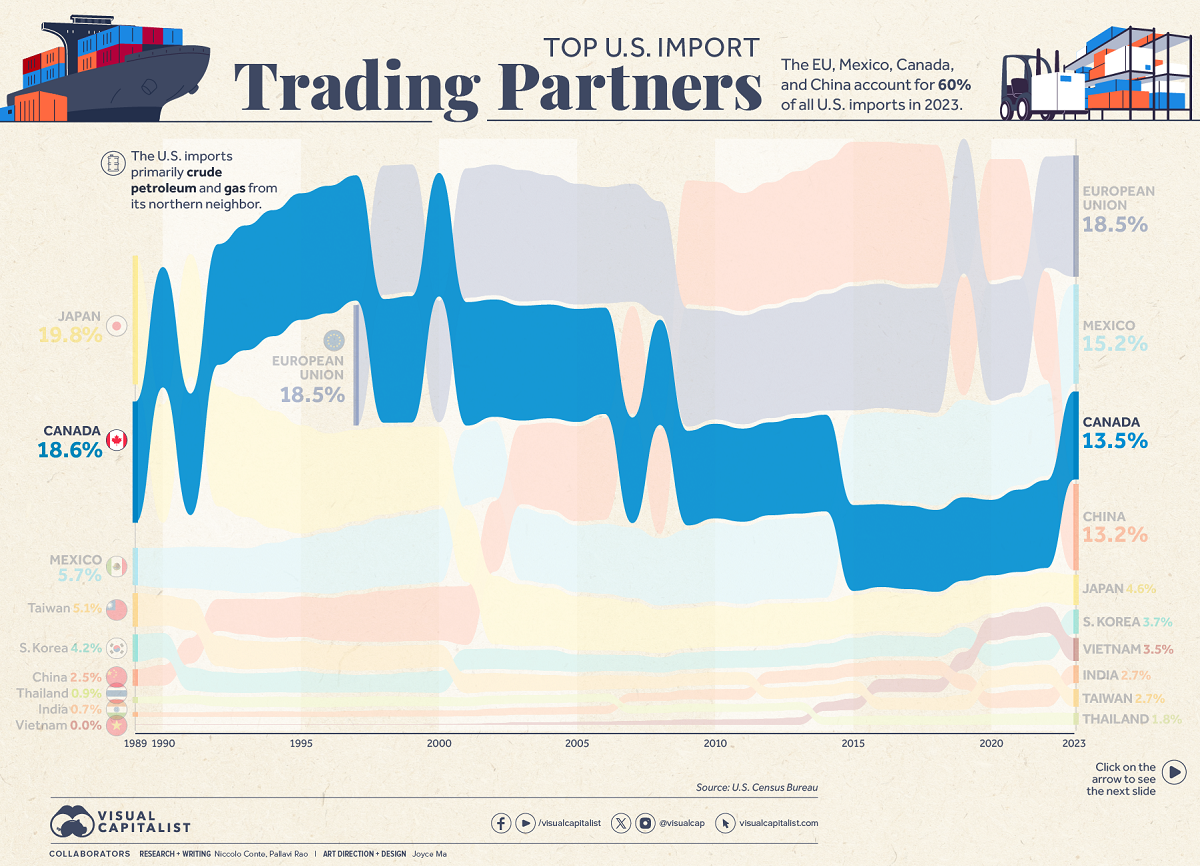
| 3 | 🇨🇦 Canada | 13.5% |
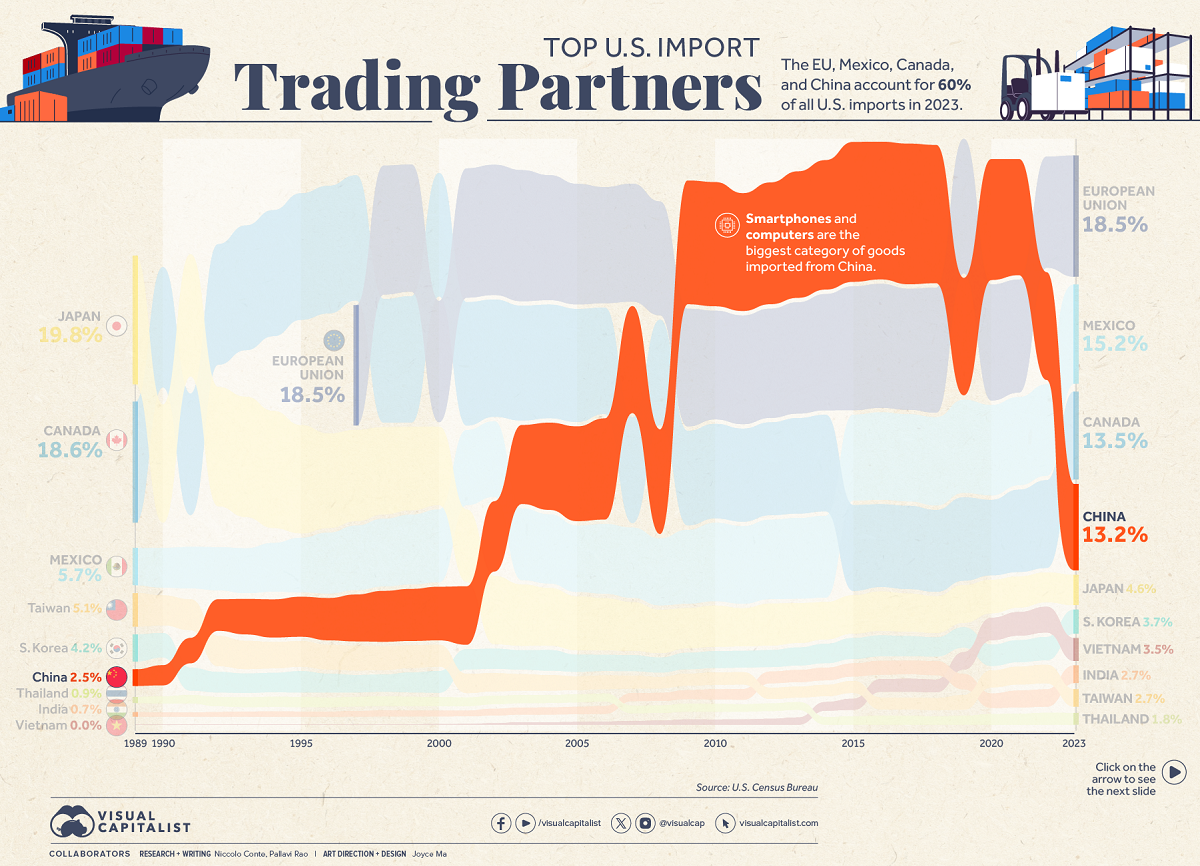
| 4 | 🇨🇳 China | 13.2% |
| 5 | 🇯🇵 Japan | 4.6% |
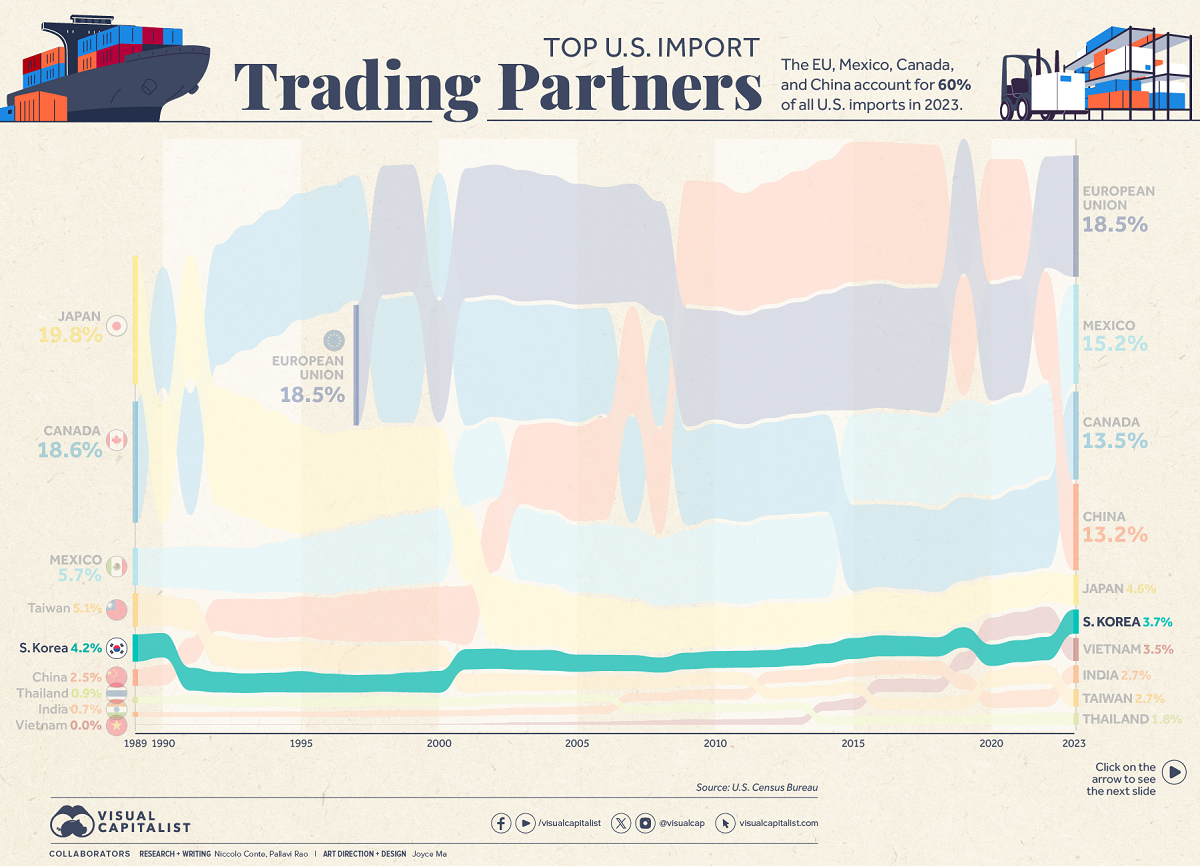
| 6 | 🇰🇷 South Korea | 3.7% |
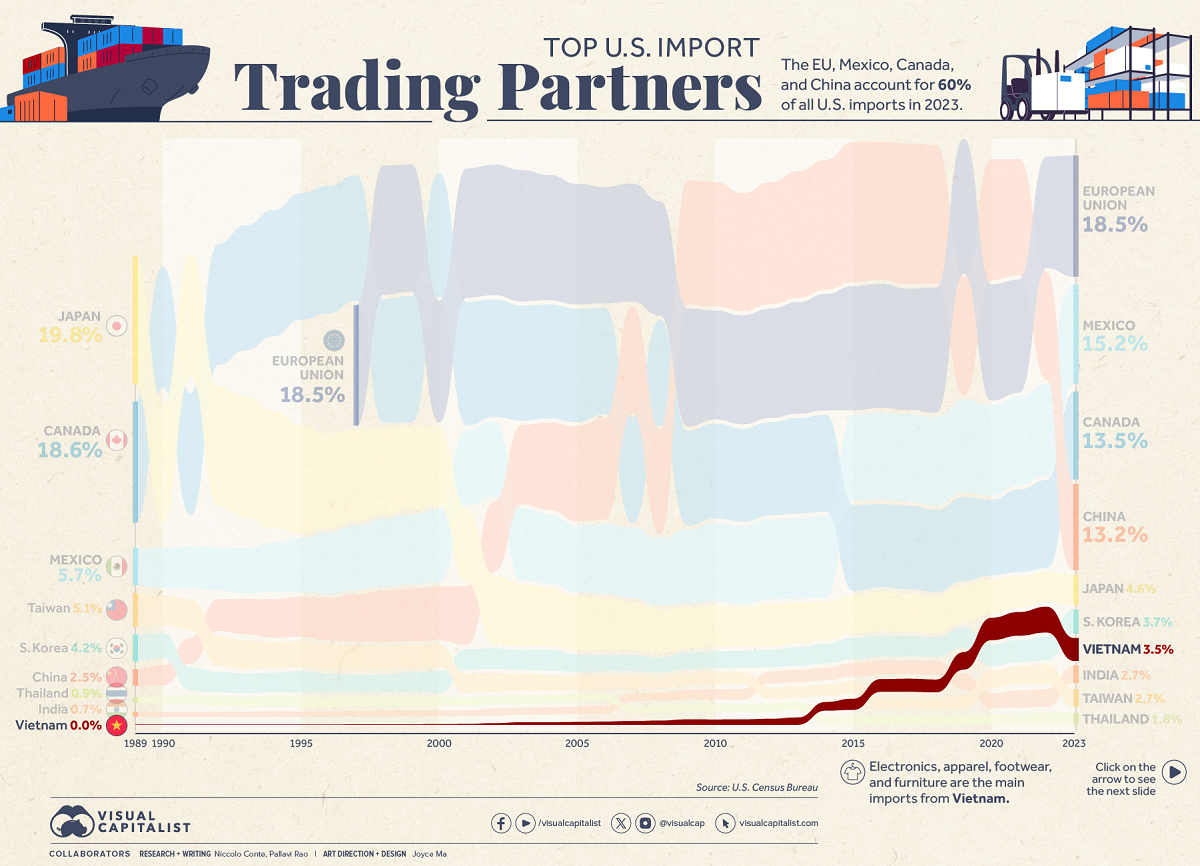
| 7 | 🇻🇳 Vietnam | 3.5% |
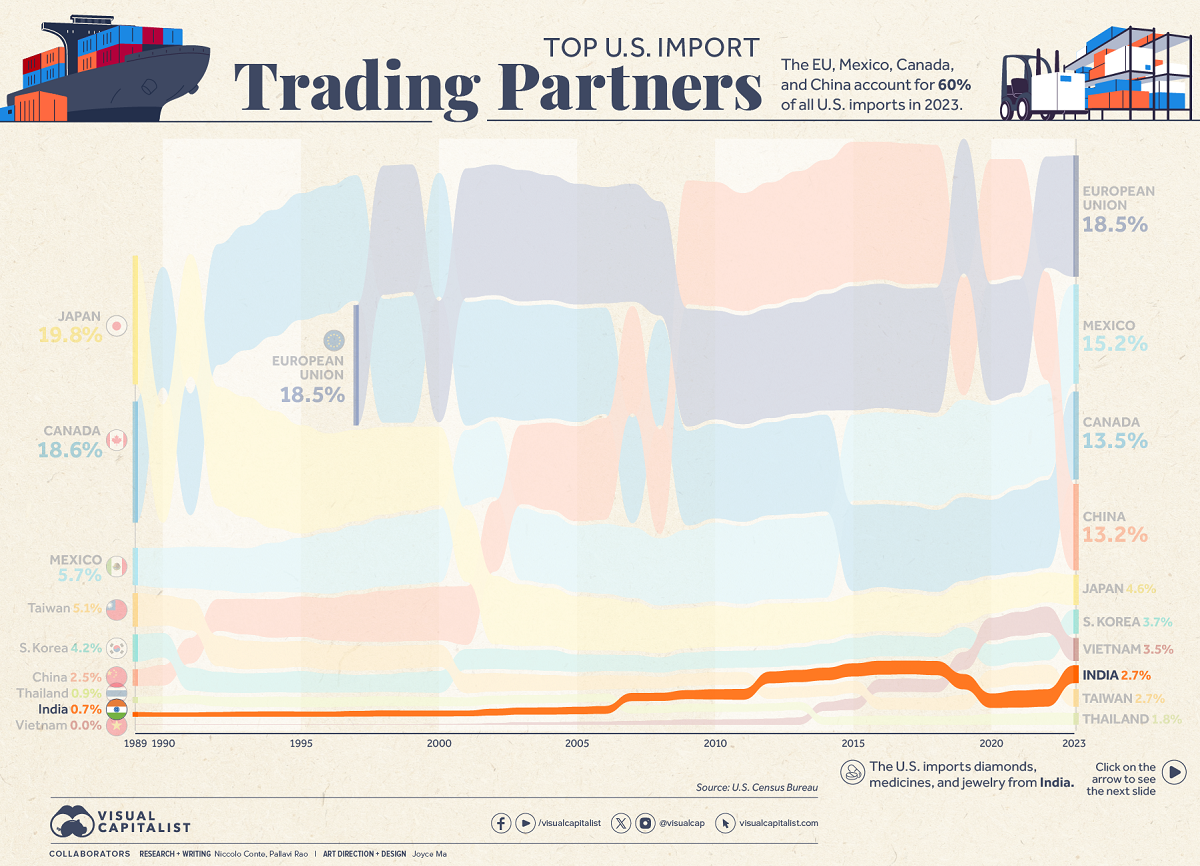
| 8 | 🇮🇳 India | 2.7% |
| 9 | 🇹🇼 Taiwan | 2.7% |
| 10 | 🇹🇭 Thailand | 1.8% |
The U.S. sources nearly one-third of all imports from second and third-biggest trading partners, neighbors Mexico (15.2%) and Canada (13.5%).
All three countries are part of USMCA (the new trade agreement replacing NAFTA), facilitating trilateral trade, and resulting in curious import and export patterns. For example, the U.S. imports oil from Canada, but exports oil to Mexico. Meanwhile, it imports transportation equipment from Mexico, and exports it to Canada.
China (13.2%) and Japan (4.6%) round out the top five import trade partners. Both countries have also been the biggest sources of U.S. imports in the past, China as recently as 2022, while Japan way further back in 1989.
| Rank | Country/Trade Entity | U.S. Import Share (1989) |
|---|---|---|
| 1 | 🇯🇵 Japan | 19.8% |
| 2 | 🇨🇦 Canada | 18.6% |
| 3 | 🇲🇽 Mexico | 5.7% |
| 4 | 🇹🇼 Taiwan | 5.1% |
| 5 | 🇰🇷 South Korea | 4.2% |
| 6 | 🇨🇳 China | 2.5% |
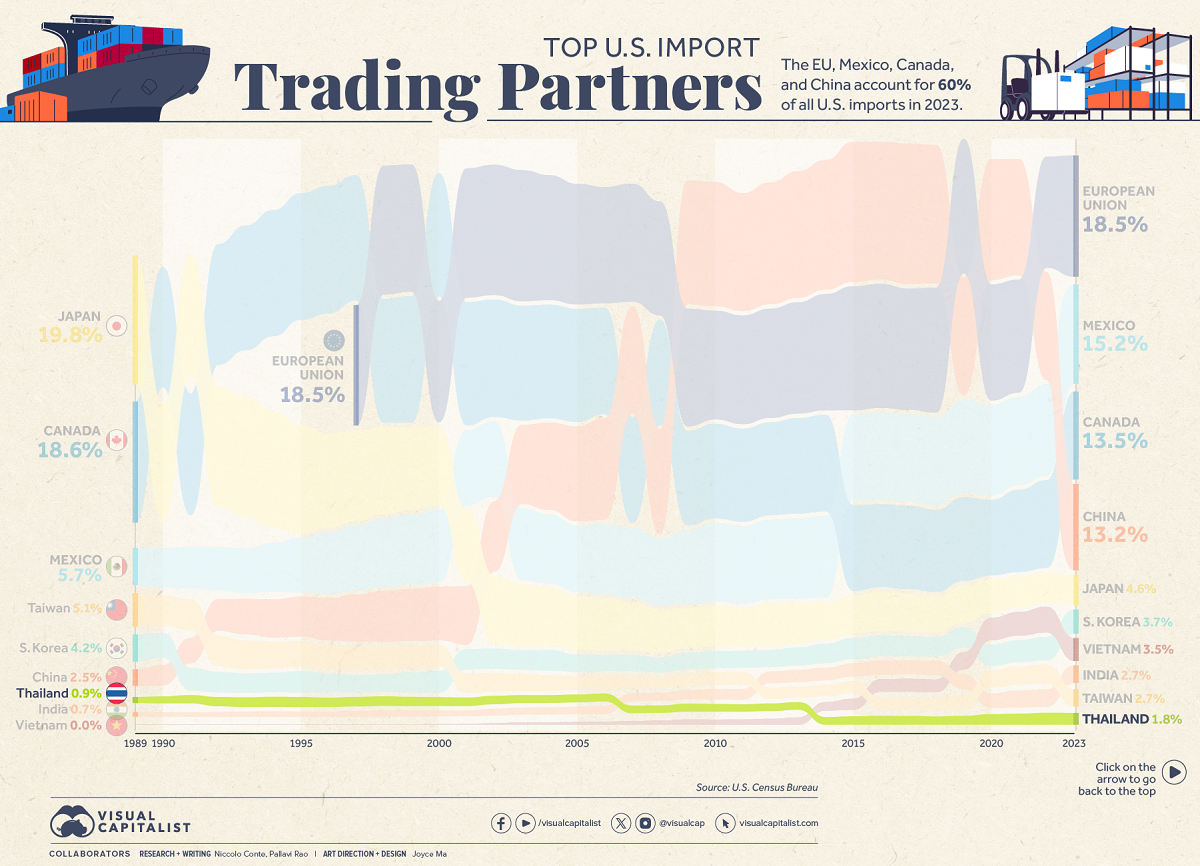
| 7 | 🇹🇭 Thailand | 0.9% |
| 8 | 🇮🇳 India | 0.7% |
| 9 | 🇻🇳 Vietnam | 0.0% |
Note: The EU was formally established in 1993.
Meanwhile, since the 2010s, countries in South and Southeast Asia have taken up a larger share of U.S. imports, filling out the bottom half of the top 10, reflecting shifting bases of global manufacturing.
U.S. Trade Deficits
The U.S. imports more than it exports to all its top trade partners, and as a result had a total trade deficit of nearly $700 billion by the second quarter of 2023. This is not out of pocket—the country has logged an annual trade deficit for much of its history post-WWII.
| Rank | Country/Trade Entity | Deficit ($ Billions) |
|---|---|---|
| 1 | 🇨🇳 China | -$181.8 |
| 2 | 🇪🇺 EU | -$139.3 |
| 3 | 🇲🇽 Mexico | -$100.7 |
| 4 | 🇻🇳 Vietnam | -$66.7 |
| 5 | 🇯🇵 Japan | -$45.8 |
| 6 | 🇨🇦 Canada | -$42.4 |
| 7 | 🇰🇷 South Korea | -$34.7 |
| 8 | 🇹🇼 Taiwan | -$29.9 |
| 9 | 🇮🇳 India | -$28.8 |
| 10 | 🇹🇭 Thailand | -$26.7 |
Source: U.S. Census Bureau, Foreign-Trade Balance (EU), Foreign Trade Statistics (Top 10).
Economists argue that this deficit is a reflection of the low saving rate in the economy, where demand for goods is driven by borrowing. At the same time this allows the country to maintain robust economic growth that it perhaps would not have achieved with a higher saving rate.


Economy
Economic Growth Forecasts for G7 and BRICS Countries in 2024
The IMF has released its economic growth forecasts for 2024. How do the G7 and BRICS countries compare?


G7 & BRICS Real GDP Growth Forecasts for 2024
The International Monetary Fund’s (IMF) has released its real gross domestic product (GDP) growth forecasts for 2024, and while global growth is projected to stay steady at 3.2%, various major nations are seeing declining forecasts.
This chart visualizes the 2024 real GDP growth forecasts using data from the IMF’s 2024 World Economic Outlook for G7 and BRICS member nations along with Saudi Arabia, which is still considering an invitation to join the bloc.
Get the Key Insights of the IMF’s World Economic Outlook
Want a visual breakdown of the insights from the IMF’s 2024 World Economic Outlook report?
This visual is part of a special dispatch of the key takeaways exclusively for VC+ members.
Get the full dispatch of charts by signing up to VC+.
Mixed Economic Growth Prospects for Major Nations in 2024
Economic growth projections by the IMF for major nations are mixed, with the majority of G7 and BRICS countries forecasted to have slower growth in 2024 compared to 2023.
Only three BRICS-invited or member countries, Saudi Arabia, the UAE, and South Africa, have higher projected real GDP growth rates in 2024 than last year.
| Group | Country | Real GDP Growth (2023) | Real GDP Growth (2024P) |
|---|---|---|---|
| G7 | 🇺🇸 U.S. | 2.5% | 2.7% |
| G7 | 🇨🇦 Canada | 1.1% | 1.2% |
| G7 | 🇯🇵 Japan | 1.9% | 0.9% |
| G7 | 🇫🇷 France | 0.9% | 0.7% |
| G7 | 🇮🇹 Italy | 0.9% | 0.7% |
| G7 | 🇬🇧 UK | 0.1% | 0.5% |
| G7 | 🇩🇪 Germany | -0.3% | 0.2% |
| BRICS | 🇮🇳 India | 7.8% | 6.8% |
| BRICS | 🇨🇳 China | 5.2% | 4.6% |
| BRICS | 🇦🇪 UAE | 3.4% | 3.5% |
| BRICS | 🇮🇷 Iran | 4.7% | 3.3% |
| BRICS | 🇷🇺 Russia | 3.6% | 3.2% |
| BRICS | 🇪🇬 Egypt | 3.8% | 3.0% |
| BRICS-invited | 🇸🇦 Saudi Arabia | -0.8% | 2.6% |
| BRICS | 🇧🇷 Brazil | 2.9% | 2.2% |
| BRICS | 🇿🇦 South Africa | 0.6% | 0.9% |
| BRICS | 🇪🇹 Ethiopia | 7.2% | 6.2% |
| 🌍 World | 3.2% | 3.2% |
China and India are forecasted to maintain relatively high growth rates in 2024 at 4.6% and 6.8% respectively, but compared to the previous year, China is growing 0.6 percentage points slower while India is an entire percentage point slower.
On the other hand, four G7 nations are set to grow faster than last year, which includes Germany making its comeback from its negative real GDP growth of -0.3% in 2023.
Faster Growth for BRICS than G7 Nations
Despite mostly lower growth forecasts in 2024 compared to 2023, BRICS nations still have a significantly higher average growth forecast at 3.6% compared to the G7 average of 1%.
While the G7 countries’ combined GDP is around $15 trillion greater than the BRICS nations, with continued higher growth rates and the potential to add more members, BRICS looks likely to overtake the G7 in economic size within two decades.
BRICS Expansion Stutters Before October 2024 Summit
BRICS’ recent expansion has stuttered slightly, as Argentina’s newly-elected president Javier Milei declined its invitation and Saudi Arabia clarified that the country is still considering its invitation and has not joined BRICS yet.
Even with these initial growing pains, South Africa’s Foreign Minister Naledi Pandor told reporters in February that 34 different countries have submitted applications to join the growing BRICS bloc.
Any changes to the group are likely to be announced leading up to or at the 2024 BRICS summit which takes place October 22-24 in Kazan, Russia.
Get the Full Analysis of the IMF’s Outlook on VC+
This visual is part of an exclusive special dispatch for VC+ members which breaks down the key takeaways from the IMF’s 2024 World Economic Outlook.
For the full set of charts and analysis, sign up for VC+.

-

 Education1 week ago
How Hard Is It to Get Into an Ivy League School?
-

 Technology2 weeks ago
Ranked: Semiconductor Companies by Industry Revenue Share
-

 Markets2 weeks ago
Ranked: The World’s Top Flight Routes, by Revenue
-

 Demographics2 weeks ago
Population Projections: The World’s 6 Largest Countries in 2075
-

 Markets2 weeks ago
The Top 10 States by Real GDP Growth in 2023
-

 Demographics2 weeks ago
The Smallest Gender Wage Gaps in OECD Countries
-

 Economy2 weeks ago
Where U.S. Inflation Hit the Hardest in March 2024
-

 Green2 weeks ago
Top Countries By Forest Growth Since 2001