How Hydrogen Could Fuel a Net-Zero Future
How Hydrogen Could Fuel a Net-Zero Future
Hydrogen has a 300% higher energy content than gasoline, is harnessed by our sun to create life-giving heat and light, and when used in fuel cells, the only ‘waste’ it produces is water.
So it’s no surprise that policymakers are looking closely at the fuel in the race to net zero. But with demand set to skyrocket between now and 2050, will the supply be there when needed?
To answer that question, we’ve partnered with Fasken to look at how hydrogen could fuel a net-zero future.
The State of Hydrogen
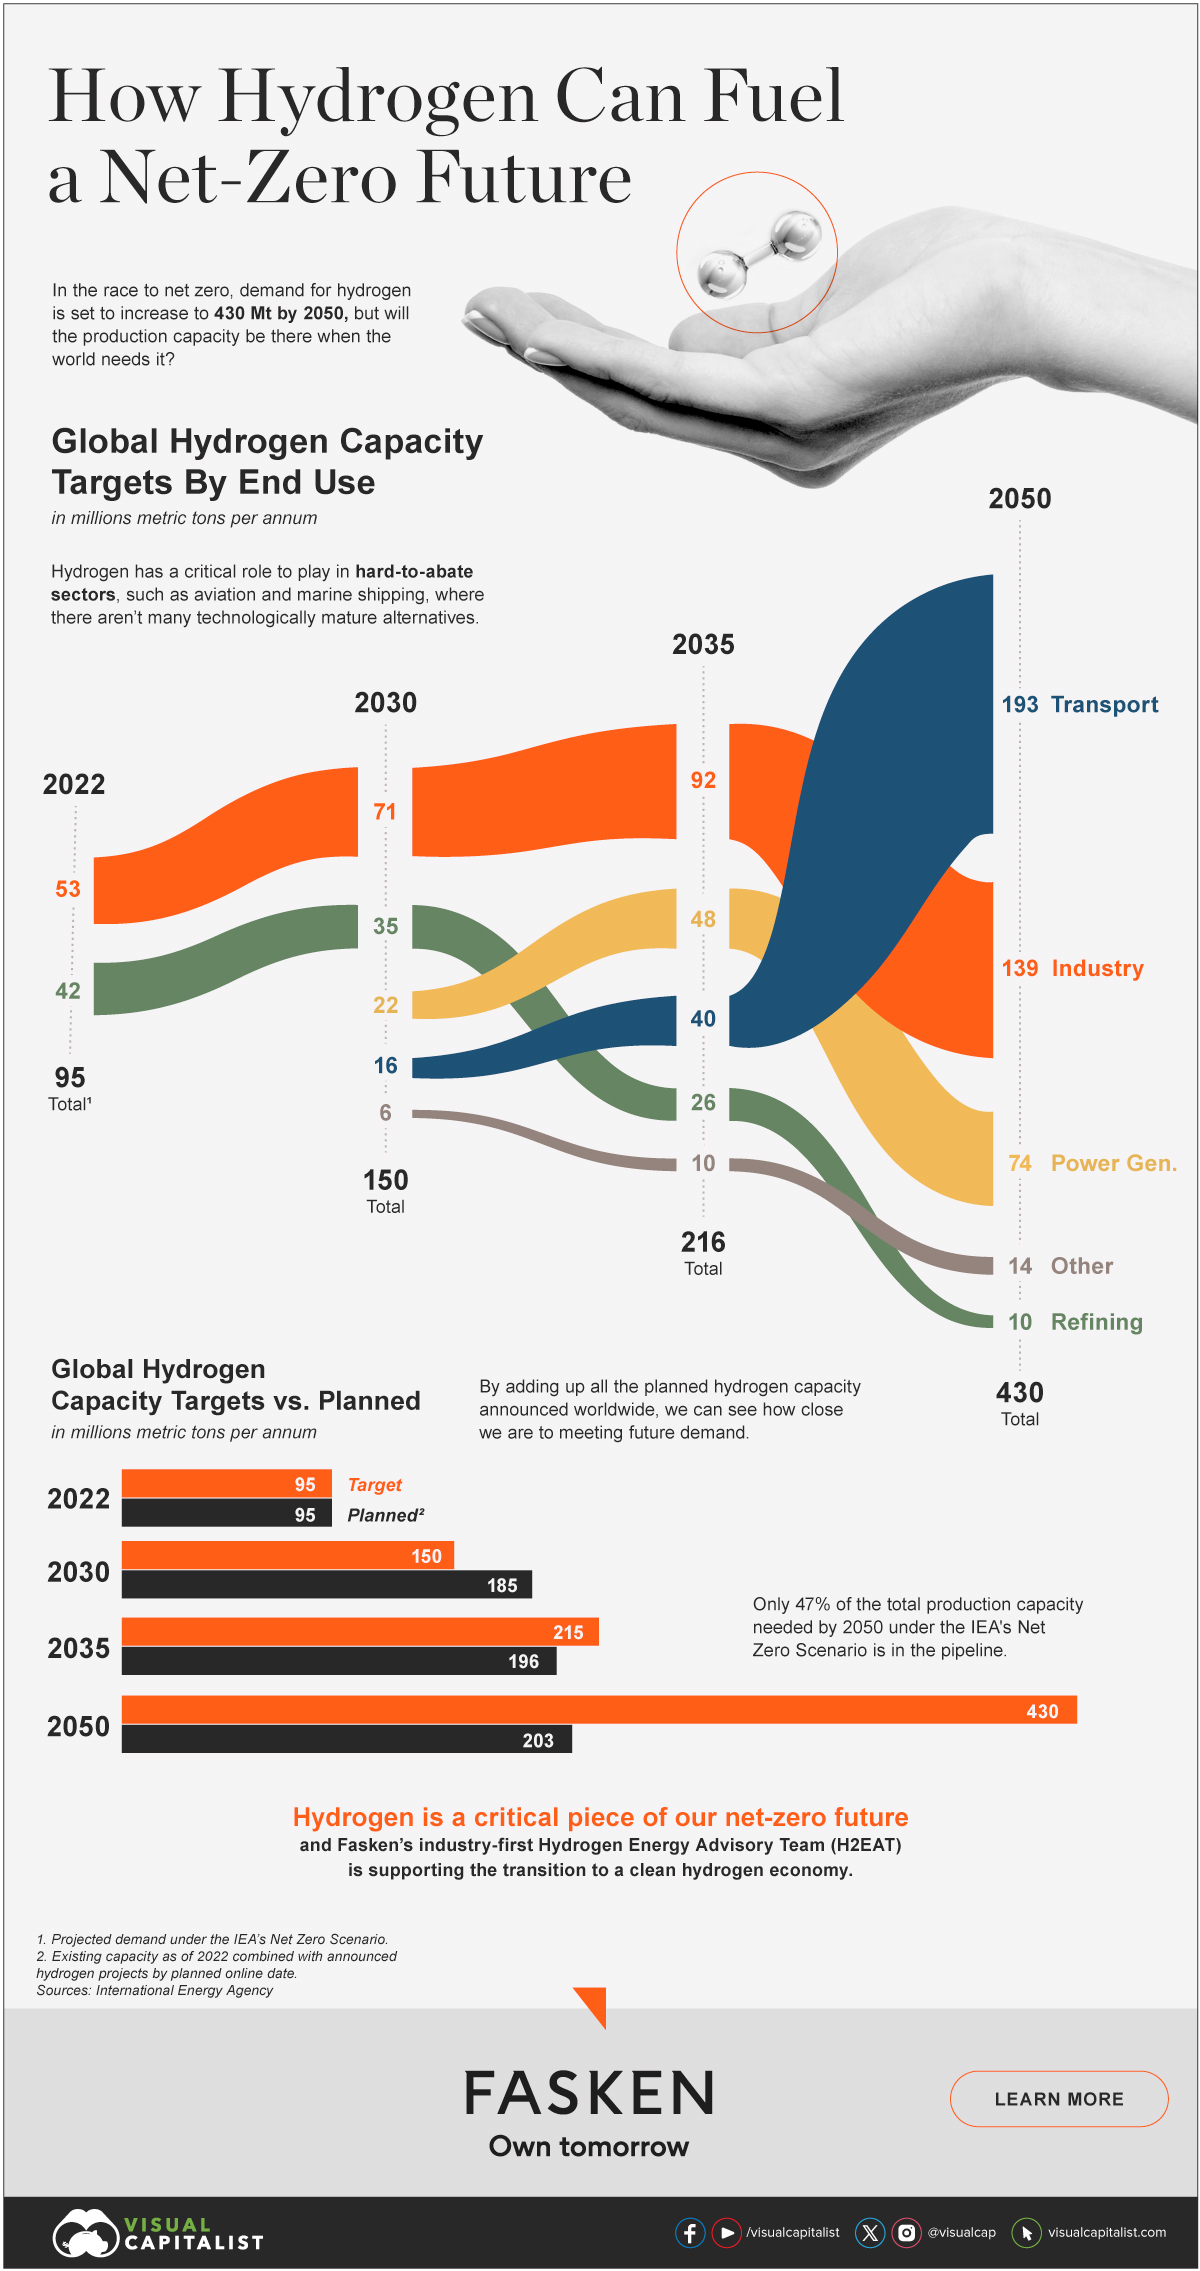
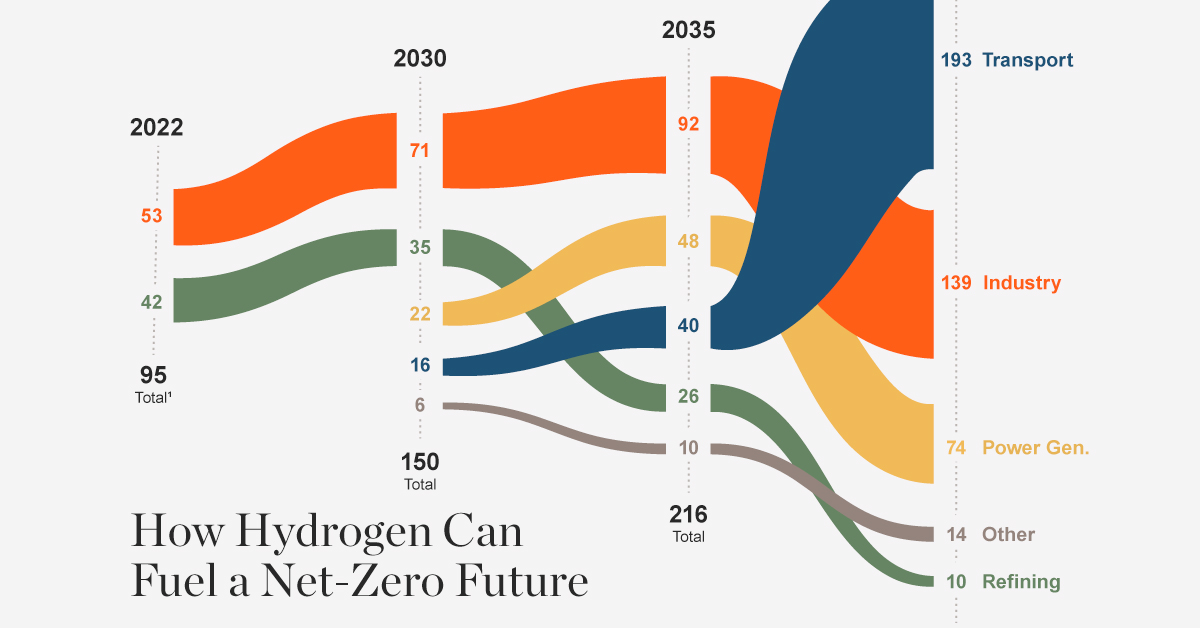
According to data from the International Energy Agency (IEA), global hydrogen production capacity in 2022 was 95 million metric tons per annum (Mt p.a.), concentrated in industry and refining.
Under the IEA’s net-zero scenario, which limits average temperature increase to 1.5°C from pre-industrial levels, annual production will need to increase over 350% by 2050, to 430 Mt p.a.
| End use | 2022 | 2030 | 2035 | 2050 |
|---|---|---|---|---|
| Refining | 42 Mt p.a. | 35 Mt p.a. | 26 Mt p.a. | 10 Mt p.a. |
| Industry | 53 Mt p.a. | 71 Mt p.a. | 92 Mt p.a. | 139 Mt p.a. |
| Transport | - | 16 Mt p.a. | 40 Mt p.a. | 193 Mt p.a. |
| Power generation | - | 22 Mt p.a. | 48 Mt p.a. | 74 Mt p.a. |
| Other | - | 6 Mt p.a. | 10 Mt p.a. | 14 Mt p.a. |
| Total | 95 Mt p.a. | 150 Mt p.a. | 216 Mt p.a. | 430 Mt p.a. |
Hydrogen has a critical role to play in hard-to-abate sectors, where there aren’t many technologically mature alternatives.
In the shipping industry, for example, hydrogen could replace conventional bunker fuels. Similarly, in commercial aviation, it could displace the 1.5 million barrels of jet fuel used every day in the United States.
Water, Water Everywhere and Not a Drop to Drink
Hydrogen may be the most abundant element in the universe, but it only exists as a gas on Earth in minute quantities, so has to be separated from other compounds, like water. And that takes energy, which can be low- or high-emission, depending on the fuel source.
There is a veritable rainbow of colors to differentiate hydrogen by how its made, but to keep things simple here are the three main ones:
- Gray: Produced using steam or gasification from unabated fossil fuels
- Blue: Produced using steam or gasification from unabated fossil fuels with carbon capture
- Green: Electrolysis powered by renewables
| Color | 2022 | 2030 | 2035 | 2050 | |
|---|---|---|---|---|---|
| Low-emission production | Green + blue hydrogen | 1.1% | 46.0% | 69.8% | 96.7% |
| Unabated fossil-fuel production | Gray hydrogen | 98.9% | 54.0% | 30.2% | 3.3% |
In 2022, low-emission hydrogen production (blue + green) made up only 1.1%, which, under the IEA’s net-zero scenario, will need to increase steeply to 96.7% in 2050.
Project Pipeline and Pipeline Projects
So how close are we to 430 Mt p.a.?
According to the IEA’s Hydrogen Production and Infrastructure Projects Database, there was 95.0 Mt p.a. in production capacity in 2022. Looking ahead to planned projects by their online date, we see that a small gap opens up after 2035, before widening into a 200 Mt p.a. chasm by 2050.
More announcements are likely to come as the 2050 deadline comes more and more into focus, but sustained policy support will be crucial to meeting that goal.
| 2022 | 2030 | 2035 | 2050 | |
|---|---|---|---|---|
| Planned capacity | 95 Mt p.a. | 185 Mt p.a. | 196 Mt p.a. | 203 Mt p.a. |
| Target | 95 Mt p.a. | 150 Mt p.a. | 216 Mt p.a. | 430 Mt p.a. |
| Variance (+ / -) | - | +35 Mt p.a. | -20 Mt p.a. | -227 Mt p.a. |
However, even once all that capacity comes online, there’s still the matter of getting it from where it’s made, to where it will be used. And part of that puzzle will be pipelines, which need to go from 5,000 km in 2022, to over 200,000 km in 2050.
A Stellar Future for Hydrogen
But momentum is growing.
The second-largest refueling port in Europe, Antwerp-Bruges, has committed to becoming carbon neutral by 2050, with hydrogen playing a key role. Similarly, a recent study of Canada’s oil sands, found that hydrogen could save 1.5T cu. ft. of natural gas per year, between 2021 and 2050, resulting in 76% fewer CO2 emissions.
Ultimately, the stuff of stars could have a stellar future.

Learn how Fasken’s industry-first Hydrogen Energy Advisory Team (H2EAT) is supporting the transition to a clean hydrogen economy.

-

 Lithium5 days ago
Ranked: The Top 10 EV Battery Manufacturers in 2023
Asia dominates this ranking of the world’s largest EV battery manufacturers in 2023.
-

 Energy1 week ago
The World’s Biggest Nuclear Energy Producers
China has grown its nuclear capacity over the last decade, now ranking second on the list of top nuclear energy producers.
-

 Energy1 month ago
The World’s Biggest Oil Producers in 2023
Just three countries accounted for 40% of global oil production last year.
-

 Energy1 month ago
How Much Does the U.S. Depend on Russian Uranium?
Currently, Russia is the largest foreign supplier of nuclear power fuel to the U.S.
-

 Uranium2 months ago
Charted: Global Uranium Reserves, by Country
We visualize the distribution of the world’s uranium reserves by country, with 3 countries accounting for more than half of total reserves.
-

 Energy3 months ago
Visualizing the Rise of the U.S. as Top Crude Oil Producer
Over the last decade, the United States has established itself as the world’s top producer of crude oil, surpassing Saudi Arabia and Russia.


