Markets
Mānuka Honey: New Zealand’s Sweet Success in the Global Honey Trade
Article/Editing:
Mānuka Honey and the Global Honey Trade
Did you know that the honey export industry today is worth billions?
Over the past two decades, the demand for this sought-after pantry staple has grown across industries ranging from skincare to medicine.
In this vibrant infographic, Edit Gyenge uses data from resourcetrade.earth to track the exponential growth in the global honey export industry from 2000 to 2020.
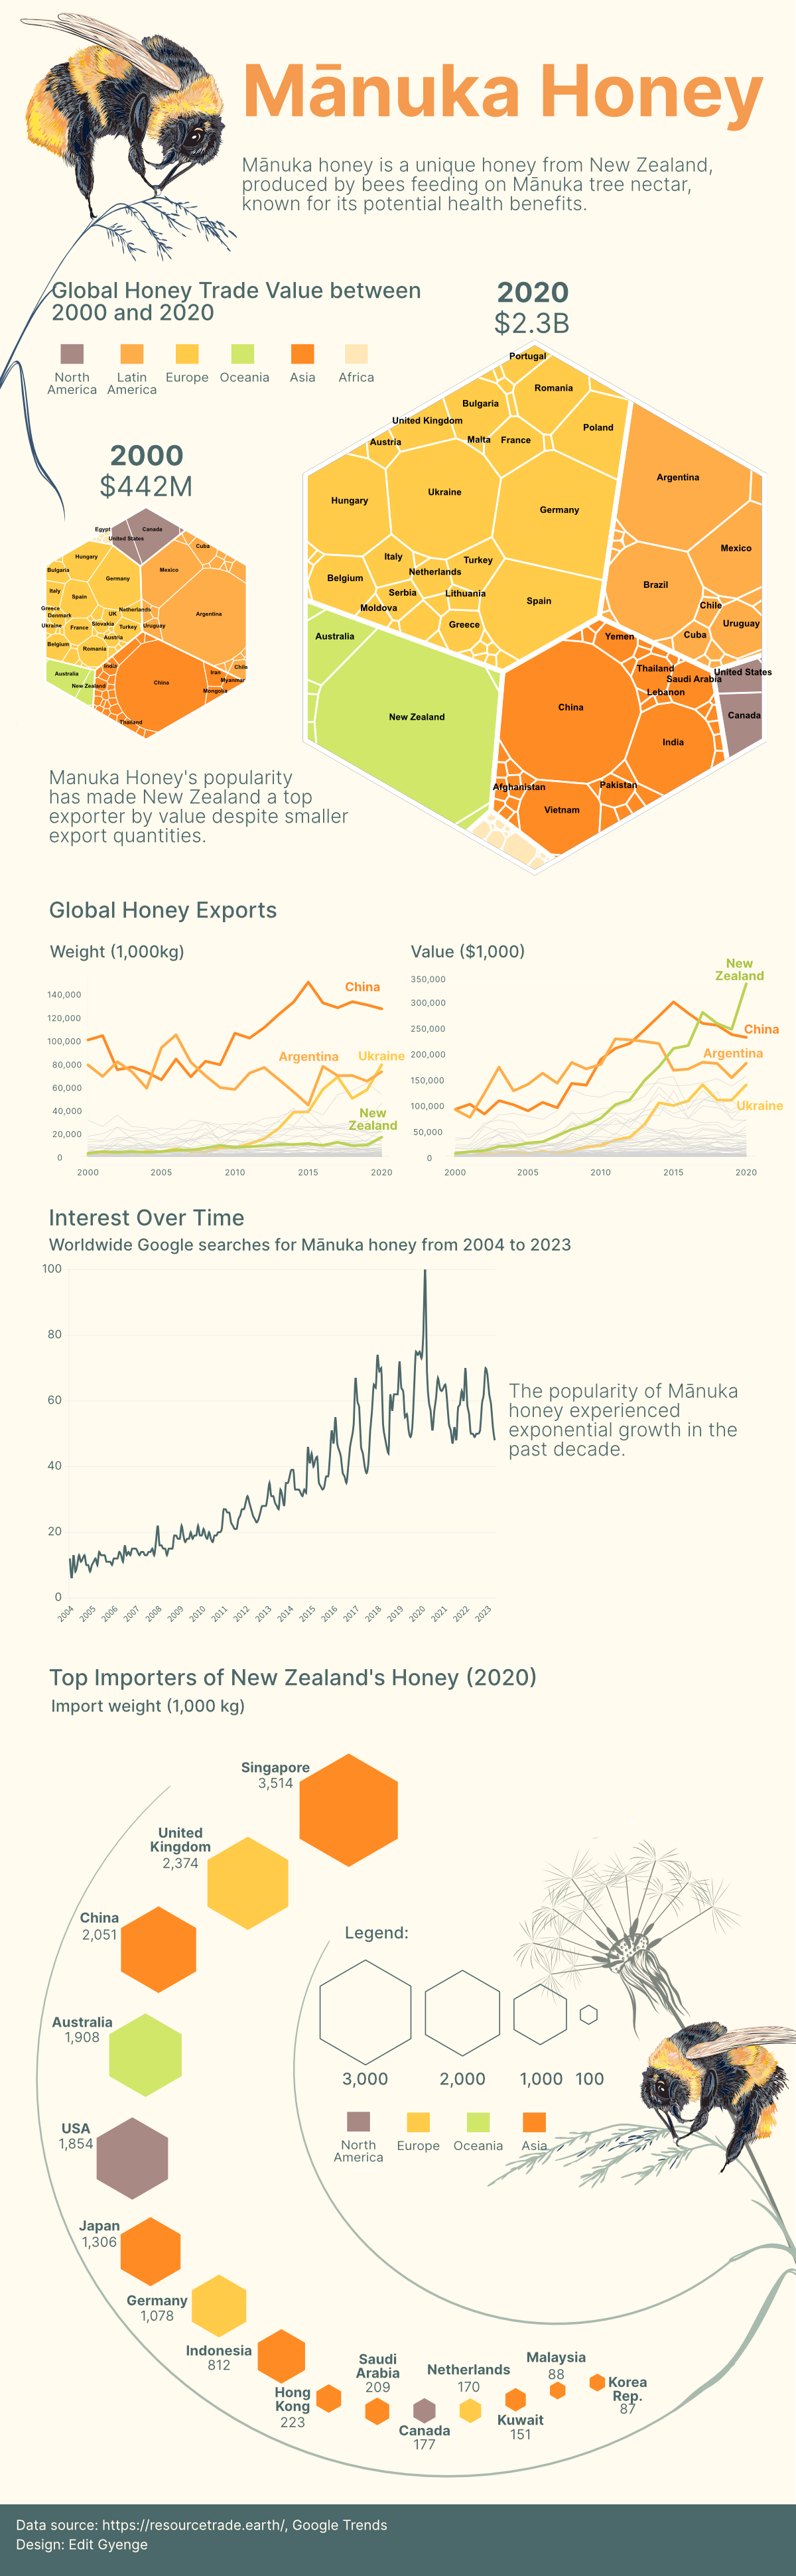
The Surge of Honey Money
Despite honey being harvested from beehives since antiquity, honey exports globally were only valued at $442 million in 2000. This number shot up to $2.3 billion in 2020.
| Rank | Honey Exporting Country | Value (2020 USD) | Weight (2020 Tonnes) |
|---|---|---|---|
| 1 | 🇳🇿 New Zealand | $333.34M | 16,547.36 |
| 2 | 🇨🇳 China | $229.62M | 127,132.51 |
| 3 | 🇦🇷 Argentina | $179.58M | 72,920.54 |
| 4 | 🇩🇪 Germany | $155.26M | 31,287.53 |
| 5 | 🇺🇦 Ukraine | $137.99M | 78,983.95 |
| 6 | 🇪🇸 Spain | $109.19M | 27,187.59 |
| 7 | 🇧🇷 Brazil | $100.27M | 45,733.41 |
| 8 | 🇭🇺 Hungary | $94.85M | 21,437.72 |
| 9 | 🇮🇳 India | $87.56M | 53,288.02 |
| 10 | 🇻🇳 Vietnam | $71.13M | 15,597.46 |
| 11 | 🇲🇽 Mexico | $68.72M | 21,101.57 |
| 12 | 🇵🇱 Poland | $58.07M | 23,472.43 |
| 13 | 🇷🇴 Romania | $49.99M | 13,925.81 |
| 14 | 🇦🇺 Australia | $44.62M | 6,287.35 |
| 15 | 🇧🇪 Belgium | $40.48M | 10,709.40 |
| 16 | 🇧🇬 Bulgaria | $39.28M | 13,373.22 |
| 17 | 🇨🇦 Canada | $35.09M | 9,112.48 |
| 18 | 🇺🇾 Uruguay | $31.71M | 15,842.94 |
| 19 | 🇫🇷 France | $29.83M | 4,342.84 |
| 20 | 🇬🇧 United Kingdom | $27.24M | 5,651.56 |
| 21 | 🇹🇷 Turkey | $25.53M | 5,695.40 |
| 22 | 🇸🇦 Saudi Arabia | $25.24M | 3,073.50 |
| 23 | 🇮🇹 Italy | $23.67M | 3,743.44 |
| 24 | 🇺🇸 United States | $20.77M | 6,002.50 |
| 25 | 🇬🇷 Greece | $20.09M | 4,256.29 |
| 26 | 🇹🇭 Thailand | $18.38M | 7,773.81 |
| 27 | 🇾🇪 Yemen | $17.11M | 1,167.04 |
| 28 | 🇳🇱 Netherlands | $15.73M | 3,057.09 |
| 29 | 🇨🇺 Cuba | $15.67M | 7,452.37 |
| 30 | 🇩🇰 Denmark | $15.11M | 3,158.17 |
| 31 | 🇷🇸 Serbia | $15.10M | 2,693.89 |
| 32 | 🇵🇹 Portugal | $13.47M | 7,293.22 |
| 33 | 🇵🇰 Pakistan | $12.44M | 4,975.70 |
| 34 | 🇦🇹 Austria | $11.38M | 1,890.84 |
| 35 | 🇲🇩 Moldova | $8.99M | 3,416.76 |
| 36 | 🇱🇹 Lithuania | $8.49M | 3,126.86 |
| 37 | 🇪🇬 Egypt | $7.78M | 1,675.96 |
| 38 | 🇨🇱 Chile | $6.53M | 2,075.44 |
| 39 | 🇦🇪 United Arab Emirates | $5.76M | 2,371.64 |
| 40 | 🇷🇺 Russian Federation | $4.74M | 2,255.93 |
| 41 | 🇮🇪 Ireland | $4.62M | 758.02 |
| 42 | 🇨🇭 Switzerland | $4.07M | 406.04 |
| 43 | 🇲🇲 Myanmar | $3.98M | 3,160.46 |
| 44 | 🇬🇹 Guatemala | $3.87M | 1,414.63 |
| 45 | 🇸🇰 Slovakia | $3.58M | 921.78 |
| 46 | 🇨🇿 Czech Republic | $2.99M | 715.84 |
| 47 | 🇿🇦 South Africa | $2.87M | 753.00 |
| 48 | 🇸🇬 Singapore | $2.85M | 542.15 |
| 49 | 🇿🇲 Zambia | $2.79M | 951.16 |
| 50 | 🇸🇻 El Salvador | $2.10M | 841.85 |
| 51 | 🇰🇬 Kyrgyzstan | $1.95M | 451.50 |
| 52 | 🇳🇮 Nicaragua | $1.95M | 656.62 |
| 53 | 🇭🇰 China, Hong Kong SAR | $1.93M | 484.14 |
| 54 | 🇭🇷 Croatia | $1.91M | 401.69 |
| 55 | 🇸🇮 Slovenia | $1.77M | 293.55 |
| 56 | 🇴🇲 Oman | $1.75M | 454.27 |
| 57 | 🇸🇪 Sweden | $1.44M | 227.90 |
| 58 | 🇲🇾 Malaysia | $1.37M | 261.76 |
| 59 | 🇯🇵 Japan | $1.16M | 118.28 |
| 60 | 🇩🇴 Dominican Republic | $1.16M | 428.97 |
| 61 | 🇧🇦 Bosnia Herzegovina | $1.08M | 87.38 |
| 62 | 🇹🇿 Tanzania | $0.98M | 465.90 |
| 63 | 🇱🇻 Latvia | $0.97M | 256.66 |
| 64 | 🇰🇼 Kuwait | $0.86M | 93.03 |
| 65 | 🇳🇴 Norway | $0.86M | 175.08 |
| 66 | 🇮🇷 Iran | $0.86M | 357.86 |
| 67 | 🇱🇧 Lebanon | $0.85M | 111.91 |
| 68 | 🇮🇩 Indonesia | $0.77M | 238.68 |
| 69 | 🇪🇹 Ethiopia | $0.73M | 178.98 |
| 70 | 🇪🇪 Estonia | $0.73M | 292.60 |
| 71 | 🇲🇰 North Macedonia | $0.64M | 132.12 |
| 72 | 🇮🇱 Israel | $0.61M | 170.94 |
| 73 | 🇰🇿 Kazakhstan | $0.52M | 195.46 |
| 74 | 🇰🇪 Kenya | $0.50M | 97.58 |
| 75 | 🇧🇾 Belarus | $0.46M | 104.69 |
| 76 | 🇧🇩 Bangladesh | $0.38M | 178.15 |
| 77 | 🇲🇬 Madagascar | $0.35M | 80.65 |
| 78 | 🇱🇰 Sri Lanka | $0.31M | 28.10 |
| 79 | 🇸🇱 Sierra Leone | $0.29M | 96.19 |
| 80 | 🇵🇸 State of Palestine | $0.28M | 69.73 |
| 81 | 🇯🇴 Jordan | $0.27M | 44.21 |
| 82 | 🇸🇩 Sudan | $0.25M | 56.45 |
| 83 | 🇬🇪 Georgia | $0.25M | 65.61 |
| 84 | 🇲🇦 Morocco | $0.21M | 32.90 |
| 85 | 🇱🇺 Luxembourg | $0.19M | 26.71 |
| 86 | 🇱🇾 Libya | $0.18M | 25.45 |
| 87 | 🇦🇲 Armenia | $0.14M | 20.79 |
| 88 | 🇰🇷 Korea, Republic | $0.13M | 21.99 |
| 89 | 🇫🇮 Finland | $0.12M | 13.29 |
| 90 | 🇸🇾 Syria | $0.11M | 38.27 |
| 91 | 🇸🇷 Suriname | $0.10M | 37.96 |
| 92 | 🇺🇿 Uzbekistan | $0.08M | 37.11 |
| 93 | 🇦🇬 Antigua and Barbuda | $0.07M | 27.77 |
| 94 | 🇨🇾 Cyprus | $0.06M | 12.99 |
| 95 | 🇧🇯 Benin | $0.06M | 49.29 |
| 96 | 🇦🇱 Albania | $0.05M | 7.10 |
| 97 | 🇧🇳 Brunei Darussalam | $0.05M | 19.22 |
| 98 | 🇨🇴 Colombia | $0.05M | 13.97 |
| 99 | 🇶🇦 Qatar | $0.05M | 7.62 |
| 100 | 🇺🇬 Uganda | $0.04M | 10.70 |
| 101 | 🇼🇸 Samoa | $0.03M | 19.46 |
| 102 | 🇧🇫 Burkina Faso | $0.03M | 4.24 |
| 103 | 🇯🇲 Jamaica | $0.03M | 3.91 |
| 104 | 🇳🇵 Nepal | $0.03M | 7.50 |
| 105 | 🇲🇱 Mali | $0.03M | 75.58 |
| 106 | 🇹🇯 Tajikistan | $0.03M | 7.33 |
| 107 | 🇵🇭 Philippines | $0.03M | 4.27 |
| 108 | 🇲🇺 Mauritius | $0.03M | 1.99 |
| 109 | 🇧🇼 Botswana | $0.02M | 3.86 |
| 110 | 🇲🇿 Mozambique | $0.02M | 12.26 |
| 111 | 🇸🇿 Eswatini | $0.02M | 2.29 |
| 112 | 🇸🇳 Senegal | $0.02M | 22.56 |
| 113 | 🇵🇪 Peru | $0.02M | 2.80 |
| 114 | 🇮🇸 Iceland | $0.01M | 13.57 |
| 115 | 🇪🇨 Ecuador | $0.01M | 1.22 |
| 116 | 🇨🇲 Cameroon | $0.01M | 7.01 |
| 117 | 🇧🇭 Bahrain | $0.01M | 0.34 |
| 118 | 🇦🇿 Azerbaijan | $0.01M | 0.30 |
| 119 | 🇲🇴 China, Macao SAR | $0.01M | 0.81 |
| 120 | 🇭🇳 Honduras | $0.01M | 4.15 |
| 121 | 🇳🇨 New Caledonia | <$0.01M | 0.70 |
| 122 | 🇬🇭 Ghana | <$0.01M | 0.55 |
| 123 | 🇦🇫 Afghanistan | <$0.01M | 1.45 |
| 124 | 🇳🇬 Nigeria | <$0.01M | 1.77 |
| 125 | 🇬🇾 Guyana | <$0.01M | 1.66 |
| 126 | 🇲🇹 Malta | <$0.01M | 0.59 |
| 127 | 🇬🇳 Guinea | <$0.01M | 0.29 |
| 128 | 🇵🇳 Pitcairn | <$0.01M | 0.09 |
| 129 | 🇨🇮 Cote d'Ivoire | <$0.01M | 3.78 |
| 130 | 🇰🇭 Cambodia | <$0.01M | 0.58 |
| 131 | 🇹🇹 Trinidad and Tobago | <$0.01M | 0.07 |
| 132 | 🇨🇨 Cocos Islands | <$0.01M | 0.10 |
| 133 | 🇱🇨 Saint Lucia | <$0.01M | 0.17 |
| 134 | 🇷🇼 Rwanda | <$0.01M | 0.28 |
| 135 | 🇬🇩 Grenada | <$0.01M | 0.15 |
| 136 | 🇧🇮 Burundi | <$0.01M | 0.13 |
| 137 | 🇲🇳 Mongolia | <$0.01M | 0.11 |
| 138 | 🇦🇩 Andorra | <$0.01M | 0.06 |
| 139 | 🇧🇹 Bhutan | <$0.01M | 0.44 |
| 140 | 🇦🇼 Aruba | <$0.01M | 0.05 |
| 141 | 🇹🇳 Tunisia | <$0.01M | 0.20 |
| 142 | 🇵🇫 French Polynesia | <$0.01M | 0.04 |
| 143 | 🇲🇪 Montenegro | <$0.01M | 0.07 |
| 144 | 🇱🇸 Lesotho | <$0.01M | 0.02 |
| 145 | 🇩🇿 Algeria | <$0.01M | 0.01 |
| 146 | 🇧🇲 Bermuda | <$0.01M | 0.04 |
| 147 | 🇩🇯 Djibouti | <$0.01M | 0.07 |
| 148 | 🇸🇸 South Sudan | <$0.01M | 0.44 |
| 149 | 🇵🇦 Panama | <$0.01M | 0.01 |
| 150 | 🇬🇶 Equatorial Guinea | <$0.01M | 0.05 |
| 151 | 🇨🇷 Costa Rica | <$0.01M | 0.01 |
| 152 | 🇫🇯 Fiji | <$0.01M | 0.01 |
| 153 | 🇹🇩 Chad | <$0.01M | 0.04 |
| 154 | 🇹🇱 Timor-Leste | <$0.01M | 0.05 |
| 155 | 🇵🇬 Papua New Guinea | <$0.01M | 0.01 |
| 156 | 🇸🇴 Somalia | <$0.01M | 0.02 |
| 157 | 🇱🇦 Lao PDR | <$0.01M | 0.01 |
| 158 | 🇨🇬 Congo, Republic | <$0.01M | 0.01 |
| 159 | 🇲🇼 Malawi | <$0.01M | 0.03 |
| 160 | 🇨🇩 Congo, Democratic Republic | <$0.01M | 0.00 |
| 161 | 🇮🇶 Iraq | <$0.01M | 0.00 |
| 162 | 🇵🇾 Paraguay | <$0.01M | 0.01 |
| 163 | 🇨🇫 Central African Republic | <$0.01M | 0.08 |
| 164 | 🇬🇲 Gambia | <$0.01M | 0.00 |
| 165 | 🇳🇦 Namibia | <$0.01M | 0.00 |
| 166 | 🇹🇬 Togo | <$0.01M | 0.00 |
| 167 | 🇲🇻 Maldives | <$0.01M | 0.00 |
In the span between 2000 and 2020, agricultural powerhouses such as China, Argentina, and Ukraine consistently maintained their position as the top honey producers in the world. These nations exported thousands of tonnes of honey globally.
In fact, China continued to hold the position of the number one honey producer in pure volume terms in 2020.
However, New Zealand’s sought-after and expensive Mānuka honey put it far ahead of China and other countries in export value, despite not being anywhere near the largest exporter by volume.
What is Mānuka Honey?
Mānuka honey is produced by bees that collect nectar from Mānuka trees found only in New Zealand and some parts of Australia.
Known for its unique antibacterial and tissue regeneration properties, Mānuka honey has become highly coveted. In some countries it can sell for up to $400 per kilogram.
In 2020, New Zealand earned over $333 million through its honey exports. Most of this honey was imported by Asian nations including Singapore, China, Japan, Indonesia, and Hong Kong.
A Sticky Future for Honey Trade
The production of honey worldwide relies on the bees and the trees, both of which are under threat as the climate changes.
While floods devastated bee colonies in some parts of the world, bushfires and disease are affecting honeybee habitats in others, posing a major threat to the future of honey production.

This article was published as a part of Visual Capitalist's Creator Program, which features data-driven visuals from some of our favorite Creators around the world.


Economy
Economic Growth Forecasts for G7 and BRICS Countries in 2024
The IMF has released its economic growth forecasts for 2024. How do the G7 and BRICS countries compare?


G7 & BRICS Real GDP Growth Forecasts for 2024
The International Monetary Fund’s (IMF) has released its real gross domestic product (GDP) growth forecasts for 2024, and while global growth is projected to stay steady at 3.2%, various major nations are seeing declining forecasts.
This chart visualizes the 2024 real GDP growth forecasts using data from the IMF’s 2024 World Economic Outlook for G7 and BRICS member nations along with Saudi Arabia, which is still considering an invitation to join the bloc.
Get the Key Insights of the IMF’s World Economic Outlook
Want a visual breakdown of the insights from the IMF’s 2024 World Economic Outlook report?
This visual is part of a special dispatch of the key takeaways exclusively for VC+ members.
Get the full dispatch of charts by signing up to VC+.
Mixed Economic Growth Prospects for Major Nations in 2024
Economic growth projections by the IMF for major nations are mixed, with the majority of G7 and BRICS countries forecasted to have slower growth in 2024 compared to 2023.
Only three BRICS-invited or member countries, Saudi Arabia, the UAE, and South Africa, have higher projected real GDP growth rates in 2024 than last year.
| Group | Country | Real GDP Growth (2023) | Real GDP Growth (2024P) |
|---|---|---|---|
| G7 | 🇺🇸 U.S. | 2.5% | 2.7% |
| G7 | 🇨🇦 Canada | 1.1% | 1.2% |
| G7 | 🇯🇵 Japan | 1.9% | 0.9% |
| G7 | 🇫🇷 France | 0.9% | 0.7% |
| G7 | 🇮🇹 Italy | 0.9% | 0.7% |
| G7 | 🇬🇧 UK | 0.1% | 0.5% |
| G7 | 🇩🇪 Germany | -0.3% | 0.2% |
| BRICS | 🇮🇳 India | 7.8% | 6.8% |
| BRICS | 🇨🇳 China | 5.2% | 4.6% |
| BRICS | 🇦🇪 UAE | 3.4% | 3.5% |
| BRICS | 🇮🇷 Iran | 4.7% | 3.3% |
| BRICS | 🇷🇺 Russia | 3.6% | 3.2% |
| BRICS | 🇪🇬 Egypt | 3.8% | 3.0% |
| BRICS-invited | 🇸🇦 Saudi Arabia | -0.8% | 2.6% |
| BRICS | 🇧🇷 Brazil | 2.9% | 2.2% |
| BRICS | 🇿🇦 South Africa | 0.6% | 0.9% |
| BRICS | 🇪🇹 Ethiopia | 7.2% | 6.2% |
| 🌍 World | 3.2% | 3.2% |
China and India are forecasted to maintain relatively high growth rates in 2024 at 4.6% and 6.8% respectively, but compared to the previous year, China is growing 0.6 percentage points slower while India is an entire percentage point slower.
On the other hand, four G7 nations are set to grow faster than last year, which includes Germany making its comeback from its negative real GDP growth of -0.3% in 2023.
Faster Growth for BRICS than G7 Nations
Despite mostly lower growth forecasts in 2024 compared to 2023, BRICS nations still have a significantly higher average growth forecast at 3.6% compared to the G7 average of 1%.
While the G7 countries’ combined GDP is around $15 trillion greater than the BRICS nations, with continued higher growth rates and the potential to add more members, BRICS looks likely to overtake the G7 in economic size within two decades.
BRICS Expansion Stutters Before October 2024 Summit
BRICS’ recent expansion has stuttered slightly, as Argentina’s newly-elected president Javier Milei declined its invitation and Saudi Arabia clarified that the country is still considering its invitation and has not joined BRICS yet.
Even with these initial growing pains, South Africa’s Foreign Minister Naledi Pandor told reporters in February that 34 different countries have submitted applications to join the growing BRICS bloc.
Any changes to the group are likely to be announced leading up to or at the 2024 BRICS summit which takes place October 22-24 in Kazan, Russia.
Get the Full Analysis of the IMF’s Outlook on VC+
This visual is part of an exclusive special dispatch for VC+ members which breaks down the key takeaways from the IMF’s 2024 World Economic Outlook.
For the full set of charts and analysis, sign up for VC+.

-

 Debt1 week ago
How Debt-to-GDP Ratios Have Changed Since 2000
-

 Markets2 weeks ago
Ranked: The World’s Top Flight Routes, by Revenue
-

 Countries2 weeks ago
Population Projections: The World’s 6 Largest Countries in 2075
-

 Markets2 weeks ago
The Top 10 States by Real GDP Growth in 2023
-

 Demographics2 weeks ago
The Smallest Gender Wage Gaps in OECD Countries
-

 United States2 weeks ago
Where U.S. Inflation Hit the Hardest in March 2024
-

 Green2 weeks ago
Top Countries By Forest Growth Since 2001
-

 United States2 weeks ago
Ranked: The Largest U.S. Corporations by Number of Employees