GDP
Top 10 Countries By GDP Per Capita, by Region
Article/Editing:
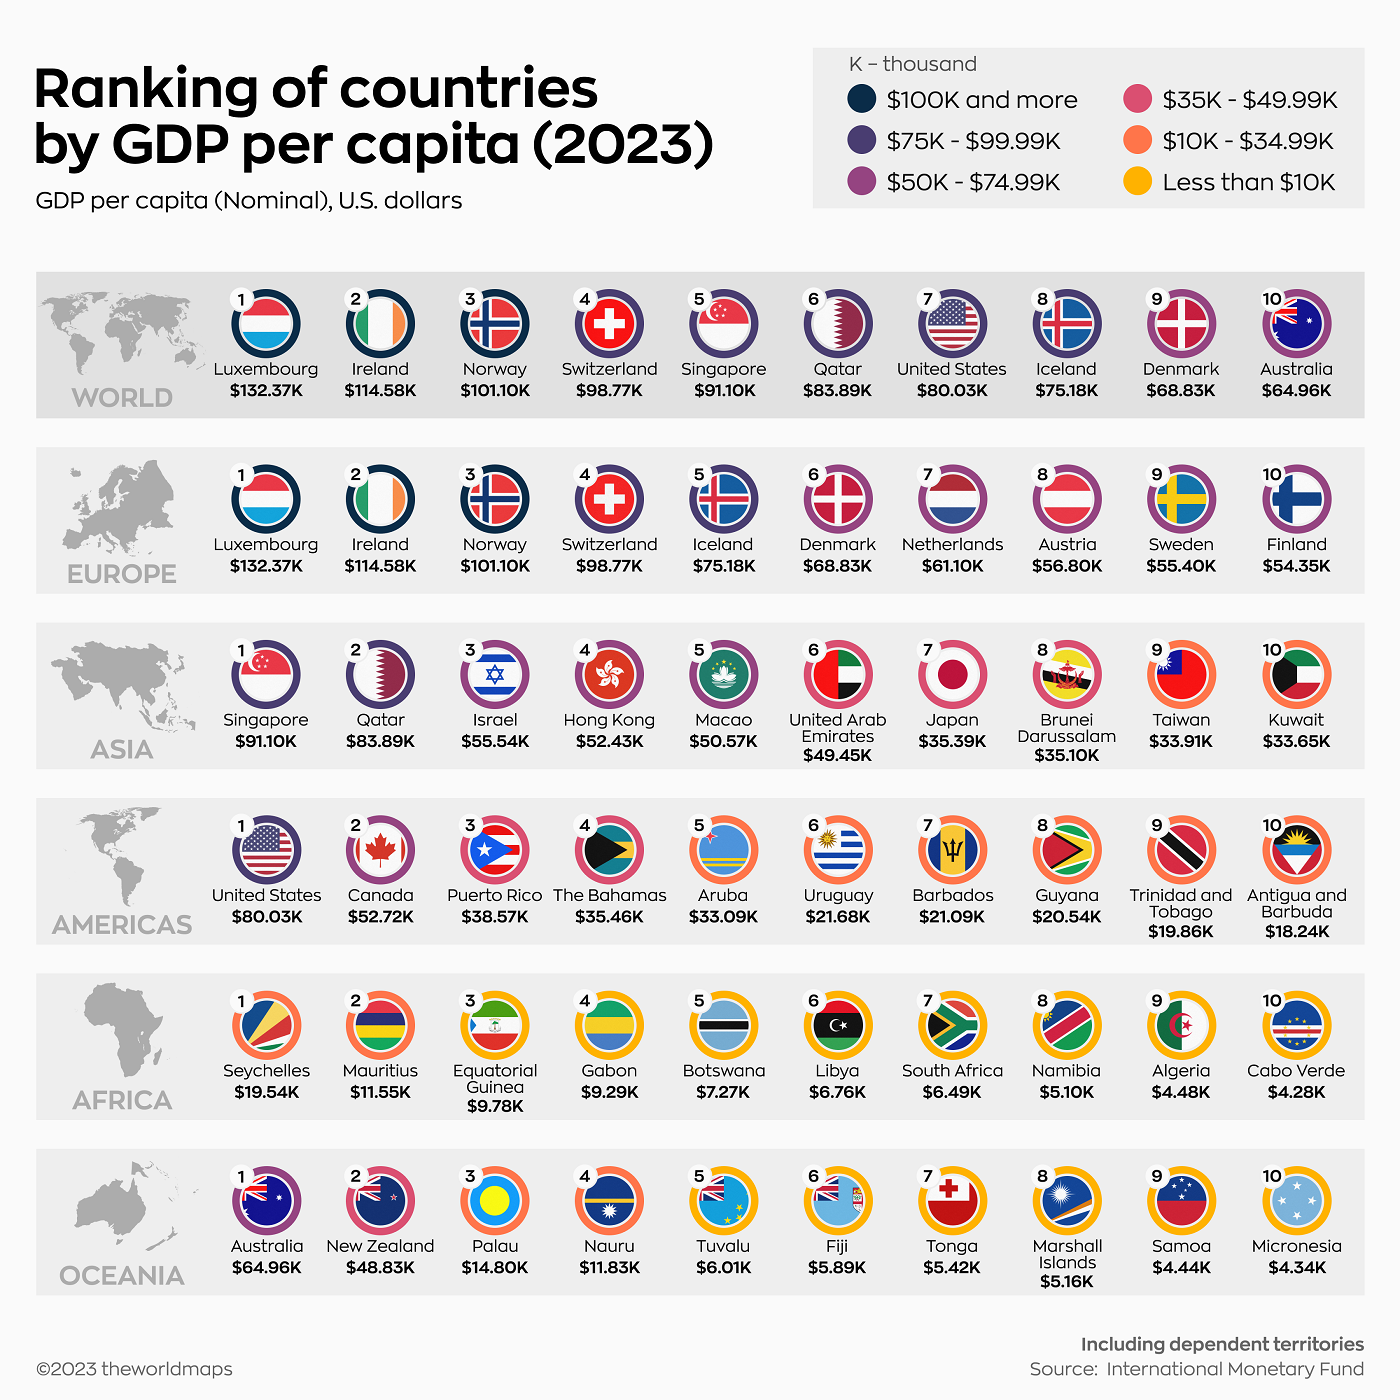
Top 10 Countries by GDP Per Capita in 2023
There are many ways to measure different economies against one another, but comparing countries by GDP per capita remains one of the most tried-and-true methods.
GDP per capita attempts to level the playing field by dividing a country’s economic output by its population, effectively giving the average GDP per person. A higher per capita GDP generally corresponds to higher income, consumption levels, and standards of living.
The simplicity of this metric also makes it useful for economists and policymakers to communicate levels of economic well-being to the public.
The above graphic from theWORLDMAPS ranks the top 10 countries by per capita GDP in different regions, using data from the International Monetary Fund (IMF).
Top 10 Countries by GDP Per Capita in the World
Here are the top 10 countries with the highest nominal GDP per capita in the world in 2023, measured in U.S. dollars:
| Rank | Country | GDP per Capita | Region |
|---|---|---|---|
| 1 | 🇱🇺 Luxembourg | $132,370 | Europe |
| 2 | 🇮🇪 Ireland | $114,580 | Europe |
| 3 | 🇳🇴 Norway | $101,100 | Europe |
| 4 | 🇨🇭 Switzerland | $98,770 | Europe |
| 5 | 🇸🇬 Singapore | $91,100 | Asia |
| 6 | 🇶🇦 Qatar | $83,890 | Asia |
| 7 | 🇺🇸 U.S. | $80,030 | Americas |
| 8 | 🇮🇸 Iceland | $75,180 | Europe |
| 9 | 🇩🇰 Denmark | $68,830 | Europe |
| 10 | 🇦🇺 Australia | $64,960 | Oceania |
Luxembourg, Ireland, and Norway lead the ranking with more than $100,000 in GDP per capita. Luxembourg is a key financial services center in Europe, Ireland is headquarters to many multinational corporations, and Norway is one of the largest energy exporters in the region, explaining their relative prosperity.
Wealthy countries with smaller populations tend to make up the world’s richest ranks. According to the IMF, Luxembourg only has slightly more than 600,000 people which would be a small city in more populous countries. In fact, in the top 10, only the U.S. and Australia have a population of more than 10 million.
Introducing Purchasing Power Parity
One of the major drawbacks of using GDP per capita is that it doesn’t account for the strength of the local currency versus its exchange rate, the latter of which is heavily influenced by investment flows and demand for the national currency.
Non-tradable goods in a country (haircuts, local transport, schools, etc.) do not get valued when using an exchange-rate conversion. It also doesn’t account for the price differences between countries—for example, fresh vegetables in India are far cheaper than in Canada.
To solve this problem, economists utilize purchasing power parity (PPP) indexes. A key element of these indexes is that they remove these price differences and convert into a common currency in order to show relative economic prosperity. Popular examples are The Economist’s Big Mac index and the Wall Street Journal’s Latte Index.
Nominal vs. PPP-adjusted GDP Per Capita
In the case of GDP, PPP measurements use an “international dollar” which can buy the same amount of goods in any given country as a U.S. dollar could buy in America.
Click to view this graphic in a higher-resolution.
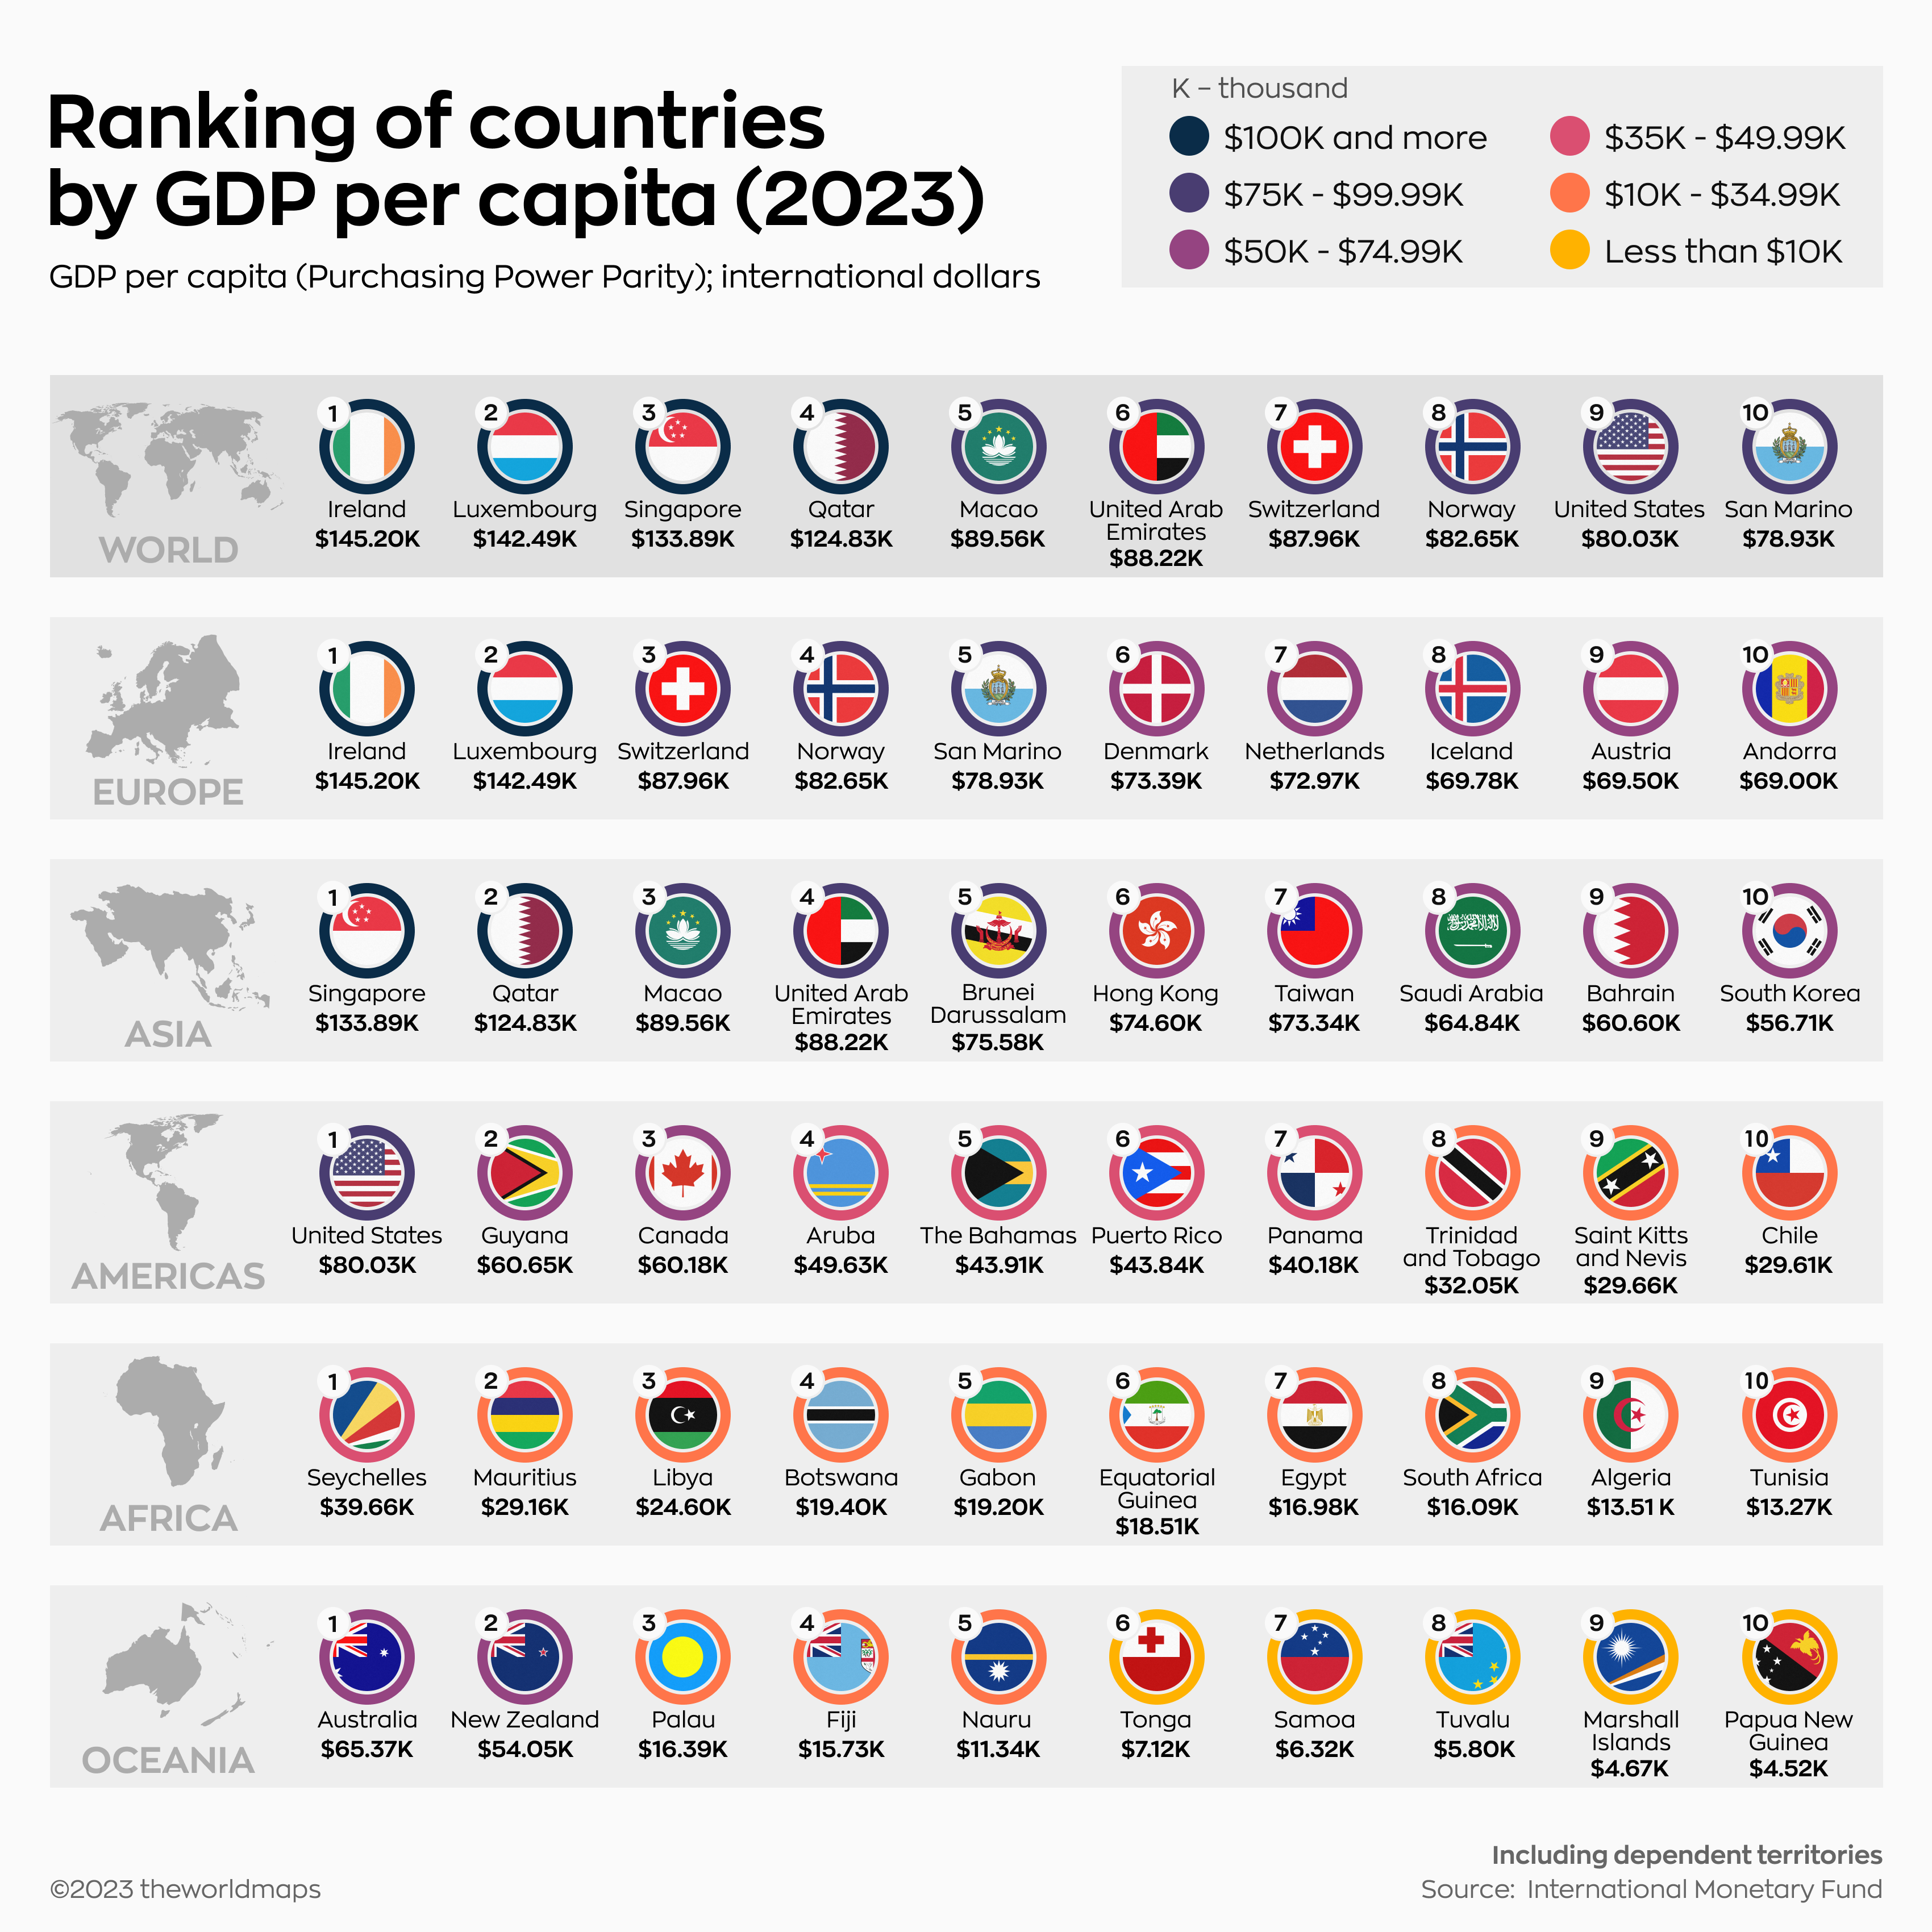
Immediately, there are a few noticeable differences in the top 10 countries by GDP per capita when adjusted for PPP. For one, most countries’ values have increased from their nominal value (except for the U.S. since it is the benchmark).
| Rank | Country | GDP per Capita (PPP) | Region |
|---|---|---|---|
| 1 | 🇮🇪 Ireland | $145,200 | Europe |
| 2 | 🇱🇺 Luxembourg | $142,490 | Europe |
| 3 | 🇸🇬 Singapore | $133,890 | Asia |
| 4 | 🇶🇦 Qatar | $124,830 | Asia |
| 5 | 🇲🇴 Macao | $89,560 | Asia |
| 6 | 🇦🇪 UAE | $88,220 | Asia |
| 7 | 🇨🇭 Switzerland | $87,960 | Europe |
| 8 | 🇳🇴 Norway | $82,650 | Europe |
| 9 | 🇺🇸 U.S. | $80,030 | Americas |
| 10 | 🇸🇲 San Marino | $78,930 | Europe |
Some countries have switched ranks in the top 10, such as Ireland and Luxembourg. Others have been replaced all together, with Iceland, Denmark, and Australia falling out of the top 10, replaced by Macao, the UAE, and San Marino.
We can also see how the different calculations of GDP per capita affect the rankings in other regions:
| Rank (PPP) | Region | Country | PPP (Intl $) | Nominal ($) |
|---|---|---|---|---|
| 1 | Americas | 🇺🇸 United States | $80,030 | $80,030 |
| 2 | Americas | 🇬🇾 Guyana | $60,650 | $20,540 |
| 3 | Americas | 🇨🇦 Canada | $60,180 | $52,720 |
| 4 | Americas | 🇦🇼 Aruba | $49,630 | $33,090 |
| 5 | Americas | 🇧🇸 The Bahamas | $43,910 | $35,460 |
| 6 | Americas | 🇵🇷 Puerto Rico | $43,840 | $38,570 |
| 7 | Americas | 🇵🇦 Panama | $40,180 | $17,350 |
| 8 | Americas | 🇹🇹 Trinidad & Tobago | $32,050 | $19,860 |
| 9 | Americas | 🇰🇳 Saint Kitts & Nevis | $29,660 | $17,860 |
| 10 | Americas | 🇨🇱 Chile | $29,610 | $17,830 |
| 1 | Africa | 🇸🇨 Seychelles | $39,660 | $19,540 |
| 2 | Africa | 🇲🇺 Mauritius | $29,160 | $11,550 |
| 3 | Africa | 🇱🇾 Libya | $24,600 | $6,760 |
| 4 | Africa | 🇧🇼 Botswana | $19,400 | $7,270 |
| 5 | Africa | 🇬🇦 Gabon | $19,200 | $9,290 |
| 6 | Africa | 🇬🇶 Equatorial Guinea | $18,510 | $9,780 |
| 7 | Africa | 🇪🇬 Egypt | $16,980 | $3,640 |
| 8 | Africa | 🇿🇦 South Africa | $16,090 | $6,490 |
| 9 | Africa | 🇩🇿 Algeria | $13,510 | $4,480 |
| 10 | Africa | 🇹🇳 Tunisia | $13,270 | $4,070 |
| 1 | Asia | 🇸🇬 Singapore | $133,890 | $91,100 |
| 2 | Asia | 🇶🇦 Qatar | $124,830 | $83,890 |
| 3 | Asia | 🇲🇴 Macao SAR | $89,560 | $50,570 |
| 4 | Asia | 🇦🇪 United Arab Emirates | $88,220 | $49,450 |
| 5 | Asia | 🇧🇳 Brunei Darussalam | $75,580 | $35,100 |
| 6 | Asia | 🇭🇰 Hong Kong SAR | $74,600 | $52,430 |
| 7 | Asia | 🇹🇼 Taiwan | $73,340 | $33,910 |
| 8 | Asia | 🇸🇦 Saudi Arabia | $64,840 | $29,920 |
| 9 | Asia | 🇧🇭 Bahrain | $60,600 | $28,390 |
| 10 | Asia | 🇰🇷 South Korea | $56,710 | $33,390 |
| 1 | Europe | 🇮🇪 Ireland | $145,200 | $114,580 |
| 2 | Europe | 🇱🇺 Luxembourg | $142,490 | $132,370 |
| 3 | Europe | 🇨🇭 Switzerland | $87,960 | $98,770 |
| 4 | Europe | 🇳🇴 Norway | $82,650 | $101,100 |
| 5 | Europe | 🇸🇲 San Marino | $78,930 | $52,950 |
| 6 | Europe | 🇩🇰 Denmark | $73,390 | $68,830 |
| 7 | Europe | 🇳🇱 Netherlands | $72,970 | $61,100 |
| 8 | Europe | 🇮🇸 Iceland | $69,780 | $75,180 |
| 9 | Europe | 🇦🇹 Austria | $69,500 | $56,800 |
| 10 | Europe | 🇦🇩 Andorra | $69,000 | $44,390 |
| 1 | Oceania | 🇦🇺 Australia | $65,370 | $64,960 |
| 2 | Oceania | 🇳🇿 New Zealand | $54,050 | $48,830 |
| 3 | Oceania | 🇵🇼 Palau | $16,390 | $14,800 |
| 4 | Oceania | 🇫🇯 Fiji | $15,730 | $5,890 |
| 5 | Oceania | 🇳🇷 Nauru | $11,340 | $11,830 |
| 6 | Oceania | 🇹🇴 Tonga | $7,120 | $5,420 |
| 7 | Oceania | 🇼🇸 Samoa | $6,320 | $4,440 |
| 8 | Oceania | 🇹🇻 Tuvalu | $5,800 | $6,010 |
| 9 | Oceania | 🇲🇭 Marshall Islands | $4,670 | $5,160 |
| 10 | Oceania | 🇵🇬 Papua New Guinea | $4,520 | $3,520 |
The Americas and Europe
The U.S. leads the Americas in both nominal and PPP-adjusted per capita GDP. However, Canada drops to 3rd place under the new metric, overtaken by Guyana.
In Europe, the usual suspects in the world’s top 10 populate most of the region’s ranks. However, Andorra slides in at 10th in Europe’s richest countries by GDP per capita (PPP). Andorra in particular benefits from its status as a free economic zone—very low or no taxes—and being a tourism hotspot with the sector contributing 80% to its economy.
Asia
Singapore, Qatar, Macao, the UAE, and Hong Kong claim top spots as Asia’s richest countries on both lists. Qatar and the UAE benefit from oil being a key export of the region, while Singapore and
On the other hand, Israel and Japan drop out of the richest countries in Asia when using PPP calculations, with countries like Saudi Arabia and Bahrain edging them out.
Africa and Oceania
The island nations of Seychelles and Mauritius lead the ranks of countries by GDP per capita in both nominal and PPP categories on the African continent, also thanks to their booming tourism industries.
Traditional African economic heavyweight South Africa also features in this list of Africa’s richest. But Egypt, the region’s third largest economy, only makes the top 10 countries by GDP when adjusted for PPP, otherwise weighed down by its large population.
And in Oceania, adjusting GDP for purchasing power doesn’t have much effect on the sizable gap between Australia and New Zealand and their smaller island neighbors. But some local economies are noticeably stronger when adjusting for PPP, especially Fiji‘s, which has a GDP per capita (PPP) three times bigger than its nominal value.
The Drawbacks of GDP Per Capita
GDP per capita is a useful measure, but it also comes with its own set of caveats.
For one, it is a measurement of economic output per person, not individual income or household savings. That gives it clear limitations in certain cases, such as in Ireland, where the presence of multinational corporations obfuscates the general output per person.
Secondly, countries with smaller populations do better in the rankings. Most of the world’s biggest economies (China, India, UK, France) do not find themselves in the top 10 ranks.
Finally, other metrics for a good standard of living, some of them intangible in economic terms—human rights, freedom of expression—are not accounted for at all.

This article was published as a part of Visual Capitalist's Creator Program, which features data-driven visuals from some of our favorite Creators around the world.


Markets
Visualizing U.S. GDP by Industry in 2023
Services-producing industries account for the majority of U.S. GDP in 2023, followed by other private industries and the government.
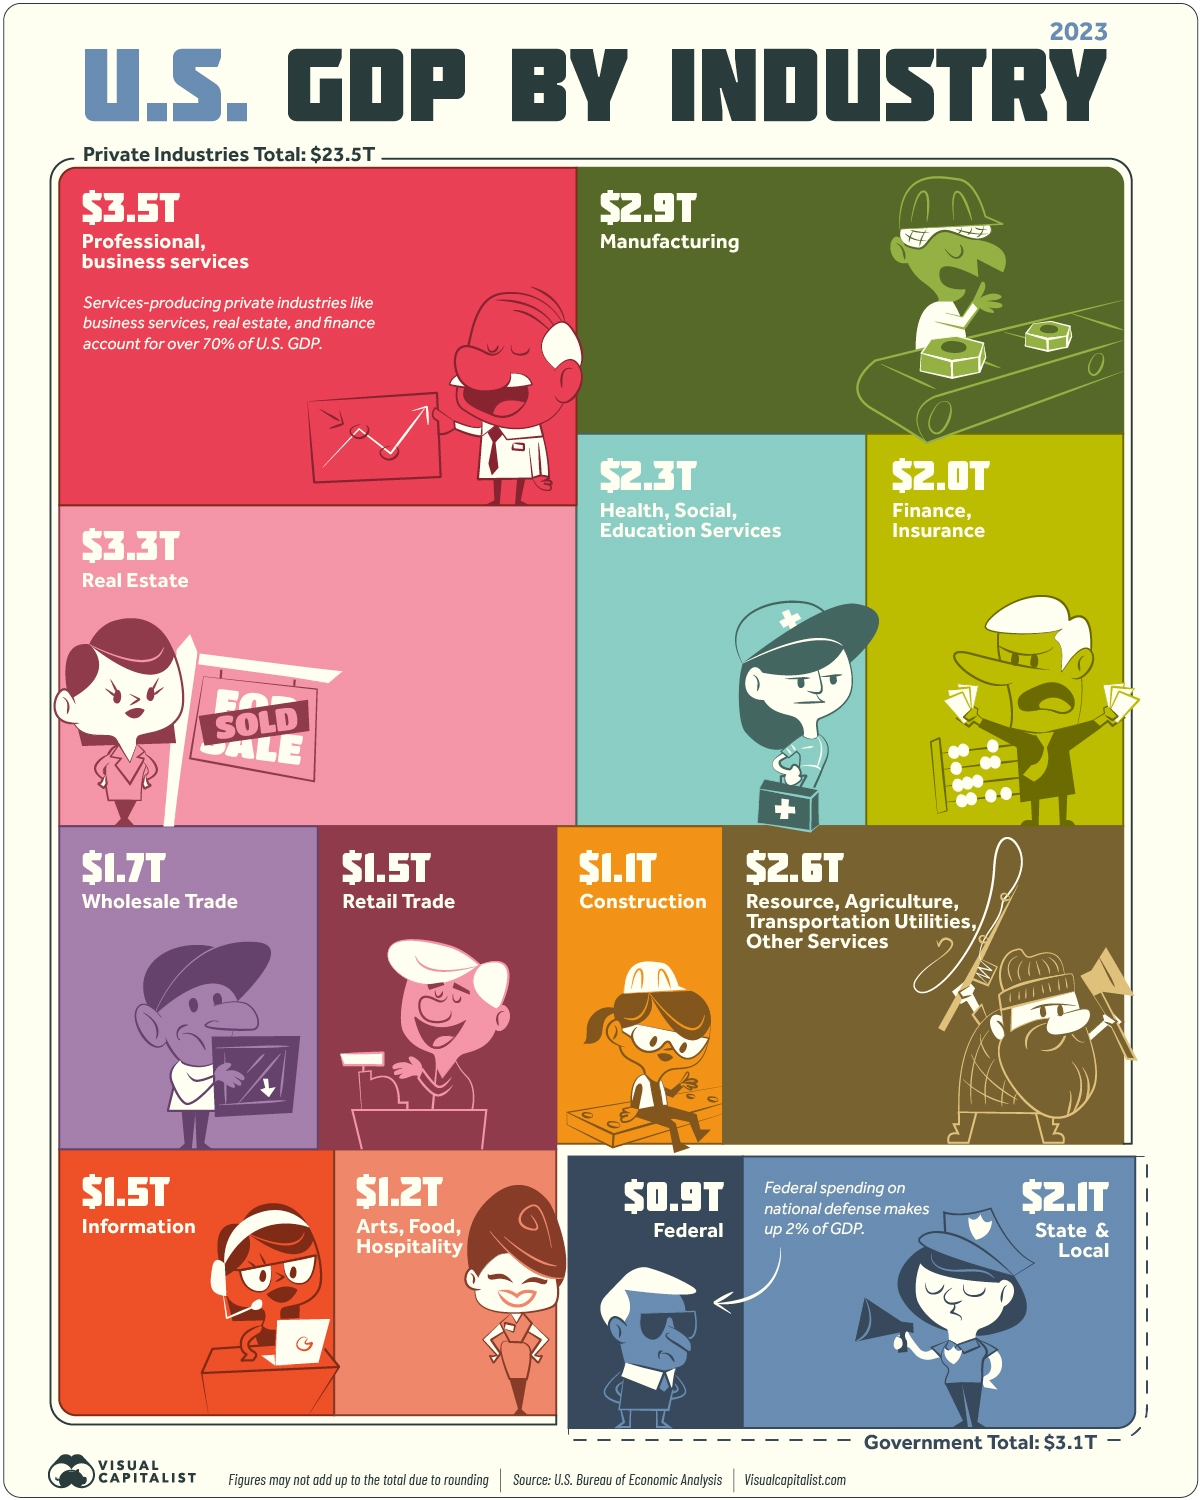

Visualizing U.S. GDP by Industry
The U.S. economy is like a giant machine driven by many different industries, each one akin to an essential cog that moves the whole.
Understanding the breakdown of national gross domestic product (GDP) by industry shows where commercial activity is bustling and how diverse the economy truly is.
The above infographic uses data from the Bureau of Economic Analysis to visualize a breakdown of U.S. GDP by industry in 2023. To show this, we use value added by industry, which reflects the difference between gross output and the cost of intermediate inputs.
The Top 10 U.S. Industries by GDP
As of Q1 2023, the annualized GDP of the U.S. sits at $26.5 trillion.
Of this, 88% or $23.5 trillion comes from private industries. The remaining $3 trillion is government spending at the federal, state, and local levels.
Here’s a look at the largest private industries by economic contribution in the United States:
| Industry | Annualized Nominal GDP (as of Q1 2023) | % of U.S. GDP |
|---|---|---|
| Professional and business services | $3.5T | 13% |
| Real estate, rental, and leasing | $3.3T | 12% |
| Manufacturing | $2.9T | 11% |
| Educational services, health care, and social assistance | $2.3T | 9% |
| Finance and insurance | $2.0T | 8% |
| Wholesale trade | $1.7T | 6% |
| Retail trade | $1.5T | 6% |
| Information | $1.5T | 6% |
| Arts, entertainment, recreation, accommodation, and food services | $1.2T | 4% |
| Construction | $1.1T | 4% |
| Other private industries | $2.6T | 10% |
| Total | $23.5T | 88% |
Like most other developed nations, the U.S. economy is largely based on services.
Service-based industries, including professional and business services, real estate, finance, and health care, make up the bulk (70%) of U.S. GDP. In comparison, goods-producing industries like agriculture, manufacturing, mining, and construction play a smaller role.
Professional and business services is the largest industry with $3.5 trillion in value added. It comprises establishments providing legal, consulting, design, administration, and other services. This is followed by real estate at $3.3 trillion, which has consistently been an integral part of the economy.
Due to outsourcing and other factors, the manufacturing industry’s share of GDP has been declining for decades, but it still remains a significant part of the economy. Manufacturing of durable goods (metals, machines, computers) accounts for $1.6 trillion in value added, alongside nondurable goods (food, petroleum, chemicals) at $1.3 trillion.
The Government’s Contribution to GDP
Just like private industries, the government’s value added to GDP consists of compensation of employees, taxes collected (less subsidies), and gross operating surplus.
| Government | Annualized Nominal GDP (as of Q1 2023) | % of U.S. GDP |
|---|---|---|
| State and Local | $2.1T | 8% |
| Federal | $0.9T | 4% |
| Total | $3.1T | 12% |
Figures may not add up to the total due to rounding.
State and local government spending, largely focused on the education and public welfare sectors, accounts for the bulk of value added. The Federal contribution to GDP amounts to roughly $948 billion, with 52% of it attributed to national defense.
The Fastest Growing Industries (2022–2032P)
In the next 10 years, services-producing industries are projected to see the fastest growth in output.
The table below shows the five fastest-growing industries in the U.S. from 2022–2032 in terms of total output, based on data from the Bureau of Labor Statistics:
| Industry | Sector | Compound Annual Rate of Output Growth (2022–2032P) |
|---|---|---|
| Software publishers | Information | 5.2% |
| Computing infrastructure providers, data processing, and related services | Information | 3.9% |
| Wireless telecommunications carriers (except satellite) | Information | 3.6% |
| Home health care services | Health care and social assistance | 3.6% |
| Oil and gas extraction | Mining | 3.5% |
Three of the fastest-growing industries are in the information sector, underscoring the growing role of technology and digital infrastructure. Meanwhile, the projected growth of the oil and gas extraction industry highlights the enduring demand for traditional energy sources, despite the energy transition.
Overall, the development of these industries suggests that the U.S. will continue its shift toward a services-oriented economy. But today, it’s also worth noticing how services- and goods-producing industries are increasingly tied together. For example, it’s now common for tech companies to produce devices, and for manufacturers to use software in their operations.
Therefore, the oncoming tide of growth in service-based industries could potentially lift other interconnected sectors of the diverse U.S. economy.

-

 Debt1 week ago
How Debt-to-GDP Ratios Have Changed Since 2000
-

 Countries2 weeks ago
Population Projections: The World’s 6 Largest Countries in 2075
-

 Markets2 weeks ago
The Top 10 States by Real GDP Growth in 2023
-

 Demographics2 weeks ago
The Smallest Gender Wage Gaps in OECD Countries
-

 United States2 weeks ago
Where U.S. Inflation Hit the Hardest in March 2024
-

 Green2 weeks ago
Top Countries By Forest Growth Since 2001
-

 United States2 weeks ago
Ranked: The Largest U.S. Corporations by Number of Employees
-

 Maps2 weeks ago
The Largest Earthquakes in the New York Area (1970-2024)