Markets
The Top 100 Most Valuable Brands in 2024
![]() See this visualization first on the Voronoi app.
See this visualization first on the Voronoi app.
The Top 100 Most Valuable Brands in 2024
This was originally posted on our Voronoi app. Download the app for free on iOS or Android and discover incredible data-driven charts from a variety of trusted sources.
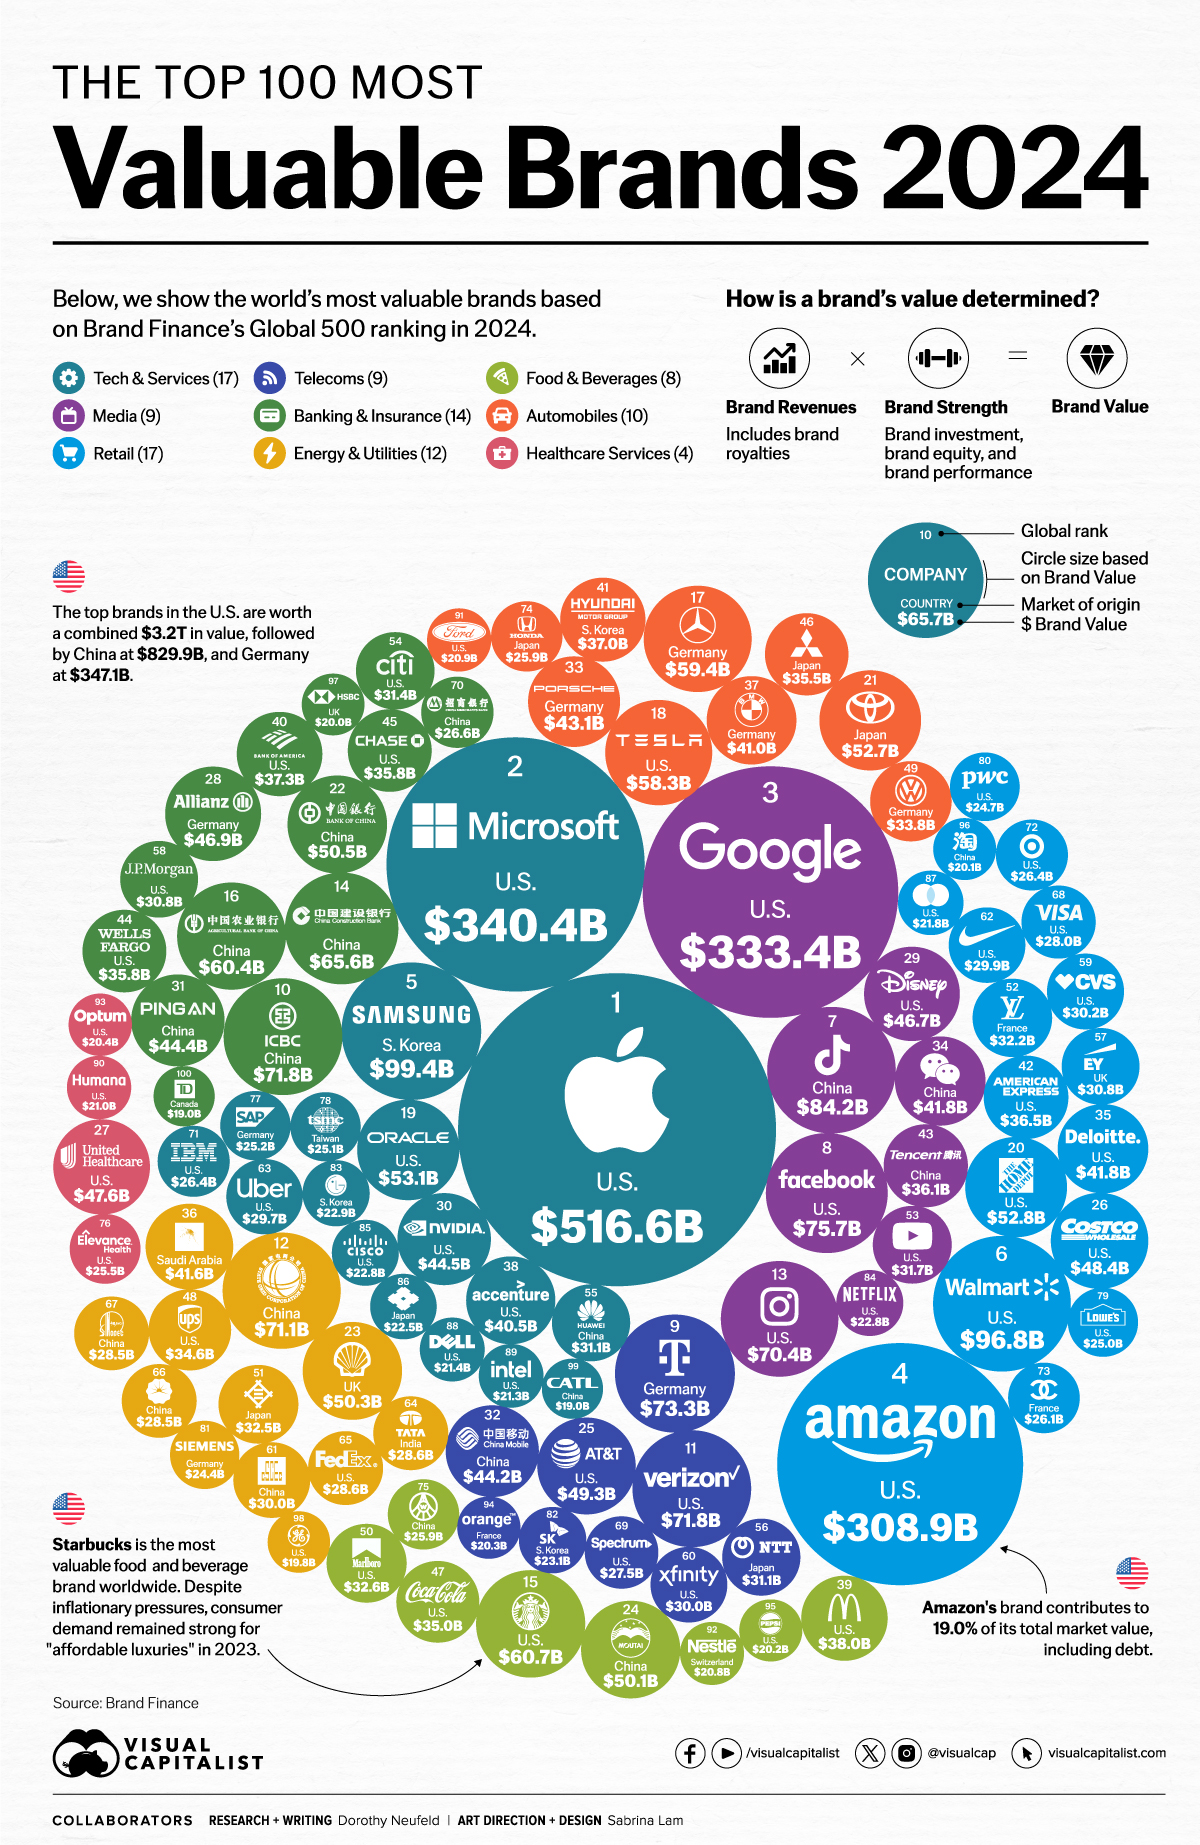
Together, the 100 most valuable brands in the world are worth more than $5 trillion.
Brands play an important role in driving shareholder value, yet pinpointing how much a brand is worth can be challenging. Investments in brand could pay dividends for many decades, but because those financial benefits are fairly open to interpretation, most financial regulators don’t usually accept brand assets on balance sheets.
To look at it another way, Apple is missing one of its most valuable assets on its financial reporting—a brand worth $516.6 billion.
This visualization ranks the top 100 brands by brand value, based on the annual global ranking from Brand Finance.
How Do You Value a Brand?
Overall, a brand’s value was calculated by the degree that it generated profits for the company. Brand Finance analyzed individual companies along with their subsidiaries, like in the case of Meta which owns Instagram and WhatsApp.
More details on the methodology can be found at the end of this article.
Ranking the Top Brands, by Value
Here are the most valuable brands globally in 2024:
| Ranking 2024 | Name | Country | Value | Annual Change |
|---|---|---|---|---|
| 1 | Apple | 🇺🇸 U.S. | $516.6B | +73.6% |
| 2 | Microsoft | 🇺🇸 U.S. | $340.4B | +77.7% |
| 3 | 🇺🇸 U.S. | $333.4B | +18.5% | |
| 4 | Amazon | 🇺🇸 U.S. | $308.9B | +3.2% |
| 5 | Samsung Group | 🇰🇷 South Korea | $99.4B | -0.3% |
| 6 | Walmart | 🇺🇸 U.S. | $96.8B | -14.9% |
| 7 | TikTok/Douyin | 🇨🇳 China | $84.2B | +28.2% |
| 8 | 🇺🇸 U.S. | $75.7B | +28.4% | |
| 9 | Deutsche Telekom | 🇩🇪 Germany | $73.3B | +16.5% |
| 10 | ICBC | 🇨🇳 China | $71.8B | +3.3% |
| 11 | Verizon | 🇺🇸 U.S. | $71.8B | +6.4% |
| 12 | State Grid Corporation of China | 🇨🇳 China | $71.1B | +20.9% |
| 13 | 🇺🇸 U.S. | $70.4B | +48.5% | |
| 14 | China Construction Bank | 🇨🇳 China | $65.6B | +4.7% |
| 15 | Starbucks | 🇺🇸 U.S. | $60.7B | +13.5% |
| 16 | Agricultural Bank Of China | 🇨🇳 China | $60.4B | +4.7% |
| 17 | Mercedes-Benz | 🇩🇪 Germany | $59.4B | +1.1% |
| 18 | Tesla | 🇺🇸 U.S. | $58.3B | -12.0% |
| 19 | Oracle | 🇺🇸 U.S. | $53.1B | +34.2% |
| 20 | Home Depot | 🇺🇸 U.S. | $52.8B | -13.6% |
| 21 | Toyota | 🇯🇵 Japan | $52.7B | +0.3% |
| 22 | Bank of China | 🇨🇳 China | $50.5B | +6.6% |
| 23 | Shell | 🇬🇧 UK | $50.3B | +4.3% |
| 24 | Moutai | 🇨🇳 China | $50.1B | +0.7% |
| 25 | AT&T | 🇺🇸 U.S. | $49.3B | -0.7% |
| 26 | Costco | 🇺🇸 U.S. | $48.4B | +3.9% |
| 27 | UnitedHealthcare | 🇺🇸 U.S. | $47.6B | +28.4% |
| 28 | Allianz Group | 🇩🇪 Germany | $46.9B | -3.0% |
| 29 | Disney | 🇺🇸 U.S. | $46.7B | -5.6% |
| 30 | Nvidia | 🇺🇸 U.S. | $44.5B | +162.9% |
| 31 | Ping An | 🇨🇳 China | $44.4B | -0.7% |
| 32 | China Mobile | 🇨🇳 China | $44.2B | +2.0% |
| 33 | Porsche | 🇩🇪 Germany | $43.1B | +17.3% |
| 34 | 🇨🇳 China | $41.8B | -16.8% | |
| 35 | Deloitte | 🇺🇸 U.S. | $41.8B | +21.0% |
| 36 | Aramco | 🇸🇦 Saudi Arabia | $41.6B | -8.1% |
| 37 | BMW | 🇩🇪 Germany | $41.0B | +1.5% |
| 38 | accenture | 🇮🇪 Ireland | $40.5B | +1.6% |
| 39 | McDonald's | 🇺🇸 U.S. | $38.0B | +3.1% |
| 40 | Bank of America | 🇺🇸 U.S. | $37.3B | -3.6% |
| 41 | Hyundai Group | 🇰🇷 South Korea | $37.0B | +35.6% |
| 42 | American Express | 🇺🇸 U.S. | $36.5B | +7.0% |
| 43 | Tencent | 🇨🇳 China | $36.1B | -5.3% |
| 44 | Wells Fargo | 🇺🇸 U.S. | $35.8B | +8.6% |
| 45 | Chase | 🇺🇸 U.S. | $35.8B | +14.3% |
| 46 | Mitsubishi Group | 🇯🇵 Japan | $35.5B | +1.7% |
| 47 | Coca-Cola | 🇺🇸 U.S. | $35.0B | +4.6% |
| 48 | UPS | 🇺🇸 U.S. | $34.6B | -2.4% |
| 49 | Volkswagen | 🇩🇪 Germany | $33.8B | -0.5% |
| 50 | Marlboro | 🇺🇸 U.S. | $32.6B | -6.3% |
| 51 | Mitsui | 🇯🇵 Japan | $32.5B | +5.8% |
| 52 | Louis Vuitton | 🇫🇷 France | $32.2B | +22.6% |
| 53 | YouTube | 🇺🇸 U.S. | $31.7B | +6.8% |
| 54 | Citi | 🇺🇸 U.S. | $31.4B | +2.8% |
| 55 | Huawei | 🇨🇳 China | $31.1B | -29.8% |
| 56 | NTT Group | 🇯🇵 Japan | $31.1B | -15.1% |
| 57 | EY | 🇬🇧 UK | $30.8B | +20.0% |
| 58 | J.P. Morgan | 🇺🇸 U.S. | $30.8B | -3.3% |
| 59 | CVS | 🇺🇸 U.S. | $30.2B | -1.1% |
| 60 | Xfinity | 🇺🇸 U.S. | $30.0B | +4.5% |
| 61 | CSCEC | 🇨🇳 China | $30.0B | -6.1% |
| 62 | Nike | 🇺🇸 U.S. | $29.9B | -4.6% |
| 63 | Uber | 🇺🇸 U.S. | $29.7B | +27.6% |
| 64 | Tata Group | 🇮🇳 India | $28.6B | +8.5% |
| 65 | FedEx | 🇺🇸 U.S. | $28.6B | -1.0% |
| 66 | PetroChina | 🇨🇳 China | $28.5B | -3.9% |
| 67 | Sinopec Group | 🇨🇳 China | $28.5B | +4.9% |
| 68 | VISA | 🇺🇸 U.S. | $28.0B | -5.4% |
| 69 | Spectrum | 🇺🇸 U.S. | $27.5B | +17.8% |
| 70 | China Merchants Bank | 🇨🇳 China | $26.6B | +8.6% |
| 71 | IBM Group | 🇺🇸 U.S. | $26.4B | +0.9% |
| 72 | Target | 🇺🇸 U.S. | $26.4B | -4.5% |
| 73 | Chanel | 🇫🇷 France | $26.1B | +34.5% |
| 74 | Honda | 🇯🇵 Japan | $25.9B | +7.1% |
| 75 | Wuliangye | 🇨🇳 China | $25.9B | -14.5% |
| 76 | Elevance Health | 🇺🇸 U.S. | $25.5B | +28.4% |
| 77 | SAP | 🇩🇪 Germany | $25.2B | +19.3% |
| 78 | TSMC | 🇹🇼 Taiwan | $25.1B | +16.2% |
| 79 | Lowe's | 🇺🇸 U.S. | $25.0B | -20.8% |
| 80 | PWC | 🇺🇸 U.S. | $24.7B | -2.6% |
| 81 | Siemens Group | 🇩🇪 Germany | $24.4B | +13.9% |
| 82 | SK Group | 🇰🇷 South Korea | $23.1B | +2.5% |
| 83 | LG Group | 🇰🇷 South Korea | $22.9B | +7.7% |
| 84 | Netflix | 🇺🇸 U.S. | $22.8B | -5.5% |
| 85 | Cisco | 🇺🇸 U.S. | $22.8B | -4.8% |
| 86 | Sumitomo Group | 🇯🇵 Japan | $22.5B | -5.9% |
| 87 | Mastercard | 🇺🇸 U.S. | $21.8B | -12.2% |
| 88 | Dell Technologies | 🇺🇸 U.S. | $21.4B | -5.2% |
| 89 | Intel | 🇺🇸 U.S. | $21.3B | -7.3% |
| 90 | Humana | 🇺🇸 U.S. | $21.0B | +27.1% |
| 91 | Ford | 🇺🇸 U.S. | $20.9B | -6.1% |
| 92 | Nestlé | 🇨🇭 Switzerland | $20.8B | -7.4% |
| 93 | Optum | 🇺🇸 U.S. | $20.4B | +1.2% |
| 94 | Orange | 🇫🇷 France | $20.3B | +10.2% |
| 95 | Pepsi | 🇺🇸 U.S. | $20.2B | +10.2% |
| 96 | Taobao | 🇨🇳 China | $20.1B | -34.0% |
| 97 | HSBC | 🇬🇧 UK | $20.0B | +1.0% |
| 98 | General Electric | 🇺🇸 U.S. | $19.8B | +2.2% |
| 99 | CATL | 🇨🇳 China | $19.0B | +29.4% |
| 100 | TD | 🇨🇦 Canada | $19.0B | -7.1% |
Ranking first overall, the value of Apple’s brand has ballooned by over $217 billion since last year’s ranking.
While iPhone sales have plateaued, the company has been expanding its product lines from wearables to Apple TV. Over 50% of people surveyed by Brand Finance said that their products were worth the price, even though it was expensive.
On the other hand, Tesla’s brand value sank to $58.3 billion, dropping out of the top 10 since last year. This came as new and more affordable electric vehicle (EV) makers saw increasing sales, notably BYD. Supported by strong demand in China’s market, BYD became the world’s bestselling EV company in 2023. In fact, over a third of new cars sold in the country were EVs.
The Fastest Growing Brands
Which brands jumped the most in value?
| Brand | Change in Ranking 2023-2024 | Change in Brand Value |
|---|---|---|
| Nvidia | +87 | +162.9% |
| CATL | +36 | +29.4% |
| Humana | +32 | +27.1% |
| Hyundai Group | +26 | +35.6% |
| Chanel | +25 | +34.5% |
| Elevance Health | +19 | +28.4% |
| Louis Vuitton | +18 | +22.6% |
| Uber | +18 | +27.6% |
| Oracle | +16 | +34.2% |
| EY | +15 | +20.0% |
Nvidia’s brand value soared as investors flocked to AI stocks and demand for memory chips accelerated.
For perspective, tens of thousands of chips are needed for AI models to run in order to simultaneously calculate computational tasks. The company joined the $1 trillion market cap club in late January 2024—the fifth company to do this ever. Not only that, it is worth more than Netflix, Tesla, and Walmart combined.
Most Valuable Brands: U.S. Leads the Pack
In 2024, more than half of the 100 most valuable brands are based in the United States, with a combined value of $3.2 trillion.
| Country | Top 100 Total Brand Value | Number of Brands |
|---|---|---|
| 🇺🇸 U.S. | $3,241.0B | 51 |
| 🇨🇳 China | $829.9B | 19 |
| 🇩🇪 Germany | $347.1B | 8 |
| 🇯🇵 Japan | $200.2B | 6 |
| 🇰🇷 South Korea | $182.4B | 4 |
| 🇬🇧 UK | $101.1B | 3 |
| 🇫🇷 France | $78.6B | 3 |
| 🇸🇦 Saudi Arabia | $41.6B | 1 |
| 🇮🇪 Ireland | $40.5B | 1 |
| 🇮🇳 India | $28.6B | 1 |
| 🇹🇼 Taiwan | $25.1B | 1 |
| 🇨🇭 Switzerland | $20.8B | 1 |
| 🇨🇦 Canada | $19.0B | 1 |
China has the second-highest number of companies on the ranking, with TikTok as its most valuable brand, worth $84.2 billion. Interestingly, many of China’s most valuable brands are heavily concentrated in the financial sector.
As a rising economic powerhouse, India’s most valuable brand is Tata Group.
The conglomerate, founded in 1868, spans across 30 companies in multiple sectors, from technology and manufacturing to automotive and steel. Its subsidiary, Tata Technologies, is scheduled to IPO in late 2024 with a $2.5 billion valuation.
With 245 million mobile customers in over 50 countries, Germany’s Deutsche Telekom is the most valuable in Europe, overtaking Verizon as the most valuable telecom brand globally.
Where does this data come from?
Source: Brand Finance Global 500 Report
Important note: The values shown above are brand value calculations as opposed to market capitalization. See below for more details.
How is brand value calculated? Generally speaking, the methodology for calculating “brand value” is a formula that is as follows:
Brand Strength (BSI) x Brand Royalty Rate x Brand Revenues = Brand Value
Brand Strength Index (BSI) looks at brand investment, brand equity, and brand performance. The brand royalty rate is determined based on sector. Lastly, forecast brand-specific revenues are determined based on the proportion of parent company revenues attributable to the brand in question. Brand value itself is discounted to net present value.


Markets
The European Stock Market: Attractive Valuations Offer Opportunities
On average, the European stock market has valuations that are nearly 50% lower than U.S. valuations. But how can you access the market?


European Stock Market: Attractive Valuations Offer Opportunities
Europe is known for some established brands, from L’Oréal to Louis Vuitton. However, the European stock market offers additional opportunities that may be lesser known.
The above infographic, sponsored by STOXX, outlines why investors may want to consider European stocks.
Attractive Valuations
Compared to most North American and Asian markets, European stocks offer lower or comparable valuations.
| Index | Price-to-Earnings Ratio | Price-to-Book Ratio |
|---|---|---|
| EURO STOXX 50 | 14.9 | 2.2 |
| STOXX Europe 600 | 14.4 | 2 |
| U.S. | 25.9 | 4.7 |
| Canada | 16.1 | 1.8 |
| Japan | 15.4 | 1.6 |
| Asia Pacific ex. China | 17.1 | 1.8 |
Data as of February 29, 2024. See graphic for full index names. Ratios based on trailing 12 month financials. The price to earnings ratio excludes companies with negative earnings.
On average, European valuations are nearly 50% lower than U.S. valuations, potentially offering an affordable entry point for investors.
Research also shows that lower price ratios have historically led to higher long-term returns.
Market Movements Not Closely Connected
Over the last decade, the European stock market had low-to-moderate correlation with North American and Asian equities.
The below chart shows correlations from February 2014 to February 2024. A value closer to zero indicates low correlation, while a value of one would indicate that two regions are moving in perfect unison.
| EURO STOXX 50 | STOXX EUROPE 600 | U.S. | Canada | Japan | Asia Pacific ex. China |
|
|---|---|---|---|---|---|---|
| EURO STOXX 50 | 1.00 | 0.97 | 0.55 | 0.67 | 0.24 | 0.43 |
| STOXX EUROPE 600 | 1.00 | 0.56 | 0.71 | 0.28 | 0.48 | |
| U.S. | 1.00 | 0.73 | 0.12 | 0.25 | ||
| Canada | 1.00 | 0.22 | 0.40 | |||
| Japan | 1.00 | 0.88 | ||||
| Asia Pacific ex. China | 1.00 |
Data is based on daily USD returns.
European equities had relatively independent market movements from North American and Asian markets. One contributing factor could be the differing sector weights in each market. For instance, technology makes up a quarter of the U.S. market, but health care and industrials dominate the broader European market.
Ultimately, European equities can enhance portfolio diversification and have the potential to mitigate risk for investors.
Tracking the Market
For investors interested in European equities, STOXX offers a variety of flagship indices:
| Index | Description | Market Cap |
|---|---|---|
| STOXX Europe 600 | Pan-regional, broad market | €10.5T |
| STOXX Developed Europe | Pan-regional, broad-market | €9.9T |
| STOXX Europe 600 ESG-X | Pan-regional, broad market, sustainability focus | €9.7T |
| STOXX Europe 50 | Pan-regional, blue-chip | €5.1T |
| EURO STOXX 50 | Eurozone, blue-chip | €3.5T |
Data is as of February 29, 2024. Market cap is free float, which represents the shares that are readily available for public trading on stock exchanges.
The EURO STOXX 50 tracks the Eurozone’s biggest and most traded companies. It also underlies one of the world’s largest ranges of ETFs and mutual funds. As of November 2023, there were €27.3 billion in ETFs and €23.5B in mutual fund assets under management tracking the index.
“For the past 25 years, the EURO STOXX 50 has served as an accurate, reliable and tradable representation of the Eurozone equity market.”
— Axel Lomholt, General Manager at STOXX
Partnering with STOXX to Track the European Stock Market
Are you interested in European equities? STOXX can be a valuable partner:
- Comprehensive, liquid and investable ecosystem
- European heritage, global reach
- Highly sophisticated customization capabilities
- Open architecture approach to using data
- Close partnerships with clients
- Part of ISS STOXX and Deutsche Börse Group
With a full suite of indices, STOXX can help you benchmark against the European stock market.
Learn how STOXX’s European indices offer liquid and effective market access.

-

 Economy2 days ago
Economic Growth Forecasts for G7 and BRICS Countries in 2024
The IMF has released its economic growth forecasts for 2024. How do the G7 and BRICS countries compare?
-

 Markets1 week ago
U.S. Debt Interest Payments Reach $1 Trillion
U.S. debt interest payments have surged past the $1 trillion dollar mark, amid high interest rates and an ever-expanding debt burden.
-

 United States2 weeks ago
Ranked: The Largest U.S. Corporations by Number of Employees
We visualized the top U.S. companies by employees, revealing the massive scale of retailers like Walmart, Target, and Home Depot.
-

 Markets2 weeks ago
The Top 10 States by Real GDP Growth in 2023
This graphic shows the states with the highest real GDP growth rate in 2023, largely propelled by the oil and gas boom.
-

 Markets2 weeks ago
Ranked: The World’s Top Flight Routes, by Revenue
In this graphic, we show the highest earning flight routes globally as air travel continued to rebound in 2023.
-

 Markets2 weeks ago
Ranked: The Most Valuable Housing Markets in America
The U.S. residential real estate market is worth a staggering $47.5 trillion. Here are the most valuable housing markets in the country.


-

 Education1 week ago
How Hard Is It to Get Into an Ivy League School?
-

 Technology2 weeks ago
Ranked: Semiconductor Companies by Industry Revenue Share
-
Markets2 weeks ago
Ranked: The World’s Top Flight Routes, by Revenue
-

 Demographics2 weeks ago
Population Projections: The World’s 6 Largest Countries in 2075
-
Markets2 weeks ago
The Top 10 States by Real GDP Growth in 2023
-

 Demographics2 weeks ago
The Smallest Gender Wage Gaps in OECD Countries
-

 Economy2 weeks ago
Where U.S. Inflation Hit the Hardest in March 2024
-

 Environment2 weeks ago
Top Countries By Forest Growth Since 2001