Markets
Ranking the Largest Companies by Revenue: USA vs. China
![]() See this visualization first on the Voronoi app.
See this visualization first on the Voronoi app.
Comparing the Largest American and Chinese Companies
This was originally posted on our Voronoi app. Download the app for free on iOS or Android and discover incredible data-driven charts from a variety of trusted sources.
With a GDP of around $18 trillion, China boasts the world’s second-largest economy, trailing only the United States.
The combination of low labor costs and advanced technology has positioned China as the global manufacturing hub.
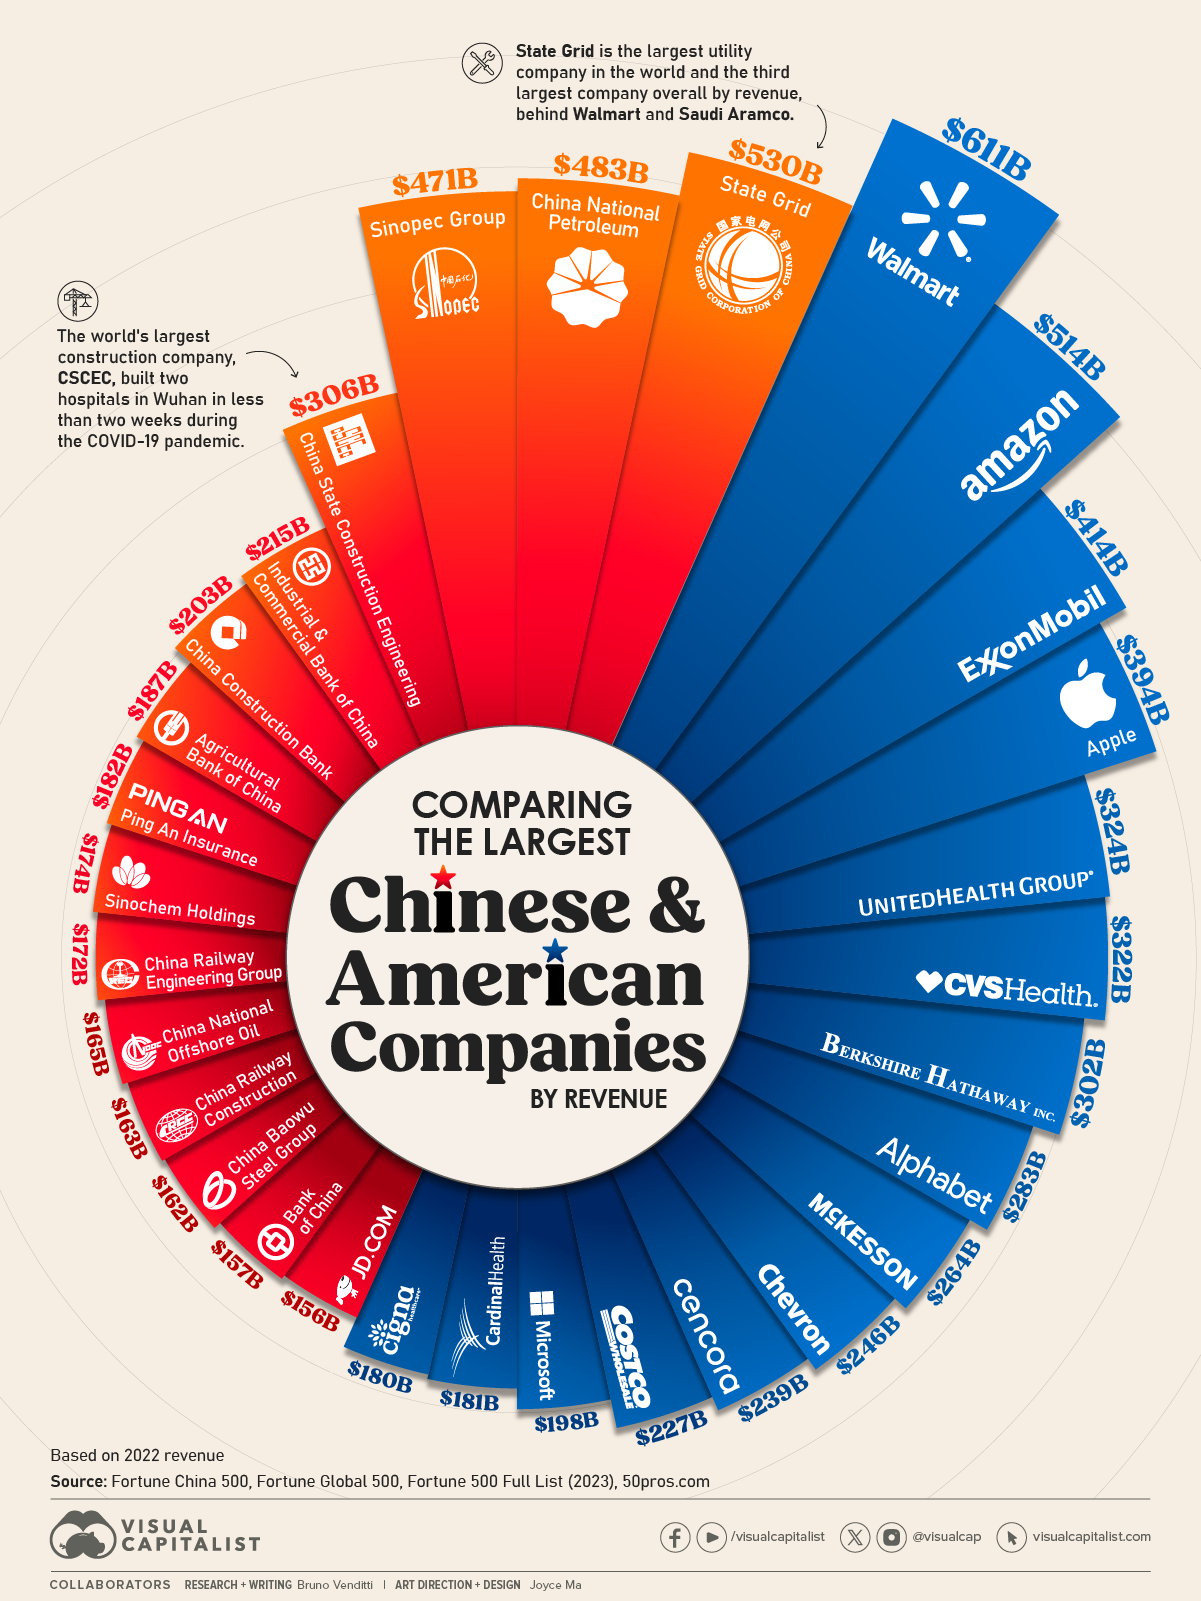
In this graphic, we compare the 15 largest Chinese and American companies based on their 2022 revenue, using data from the Fortune China 500 and Fortune Global 500.
Chinese State-Owned Giants
Not as well-known in Western countries as brands like Walmart, Amazon, or Apple, China’s largest companies rank among the world’s top in terms of revenue.
China’s biggest company, the utility giant State Grid, is the third-largest company by revenue globally, trailing only Walmart and Saudi Aramco.
| Company | Industry | 2022 Revenue (USD billion) |
|---|---|---|
| 🇺🇸 Walmart | Retailer | $611B |
| 🇨🇳 State Grid | Utility | $530B |
| 🇺🇸 Amazon | Retailer | $514B |
| 🇨🇳 China National Petroleum | Oil and Gas | $483B |
| 🇨🇳 Sinopec Group | Oil and Gas | $471B |
| 🇺🇸 Exxon Mobil | Oil and Gas | $413B |
| 🇺🇸 Apple | Electronics | $394B |
| 🇺🇸 Berkshire Hathaway | Insurance/ Property and Casualty (Stock) | $383B |
| 🇺🇸 UnitedHealth Group | Insurance/ Health Care | $324B |
| 🇺🇸 CVS Health | Health Care/ Pharmacy | $322B |
| 🇨🇳 China State Construction Engineering | Construction | $306B |
| 🇺🇸 Alphabet | Internet Services/ Retail | $283B |
| 🇺🇸 McKesson | Health Care / Pharmacy | $264B |
| 🇺🇸 Chevron | Petroil Refining | $246B |
| 🇺🇸 Cencora | Health Care | $238B |
| 🇺🇸 Costco Wholesale | General Merchandisers | $227B |
| 🇺🇸 Microsoft | Computer Software | $227B |
| 🇨🇳 Industrial & Commercial Bank of China | Banking/Financial | $215B |
| 🇨🇳 China Construction Bank | Banking/Financial | $203B |
| 🇨🇳 Agricultural Bank of China | Banking/Financial | $187B |
| 🇨🇳 Ping An Insurance | Banking / Insurance | $182B |
| 🇺🇸 Cardinal Health | Health Care | $181B |
| 🇺🇸 Cigna | Health Care / Insurance | $180B |
| 🇨🇳 Sinochem Holdings | Chemicals / Fertilizer | $174B |
| 🇨🇳 China Railway Engineering Group | Holding Company | $172B |
| 🇨🇳 China National Offshore Oil | Oil and Gas | $165B |
| 🇨🇳 China Railway Construction | Construction | $163B |
| 🇨🇳 China Baowu Steel Group | Steel/Metallurgy | $162B |
| 🇨🇳 Bank of China | Banking/Financial | $157B |
| 🇨🇳 JD.com | Retail | $155B |
State Grid holds the title of the largest utility company globally. In 2022, it reported 871,145 employees and served 1.1 billion customers.
Most of the leading Chinese companies on this ranking are similar to State Grid, in that they were initially founded as state-owned entities and operate in traditional industries like utilities, banking, construction, and oil and gas.
Another example is China State Construction Engineering, the world’s largest construction company, notable for constructing two hospitals in Wuhan in less than two weeks during the COVID-19 pandemic.
In contrast, the U.S. top 15 list leans more towards a presence of retail and technology companies.
One Chinese company that bucks the trends above is JD.com, a massive e-commerce company. Founded by internet entrepreneur Liu Qiangdong in 1998, JD.com initially started as an physical electronics store, but quickly expanded into e-commerce and diversified its product offering. Today, it stands as a major competitor to Alibaba’s Tmall.
China claims three spots in the top five overall, with oil and gas companies China National Petroleum and Sinopec Group leading ahead of companies like ExxonMobil, Apple, and Berkshire Hathaway.


Markets
The European Stock Market: Attractive Valuations Offer Opportunities
On average, the European stock market has valuations that are nearly 50% lower than U.S. valuations. But how can you access the market?


European Stock Market: Attractive Valuations Offer Opportunities
Europe is known for some established brands, from L’Oréal to Louis Vuitton. However, the European stock market offers additional opportunities that may be lesser known.
The above infographic, sponsored by STOXX, outlines why investors may want to consider European stocks.
Attractive Valuations
Compared to most North American and Asian markets, European stocks offer lower or comparable valuations.
| Index | Price-to-Earnings Ratio | Price-to-Book Ratio |
|---|---|---|
| EURO STOXX 50 | 14.9 | 2.2 |
| STOXX Europe 600 | 14.4 | 2 |
| U.S. | 25.9 | 4.7 |
| Canada | 16.1 | 1.8 |
| Japan | 15.4 | 1.6 |
| Asia Pacific ex. China | 17.1 | 1.8 |
Data as of February 29, 2024. See graphic for full index names. Ratios based on trailing 12 month financials. The price to earnings ratio excludes companies with negative earnings.
On average, European valuations are nearly 50% lower than U.S. valuations, potentially offering an affordable entry point for investors.
Research also shows that lower price ratios have historically led to higher long-term returns.
Market Movements Not Closely Connected
Over the last decade, the European stock market had low-to-moderate correlation with North American and Asian equities.
The below chart shows correlations from February 2014 to February 2024. A value closer to zero indicates low correlation, while a value of one would indicate that two regions are moving in perfect unison.
| EURO STOXX 50 | STOXX EUROPE 600 | U.S. | Canada | Japan | Asia Pacific ex. China |
|
|---|---|---|---|---|---|---|
| EURO STOXX 50 | 1.00 | 0.97 | 0.55 | 0.67 | 0.24 | 0.43 |
| STOXX EUROPE 600 | 1.00 | 0.56 | 0.71 | 0.28 | 0.48 | |
| U.S. | 1.00 | 0.73 | 0.12 | 0.25 | ||
| Canada | 1.00 | 0.22 | 0.40 | |||
| Japan | 1.00 | 0.88 | ||||
| Asia Pacific ex. China | 1.00 |
Data is based on daily USD returns.
European equities had relatively independent market movements from North American and Asian markets. One contributing factor could be the differing sector weights in each market. For instance, technology makes up a quarter of the U.S. market, but health care and industrials dominate the broader European market.
Ultimately, European equities can enhance portfolio diversification and have the potential to mitigate risk for investors.
Tracking the Market
For investors interested in European equities, STOXX offers a variety of flagship indices:
| Index | Description | Market Cap |
|---|---|---|
| STOXX Europe 600 | Pan-regional, broad market | €10.5T |
| STOXX Developed Europe | Pan-regional, broad-market | €9.9T |
| STOXX Europe 600 ESG-X | Pan-regional, broad market, sustainability focus | €9.7T |
| STOXX Europe 50 | Pan-regional, blue-chip | €5.1T |
| EURO STOXX 50 | Eurozone, blue-chip | €3.5T |
Data is as of February 29, 2024. Market cap is free float, which represents the shares that are readily available for public trading on stock exchanges.
The EURO STOXX 50 tracks the Eurozone’s biggest and most traded companies. It also underlies one of the world’s largest ranges of ETFs and mutual funds. As of November 2023, there were €27.3 billion in ETFs and €23.5B in mutual fund assets under management tracking the index.
“For the past 25 years, the EURO STOXX 50 has served as an accurate, reliable and tradable representation of the Eurozone equity market.”
— Axel Lomholt, General Manager at STOXX
Partnering with STOXX to Track the European Stock Market
Are you interested in European equities? STOXX can be a valuable partner:
- Comprehensive, liquid and investable ecosystem
- European heritage, global reach
- Highly sophisticated customization capabilities
- Open architecture approach to using data
- Close partnerships with clients
- Part of ISS STOXX and Deutsche Börse Group
With a full suite of indices, STOXX can help you benchmark against the European stock market.
Learn how STOXX’s European indices offer liquid and effective market access.

-

 Economy2 days ago
Economic Growth Forecasts for G7 and BRICS Countries in 2024
The IMF has released its economic growth forecasts for 2024. How do the G7 and BRICS countries compare?
-

 Markets1 week ago
U.S. Debt Interest Payments Reach $1 Trillion
U.S. debt interest payments have surged past the $1 trillion dollar mark, amid high interest rates and an ever-expanding debt burden.
-

 United States2 weeks ago
Ranked: The Largest U.S. Corporations by Number of Employees
We visualized the top U.S. companies by employees, revealing the massive scale of retailers like Walmart, Target, and Home Depot.
-

 Markets2 weeks ago
The Top 10 States by Real GDP Growth in 2023
This graphic shows the states with the highest real GDP growth rate in 2023, largely propelled by the oil and gas boom.
-

 Markets2 weeks ago
Ranked: The World’s Top Flight Routes, by Revenue
In this graphic, we show the highest earning flight routes globally as air travel continued to rebound in 2023.
-

 Markets3 weeks ago
Ranked: The Most Valuable Housing Markets in America
The U.S. residential real estate market is worth a staggering $47.5 trillion. Here are the most valuable housing markets in the country.


-

 Education1 week ago
How Hard Is It to Get Into an Ivy League School?
-

 Technology2 weeks ago
Ranked: Semiconductor Companies by Industry Revenue Share
-
Markets2 weeks ago
Ranked: The World’s Top Flight Routes, by Revenue
-

 Demographics2 weeks ago
Population Projections: The World’s 6 Largest Countries in 2075
-
Markets2 weeks ago
The Top 10 States by Real GDP Growth in 2023
-

 Demographics2 weeks ago
The Smallest Gender Wage Gaps in OECD Countries
-

 Economy2 weeks ago
Where U.S. Inflation Hit the Hardest in March 2024
-

 Green2 weeks ago
Top Countries By Forest Growth Since 2001