Energy
Visualizing the Rise of the Electric Vehicle
Visualizing the Rise of the Electric Vehicle
It’s easy to dismiss exponential growth at its earliest stages.
That’s because at the beginning of such a phenomenon, the quantities involved can seem insignificant. One becomes two, two becomes four, and so on.
But if the environment is right, and the growth continues on, it can all of a sudden take over. This growth can lead to a paradigm shift and a new status quo, as well as massive opportunities along the way.
The Water Droplet Analogy
One famous example of exponential growth is the water droplet and stadium analogy.
Imagine a giant football stadium, and you are sitting in the very highest seat. You can see the whole field.
In the middle of the stadium, there are drops of water falling at an increasing rate. In the first minute a single drop of water falls, in the second minute there are two drops of water added, and in the third minute, there are four drops of water, and so on. The rate doubles each minute.
When do you think the stadium is full of water? Does it take hours, days, or weeks?
For the first 30 minutes, not much seems to happen – there is a growing puddle, but it’s not likely something you can see from the very top seat. After 45 minutes the stadium is still 93% empty – but by 49 minutes, the entire stadium is full of water (and you’re swimming)!
The Electric Vehicle Market
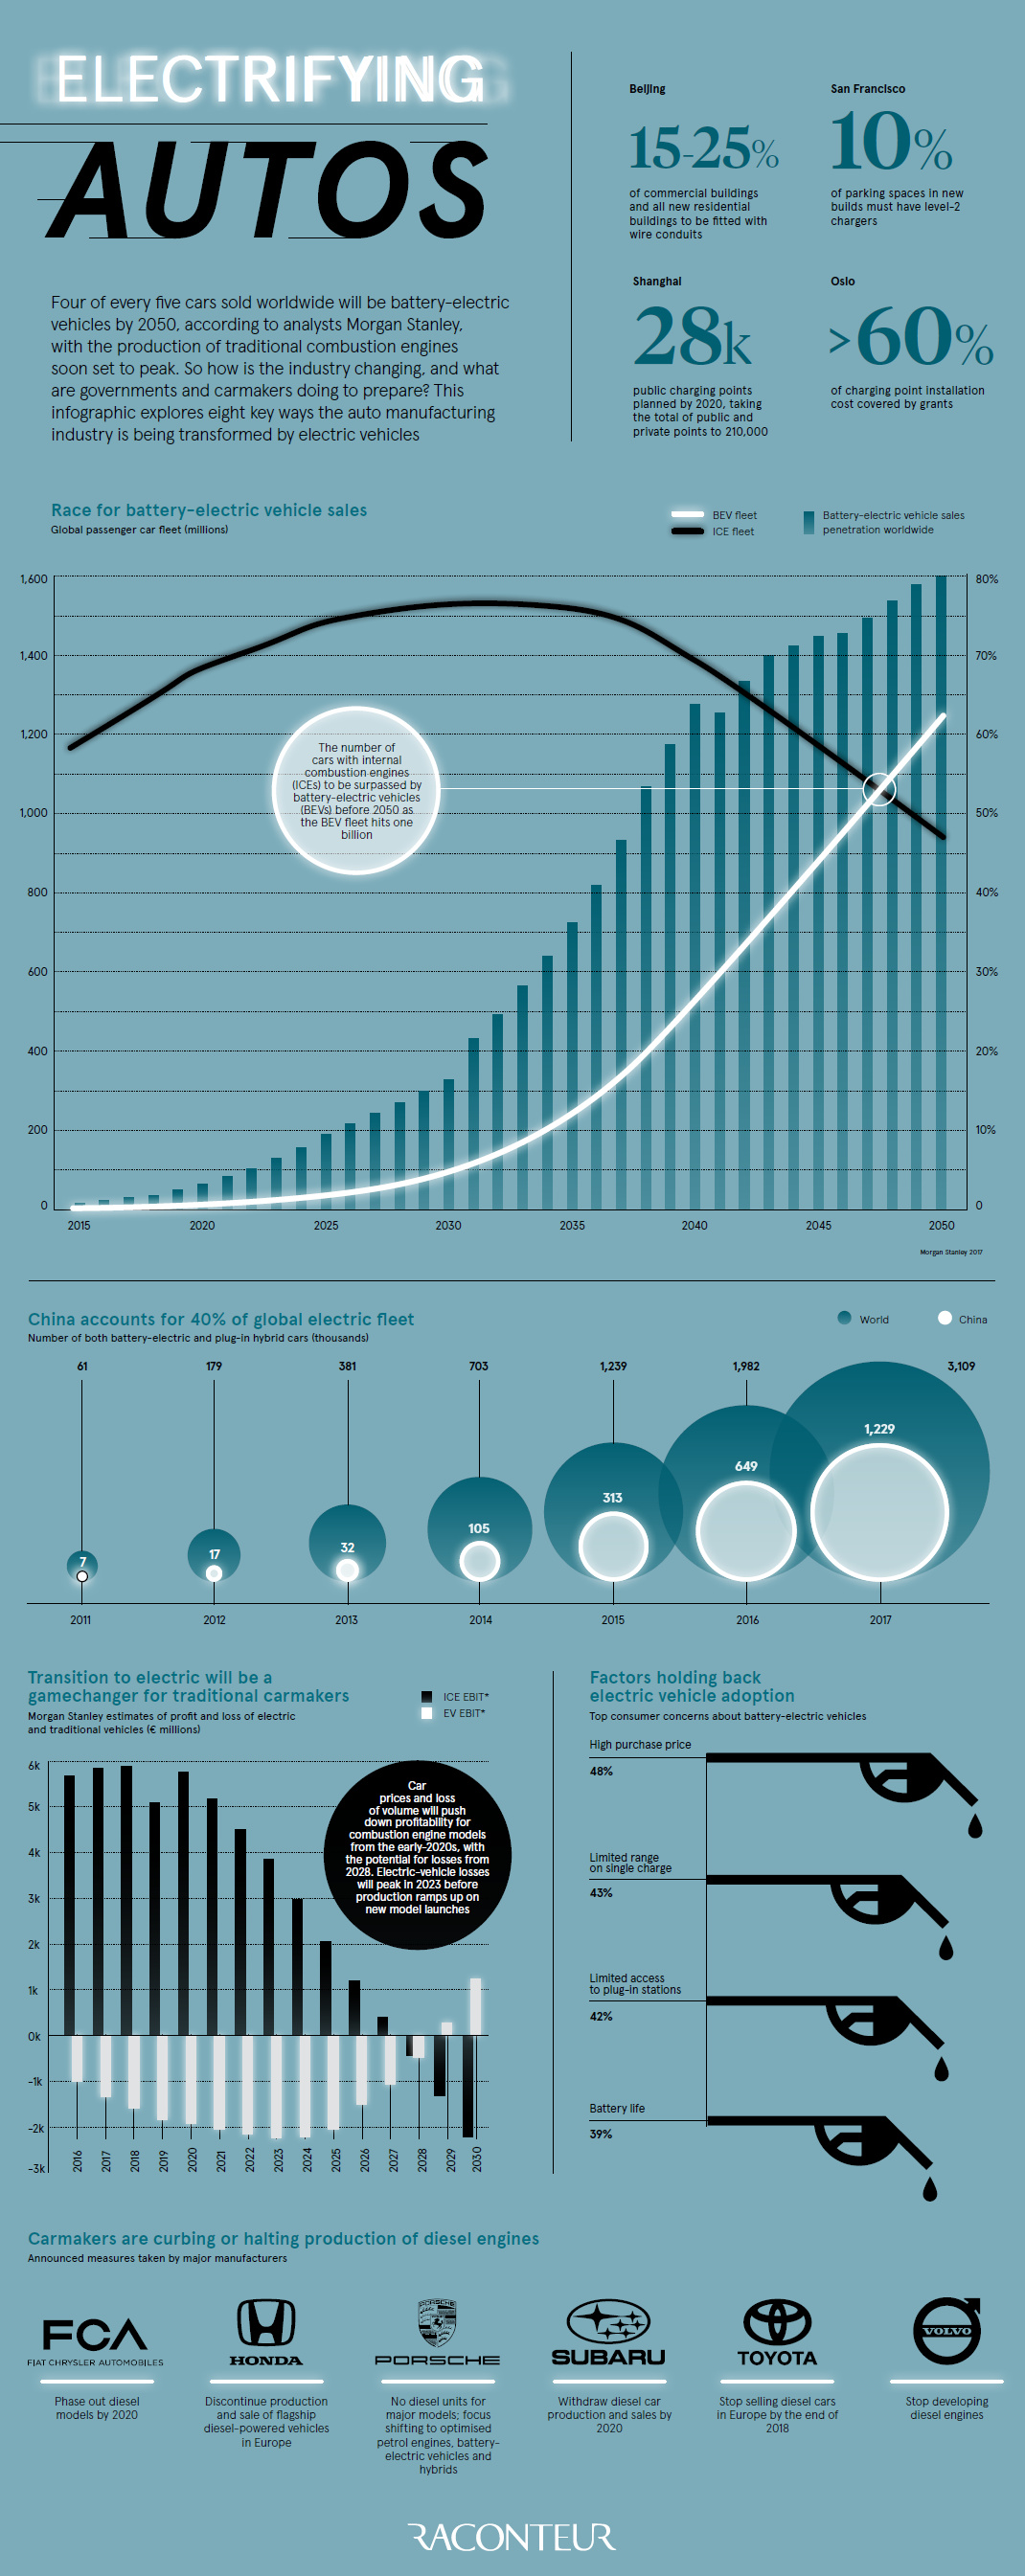
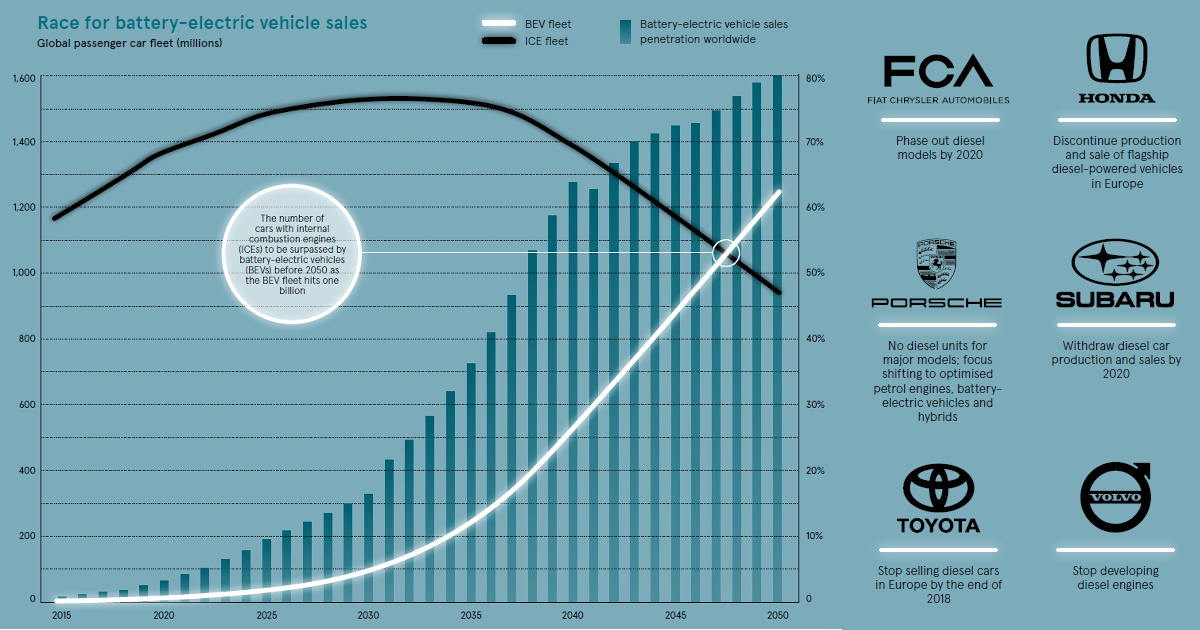
Today’s infographic comes to us from Raconteur, and it helps visualize anticipated growth in the electric vehicle market – a segment that sits at 1-2% of total vehicle sales currently.
Using projections from Morgan Stanley, it shows that electric vehicle sales are expected to surpass those of traditional vehicles by 2038, while the global fleet of EVs is expected to surpass one billion by 2047.
Meanwhile, the transition to electric will be a game-changer for carmakers. Morgan Stanley’s analysis sees the average profitability of combustion engine models falling through the early 2020s, eventually turning to a loss per unit by 2028.
On the flipside, negative profit margins for electric vehicles will peak in 2023 as production continues to ramp, and EV making will switch to a profitable business by 2029.
An EV Flood?
Will we wake up one morning with the auto market being flooded with new EVs, like in the aforementioned water drop analogy?
Certainly not. Manufacturing processes are notoriously difficult to scale, and we still need to source the raw materials needed to fuel the green revolution.
However, the speed of the transition to electric vehicles will still be surprising to many detractors – and for now, barring an unexpected drop in the price of oil to below $30/bbl, there doesn’t seem to be any obstacle that will slow the adoption of EVs.


Who’s Building the Most Solar Energy?
This was originally posted on our Voronoi app. Download the app for free on iOS or Android and discover incredible data-driven charts from a variety of trusted sources.
In 2023, solar energy accounted for three-quarters of renewable capacity additions worldwide. Most of this growth occurred in Asia, the EU, and the U.S., continuing a trend observed over the past decade.
In this graphic, we illustrate the rise in installed solar photovoltaic (PV) capacity in China, the EU, and the U.S. between 2010 and 2022, measured in gigawatts (GW). Bruegel compiled the data..
Chinese Dominance
As of 2022, China’s total installed capacity stands at 393 GW, nearly double that of the EU’s 205 GW and surpassing the USA’s total of 113 GW by more than threefold in absolute terms.
| Installed solar capacity (GW) | China | EU27 | U.S. |
|---|---|---|---|
| 2022 | 393.0 | 205.5 | 113.0 |
| 2021 | 307.0 | 162.7 | 95.4 |
| 2020 | 254.0 | 136.9 | 76.4 |
| 2019 | 205.0 | 120.1 | 61.6 |
| 2018 | 175.3 | 104.0 | 52.0 |
| 2017 | 130.8 | 96.2 | 43.8 |
| 2016 | 77.8 | 91.5 | 35.4 |
| 2015 | 43.6 | 87.7 | 24.2 |
| 2014 | 28.4 | 83.6 | 18.1 |
| 2013 | 17.8 | 79.7 | 13.3 |
| 2012 | 6.7 | 71.1 | 8.6 |
| 2011 | 3.1 | 53.3 | 5.6 |
| 2010 | 1.0 | 30.6 | 3.4 |
Since 2017, China has shown a compound annual growth rate (CAGR) of approximately 25% in installed PV capacity, while the USA has seen a CAGR of 21%, and the EU of 16%.
Additionally, China dominates the production of solar power components, currently controlling around 80% of the world’s solar panel supply chain.
In 2022, China’s solar industry employed 2.76 million individuals, with manufacturing roles representing approximately 1.8 million and the remaining 918,000 jobs in construction, installation, and operations and maintenance.
The EU industry employed 648,000 individuals, while the U.S. reached 264,000 jobs.
According to the IEA, China accounts for almost 60% of new renewable capacity expected to become operational globally by 2028.
Despite the phasing out of national subsidies in 2020 and 2021, deployment of solar PV in China is accelerating. The country is expected to reach its national 2030 target for wind and solar PV installations in 2024, six years ahead of schedule.

-

 Markets5 days ago
Visualizing Global Inflation Forecasts (2024-2026)
-

 Green2 weeks ago
The Carbon Footprint of Major Travel Methods
-

 United States2 weeks ago
Visualizing the Most Common Pets in the U.S.
-

 Culture2 weeks ago
The World’s Top Media Franchises by All-Time Revenue
-

 voronoi1 week ago
Best Visualizations of April on the Voronoi App
-

 Wealth1 week ago
Charted: Which Country Has the Most Billionaires in 2024?
-

 Business1 week ago
The Top Private Equity Firms by Country
-

 Markets1 week ago
The Best U.S. Companies to Work for According to LinkedIn