Energy
The Raw Materials That Fuel the Green Revolution
View a high resolution version of this graphic
The Raw Materials That Fuel the Green Revolution
View the high resolution version of today’s graphic by clicking here.
Records for renewable energy consumption were smashed around the world in 2017.
Looking at national and state grids, progress has been extremely impressive. In Costa Rica, for example, renewable energy supplied five million people with all of their electricity needs for a stretch of 300 consecutive days. Meanwhile, the U.K. broke 13 green energy records in 2017 alone, and California’s largest grid operator announced it got 67.2% of its energy from renewables (excluding hydro) on May 13, 2017.
The corporate front is also looking promising, and Google has led the way by buying 536 MW of wind power to offset 100% of the company’s electricity usage. This makes the tech giant the biggest corporate purchaser of renewable energy on the planet.
But while these examples are plentiful, this progress is only the tip of the iceberg – and green energy still represents a small but rapidly growing segment. For a full green shift to occur, we’ll need to 10x what we’re currently sourcing from renewables.
To do this, we will need to procure massive amounts of natural resources – they just won’t be the fossil fuels that we’re used to.
Green Metals Required
Today’s infographic comes from Cambridge House as a part of the lead-up to their flagship conference, the Vancouver Resource Investment Conference 2018.
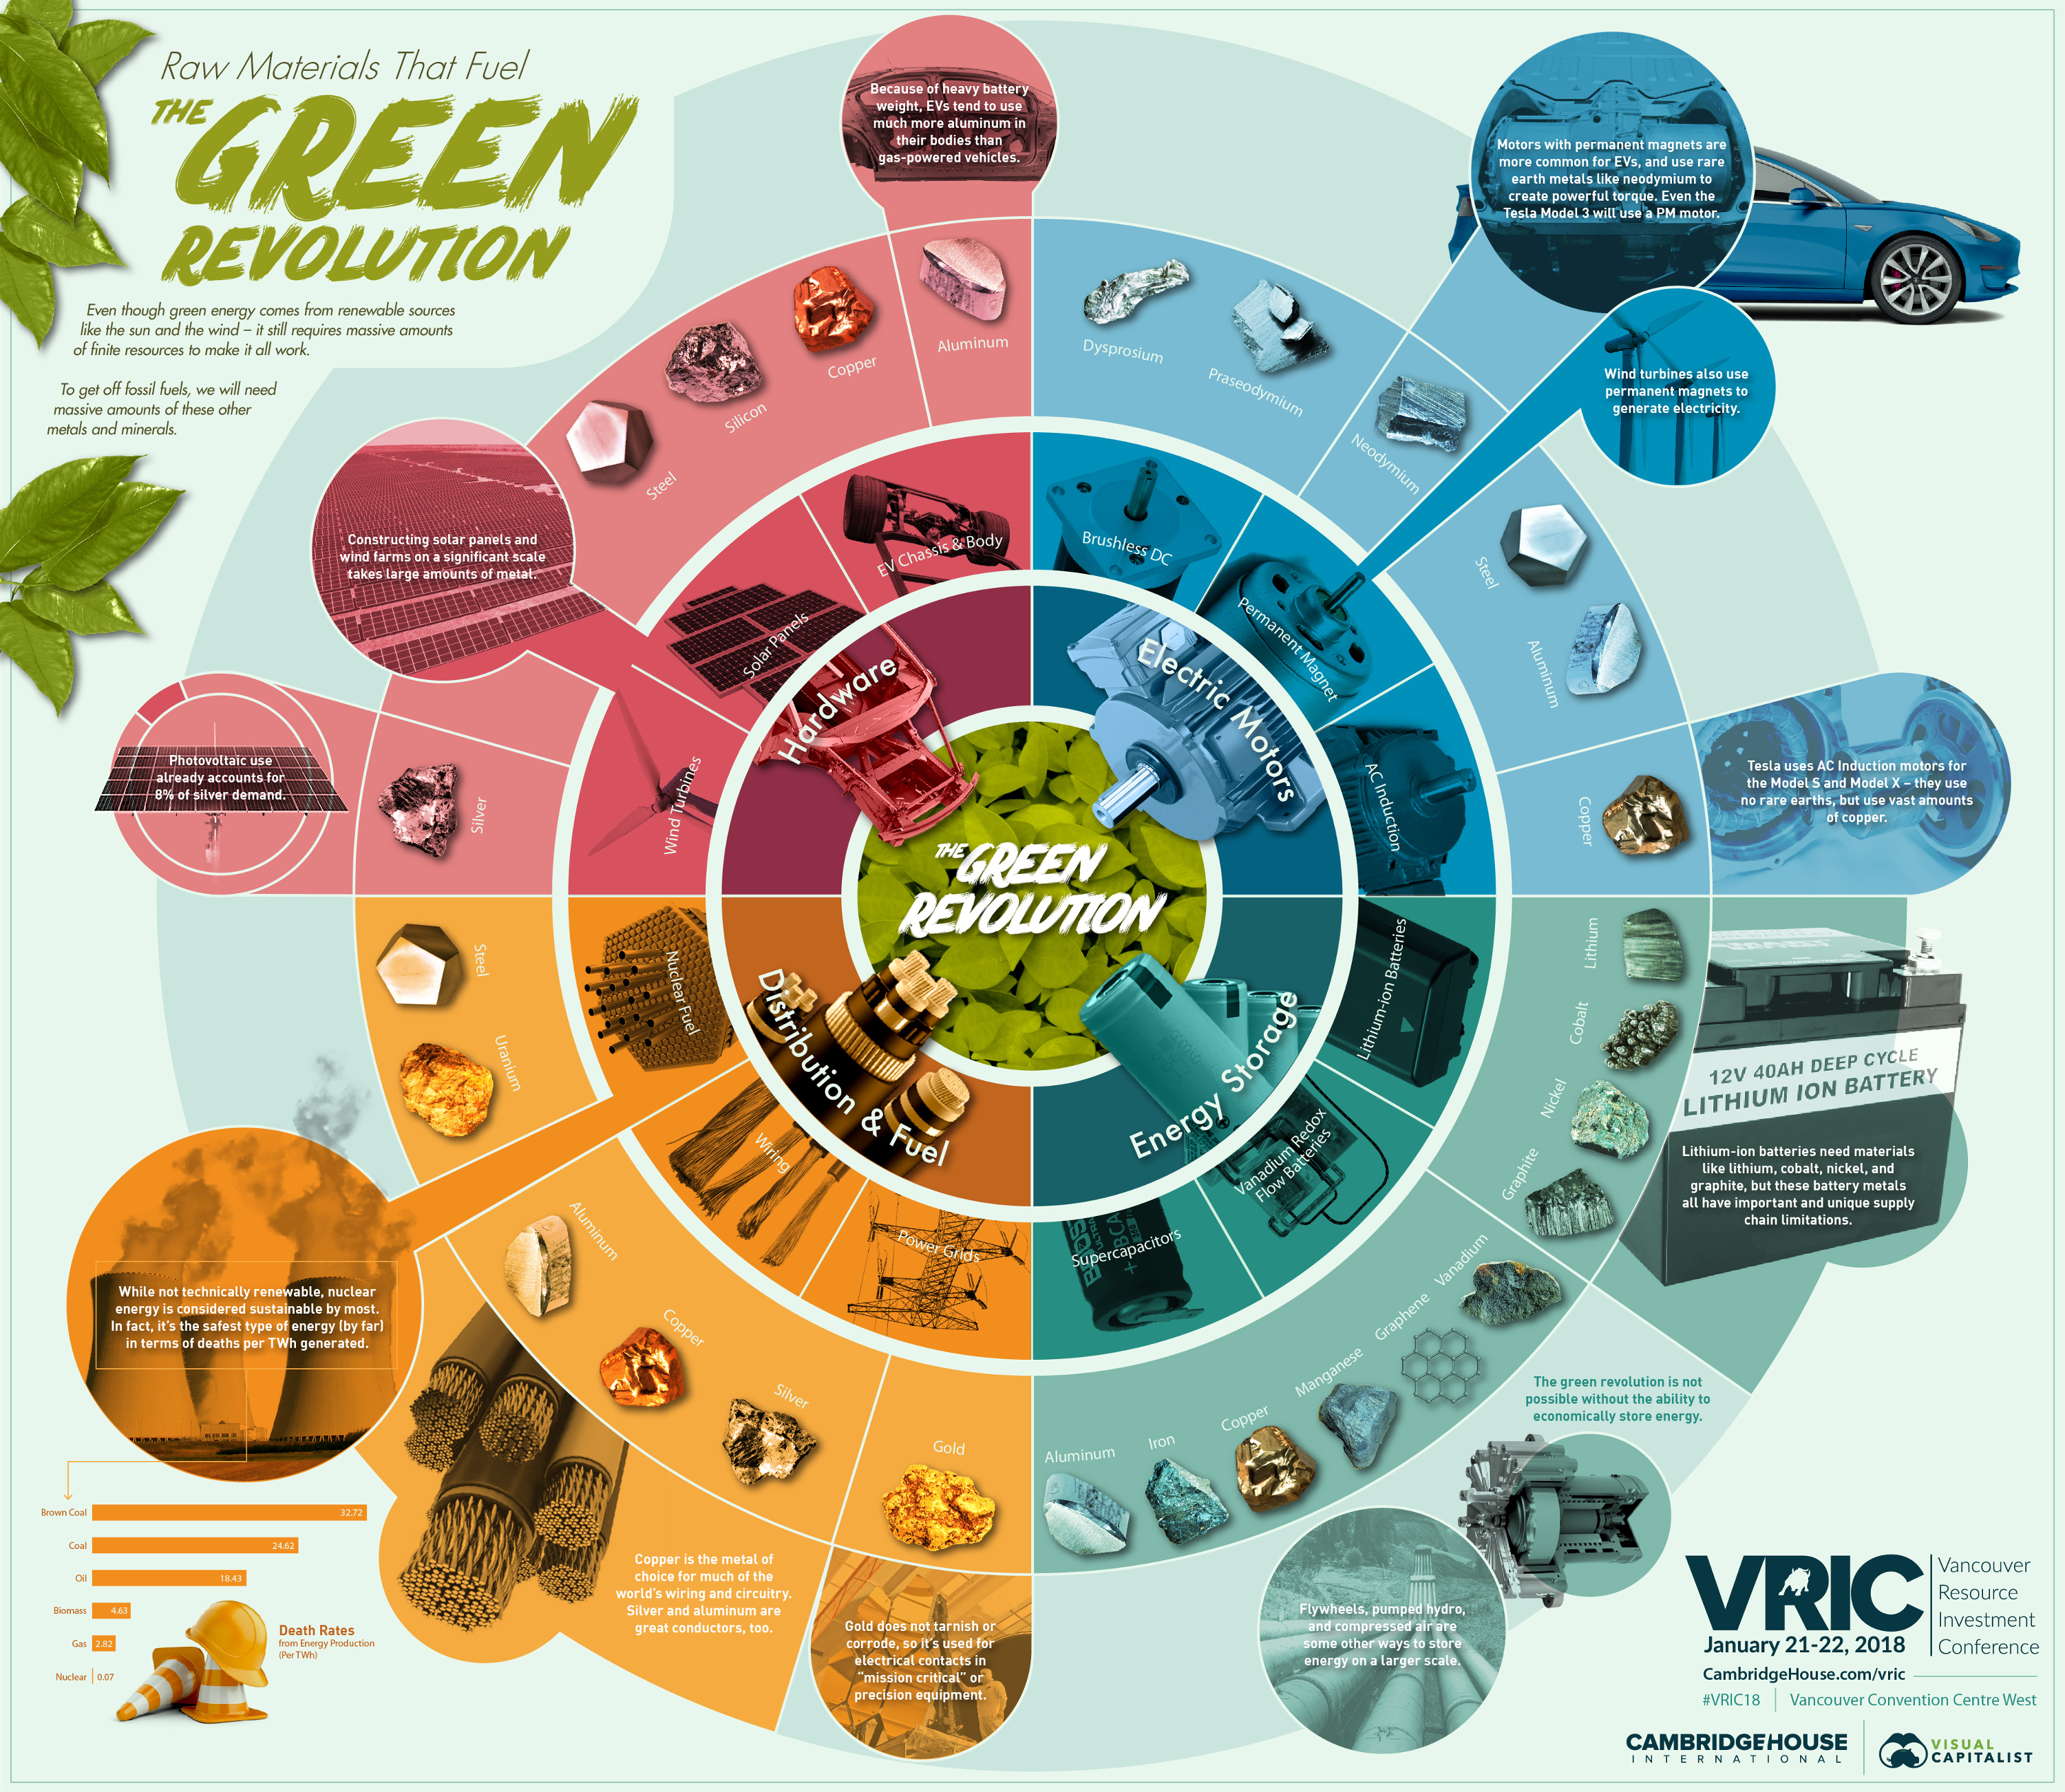
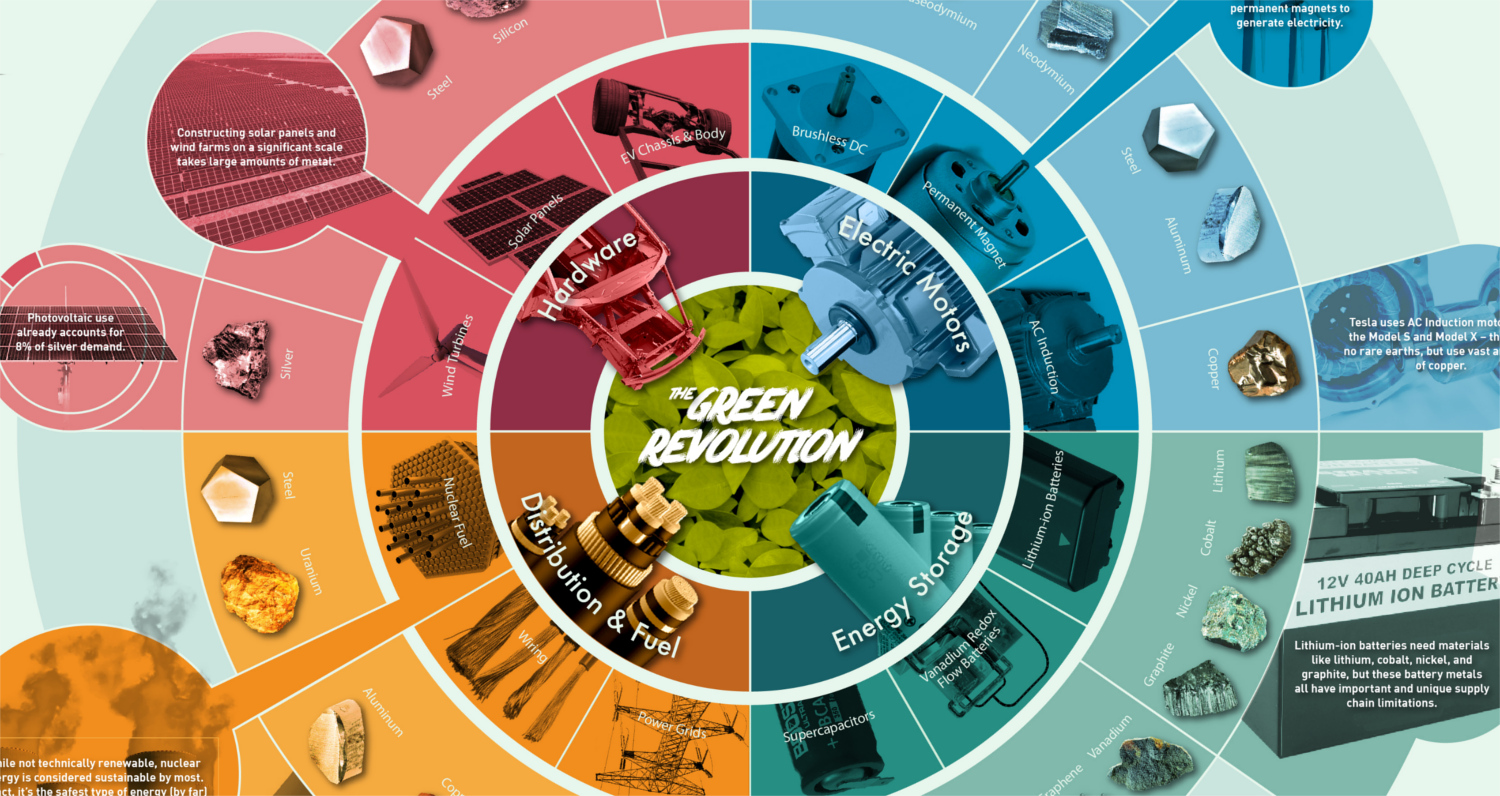
A major theme of the conference is sustainable energy – and the math indeed makes it clear that to fully transition to a green economy, we’ll need vast amounts of metals like copper, silicon, aluminum, lithium, cobalt, rare earths, and silver.
These metals and minerals are needed to generate, store, and distribute green energy. Without them, the reality is that technologies like solar panels, wind turbines, lithium-ion batteries, nuclear reactors, and electric vehicles are simply not possible.
First Principles
How do you get a Tesla to drive over 300 miles (480 km) on just one charge?
Here’s what you need: a lightweight body, a powerful electric motor, a cutting-edge battery that can store energy efficiently, and a lot of engineering prowess.
Putting the engineering aside, all of these things need special metals to work. For the lightweight body, aluminum is being substituted in for steel. For the electric motor, Tesla is using AC induction motors (Model S and X) that require large amounts of copper and aluminum. Meanwhile, Chevy Bolts and soon Tesla will use permanent magnet motors (in the Model 3) that use rare earths like neodymium, dysprosium, and praseodymium.
The batteries, as we’ve shown in our five-part Battery Series, are a whole other supply chain challenge. The lithium-ion batteries used in EVs need lithium, nickel, cobalt, graphite, and many other metals or minerals to function. Each Tesla battery, by the way, weighs about 1,200 lbs (540 kg) and makes up 25% the total mass of the car.
While EVs are a topic we’ve studied in depth, the same principles apply for solar panels, wind turbines, nuclear reactors, grid-scale energy storage solutions, or anything else we need to secure a sustainable future. Solar panels need silicon and silver, while wind turbines need rare earths, steel, and aluminum.
Even nuclear, which is the safest energy type by deaths per TWh and generates barely any emissions, needs uranium in order to generate power.
The Pace of Progress
The green revolution is happening at a breakneck speed – and new records will continue to be set each year.
Over $200 billion was invested into renewables in 2016, and more net renewable capacity was added than coal and gas put together:
| Power Type | Net Global Capacity Added (2016) |
|---|---|
| Renewable (excl. large hydro) | 138 GW |
| Coal | 54 GW |
| Gas | 37 GW |
| Large hydro | 15 GW |
| Nuclear | 10 GW |
| Other flexible capacity | 5 GW |
The numbers suggest that this is the only start of the green revolution.
However, to fully work our way off of fossil fuels, we will need to procure large amounts of the metals that make sustainable energy possible.


Energy
Charted: 4 Reasons Why Lithium Could Be the Next Gold Rush
Visual Capitalist has partnered with EnergyX to show why drops in prices and growing demand may make now the right time to invest in lithium.


4 Reasons Why You Should Invest in Lithium
Lithium’s importance in powering EVs makes it a linchpin of the clean energy transition and one of the world’s most precious minerals.
In this graphic, Visual Capitalist partnered with EnergyX to explore why now may be the time to invest in lithium.
1. Lithium Prices Have Dropped
One of the most critical aspects of evaluating an investment is ensuring that the asset’s value is higher than its price would indicate. Lithium is integral to powering EVs, and, prices have fallen fast over the last year:
| Date | LiOH·H₂O* | Li₂CO₃** |
|---|---|---|
| Feb 2023 | $76 | $71 |
| March 2023 | $71 | $61 |
| Apr 2023 | $43 | $33 |
| May 2023 | $43 | $33 |
| June 2023 | $47 | $45 |
| July 2023 | $44 | $40 |
| Aug 2023 | $35 | $35 |
| Sept 2023 | $28 | $27 |
| Oct 2023 | $24 | $23 |
| Nov 2023 | $21 | $21 |
| Dec 2023 | $17 | $16 |
| Jan 2024 | $14 | $15 |
| Feb 2024 | $13 | $14 |
Note: Monthly spot prices were taken as close to the 14th of each month as possible.
*Lithium hydroxide monohydrate MB-LI-0033
**Lithium carbonate MB-LI-0029
2. Lithium-Ion Battery Prices Are Also Falling
The drop in lithium prices is just one reason to invest in the metal. Increasing economies of scale, coupled with low commodity prices, have caused the cost of lithium-ion batteries to drop significantly as well.
In fact, BNEF reports that between 2013 and 2023, the price of a Li-ion battery dropped by 82%.
| Year | Price per KWh |
|---|---|
| 2023 | $139 |
| 2022 | $161 |
| 2021 | $150 |
| 2020 | $160 |
| 2019 | $183 |
| 2018 | $211 |
| 2017 | $258 |
| 2016 | $345 |
| 2015 | $448 |
| 2014 | $692 |
| 2013 | $780 |

3. EV Adoption is Sustainable
One of the best reasons to invest in lithium is that EVs, one of the main drivers behind the demand for lithium, have reached a price point similar to that of traditional vehicle.
According to the Kelly Blue Book, Tesla’s average transaction price dropped by 25% between 2022 and 2023, bringing it in line with many other major manufacturers and showing that EVs are a realistic transport option from a consumer price perspective.
| Manufacturer | September 2022 | September 2023 |
|---|---|---|
| BMW | $69,000 | $72,000 |
| Ford | $54,000 | $56,000 |
| Volkswagon | $54,000 | $56,000 |
| General Motors | $52,000 | $53,000 |
| Tesla | $68,000 | $51,000 |
4. Electricity Demand in Transport is Growing
As EVs become an accessible transport option, there’s an investment opportunity in lithium. But possibly the best reason to invest in lithium is that the IEA reports global demand for the electricity in transport could grow dramatically by 2030:
| Transport Type | 2022 | 2025 | 2030 |
|---|---|---|---|
| Buses 🚌 | 23,000 GWh | 50,000 GWh | 130,000 GWh |
| Cars 🚙 | 65,000 GWh | 200,000 GWh | 570,000 GWh |
| Trucks 🛻 | 4,000 GWh | 15,000 GWh | 94,000 GWh |
| Vans 🚐 | 6,000 GWh | 16,000 GWh | 72,000 GWh |
The Lithium Investment Opportunity
Lithium presents a potentially classic investment opportunity. Lithium and battery prices have dropped significantly, and recently, EVs have reached a price point similar to other vehicles. By 2030, the demand for clean energy, especially in transport, will grow dramatically.
With prices dropping and demand skyrocketing, now is the time to invest in lithium.
EnergyX is poised to exploit lithium demand with cutting-edge lithium extraction technology capable of extracting 300% more lithium than current processes.

-

 Lithium4 days ago
Ranked: The Top 10 EV Battery Manufacturers in 2023
Asia dominates this ranking of the world’s largest EV battery manufacturers in 2023.
-

 Energy1 week ago
The World’s Biggest Nuclear Energy Producers
China has grown its nuclear capacity over the last decade, now ranking second on the list of top nuclear energy producers.
-

 Energy1 month ago
The World’s Biggest Oil Producers in 2023
Just three countries accounted for 40% of global oil production last year.
-

 Energy1 month ago
How Much Does the U.S. Depend on Russian Uranium?
Currently, Russia is the largest foreign supplier of nuclear power fuel to the U.S.
-

 Uranium2 months ago
Charted: Global Uranium Reserves, by Country
We visualize the distribution of the world’s uranium reserves by country, with 3 countries accounting for more than half of total reserves.
-

 Energy3 months ago
Visualizing the Rise of the U.S. as Top Crude Oil Producer
Over the last decade, the United States has established itself as the world’s top producer of crude oil, surpassing Saudi Arabia and Russia.


-

 Debt1 week ago
How Debt-to-GDP Ratios Have Changed Since 2000
-

 Markets2 weeks ago
Ranked: The World’s Top Flight Routes, by Revenue
-

 Countries2 weeks ago
Population Projections: The World’s 6 Largest Countries in 2075
-

 Markets2 weeks ago
The Top 10 States by Real GDP Growth in 2023
-

 Demographics2 weeks ago
The Smallest Gender Wage Gaps in OECD Countries
-

 United States2 weeks ago
Where U.S. Inflation Hit the Hardest in March 2024
-

 Green2 weeks ago
Top Countries By Forest Growth Since 2001
-

 United States2 weeks ago
Ranked: The Largest U.S. Corporations by Number of Employees