
Massive advancements in gene editing, space travel, and quantum theory highlight the list of the top scientific breakthroughs of 2017.
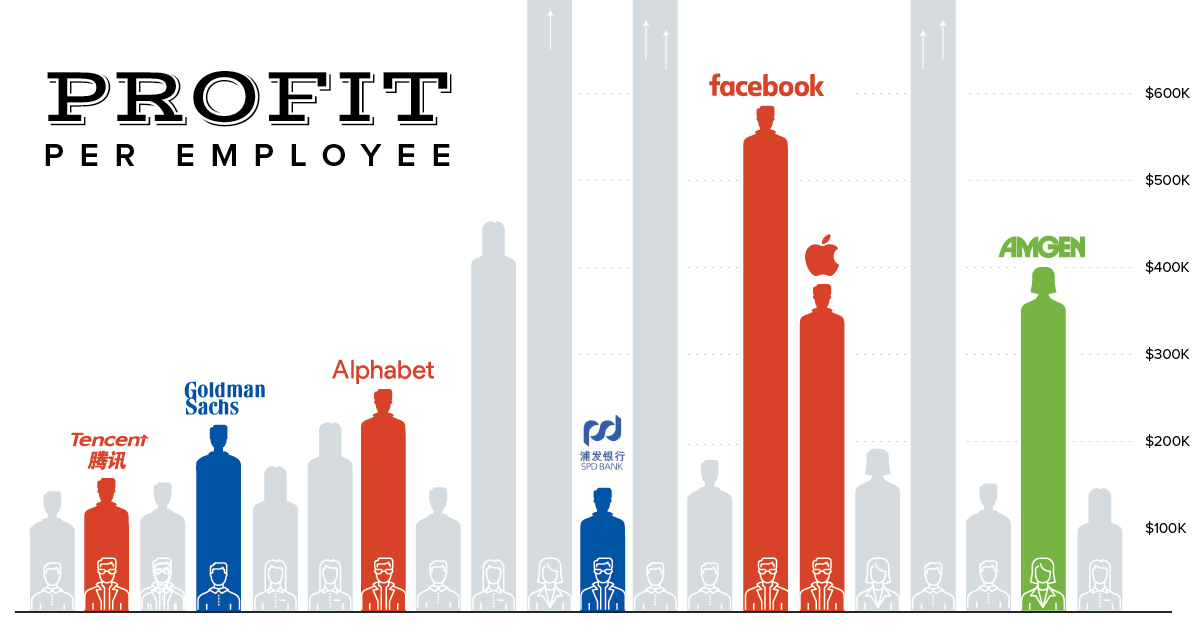
Which company rakes in the most profit per employee? Today's chart looks at the top 20 global companies by that measure, including two unexpected leaders.
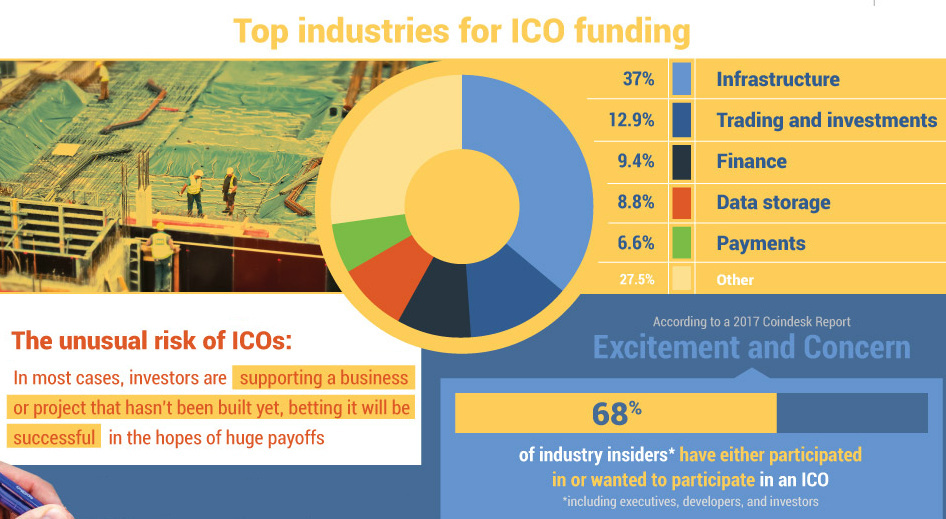
What is an ICO, and how did this new financing mechanism gain so much traction? Today's infographic covers the history and characteristics of ICOs.
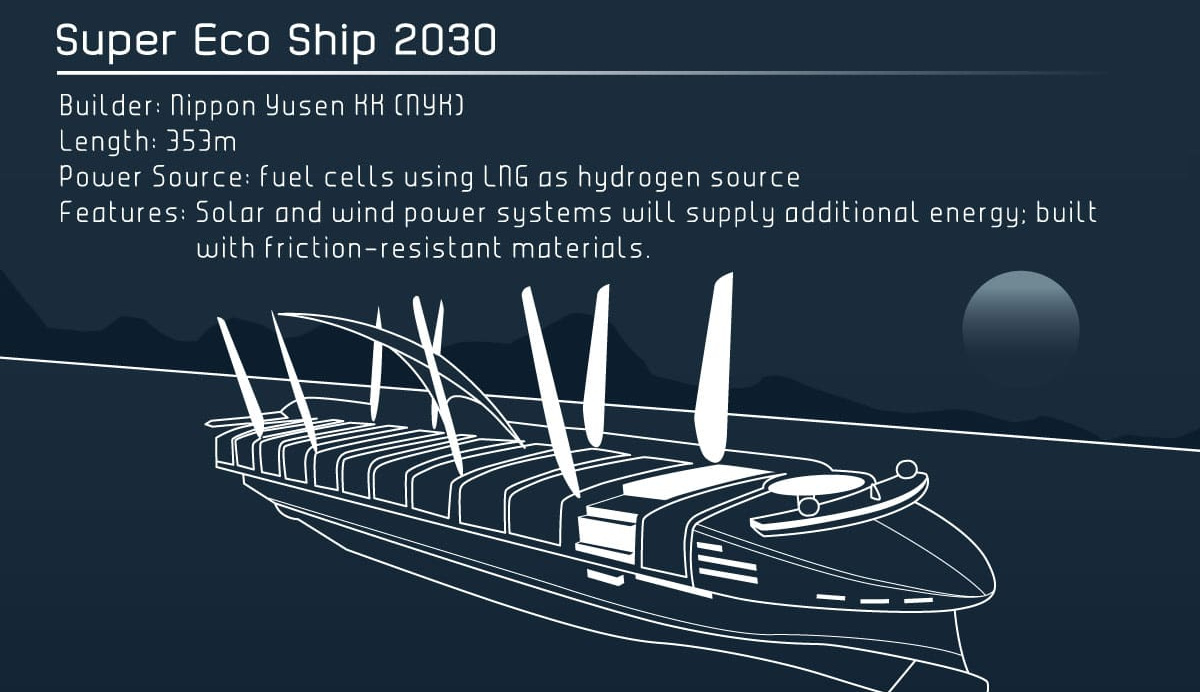
These examples of concept ships are being built to use higher amounts of AI and green energy. See the future of shipping in this infographic.
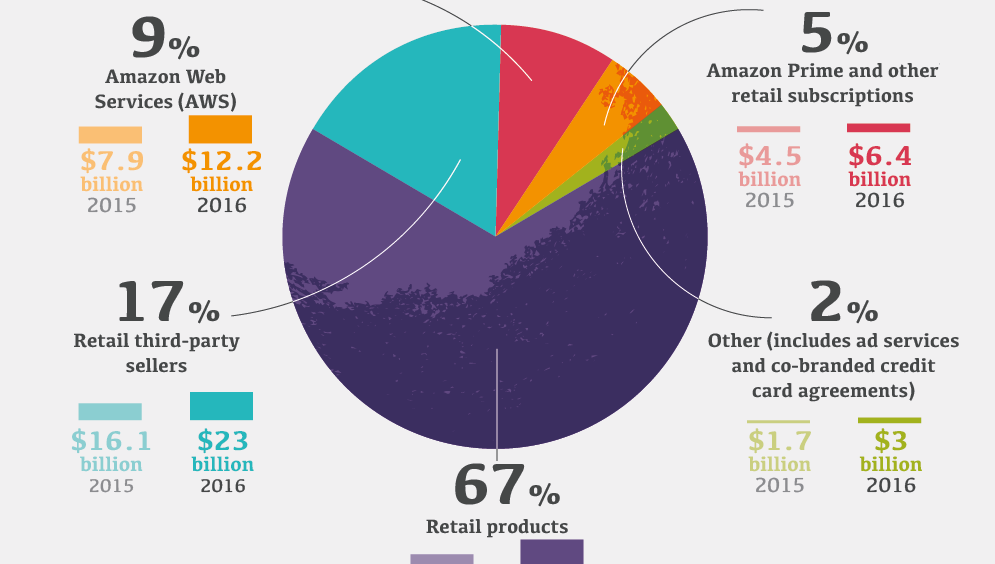
This infographic dives deep into the company's focus on customers, as well as its massive growth. In addition, it breaks down how Amazon makes money.
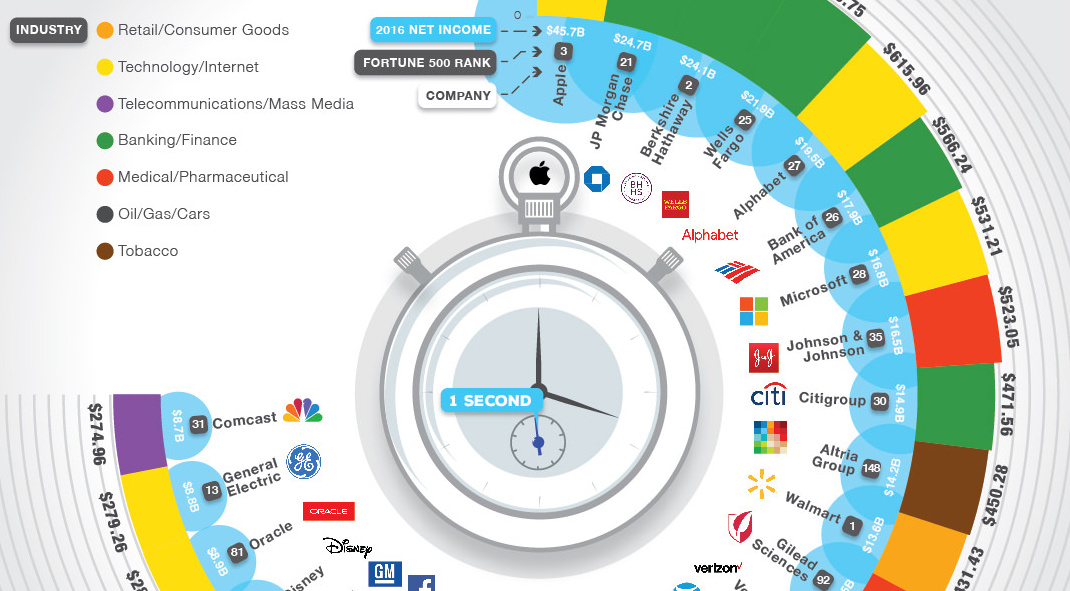
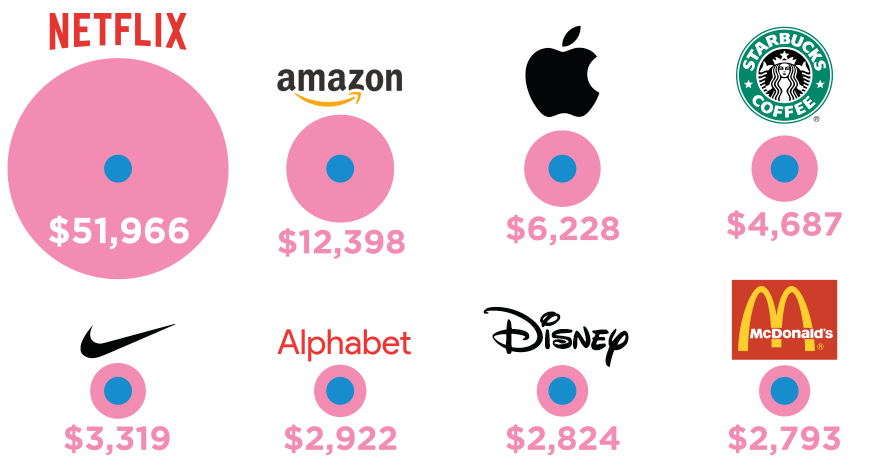
How much money does Apple make per second? Do any other companies even come close? See money made per second visualized on this nifty infographic.
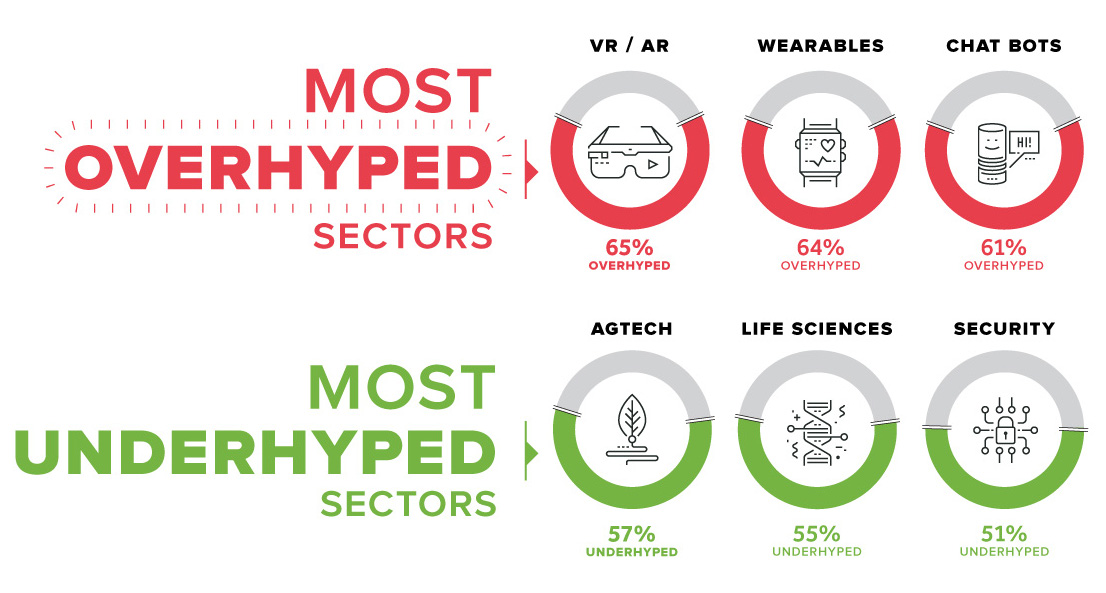
Founders are at the ground level of the startup ecosystem - and here's what they think about different technologies such as AI, the blockchain, and VR/AR.
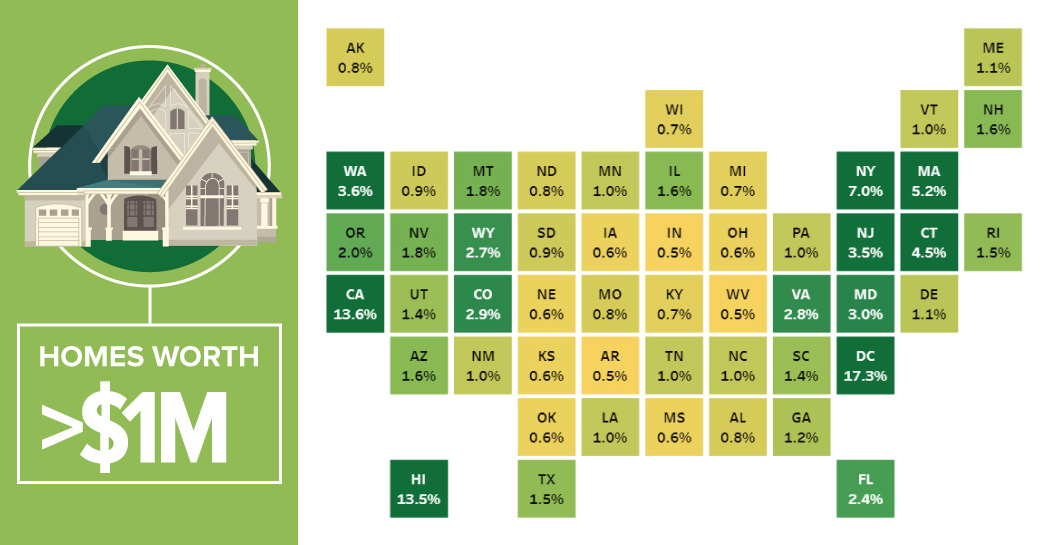
Here are the states with the most million dollar homes, as well as the top 10 cities adding new multi-million dollar homes at the fastest rates.

In 2016, more net capacity was added for clean energy than all other types combined. Who's adding renewable capacity, and how much are they investing?
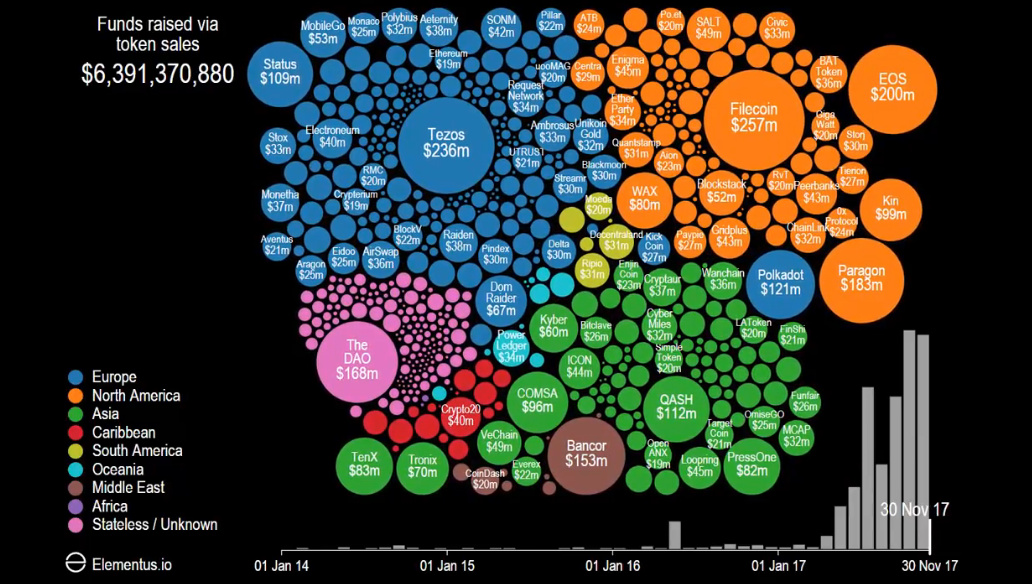
All is quiet for about three years of this incredible animated timeline - but by 2017, there's an ICO explosion as billions of dollars are poured...
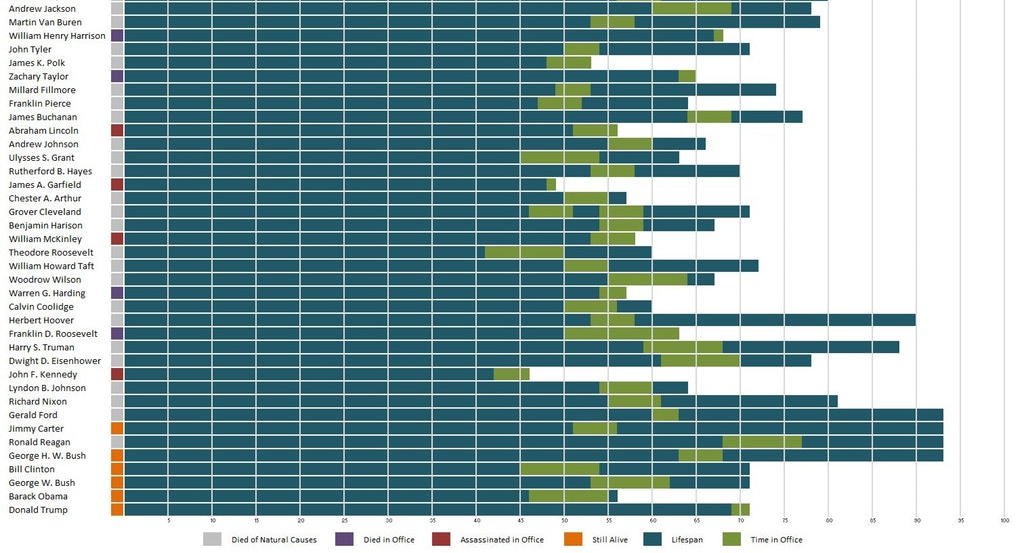
When do presidents start their first terms, on average? Who were the youngest and oldest presidents? It's all here in this visualization.
If you're a Canadian that invests in funds that hold U.S. companies, currency fluctuations can make a big impact on your returns. Here's how it all...
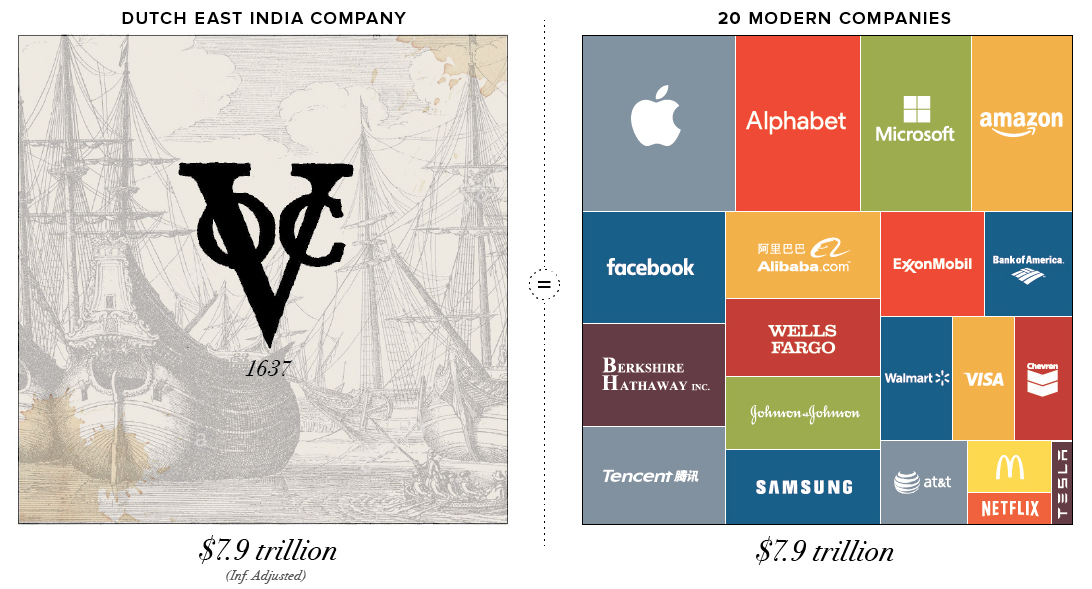
At its speculative height, the Dutch East India Company was worth $7.9 trillion in today's terms - more than 20 of the world's biggest companies combined.
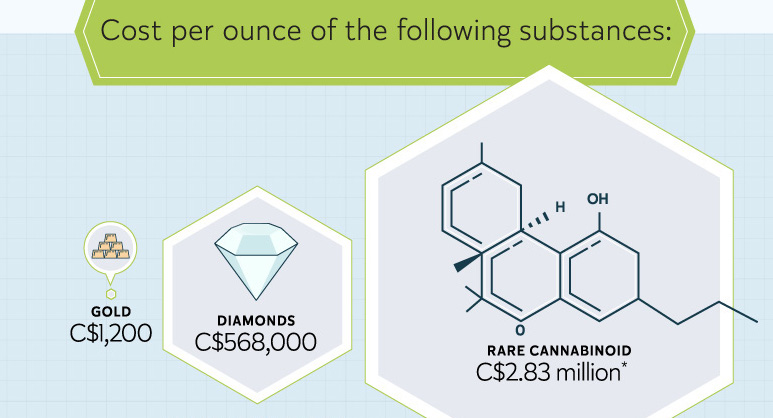
The process of biosynthesis could make it possible to unlock the medical potential of understudied cannabinoids in the cannabis plant.
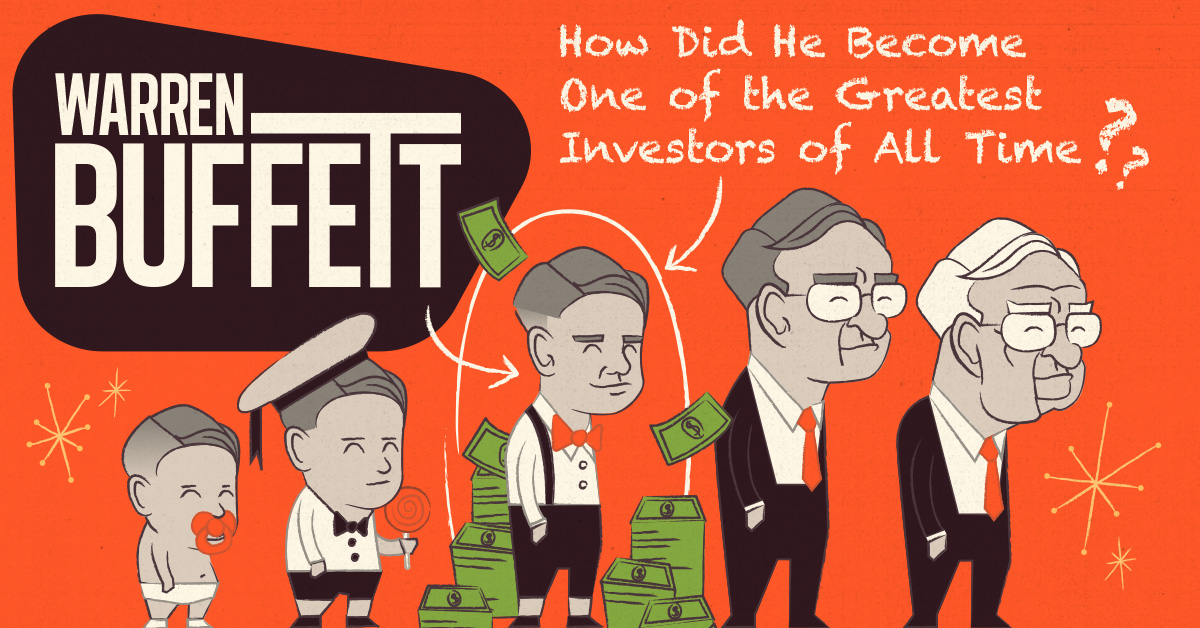
Warren Buffett started his first business at age 5, and bought his first stock at age 11. By the end of high school, he was richer...
From the Chinese invention of paper money in 806 AD to the birth of Paypal, we count down every major disruption in payments in one giant...
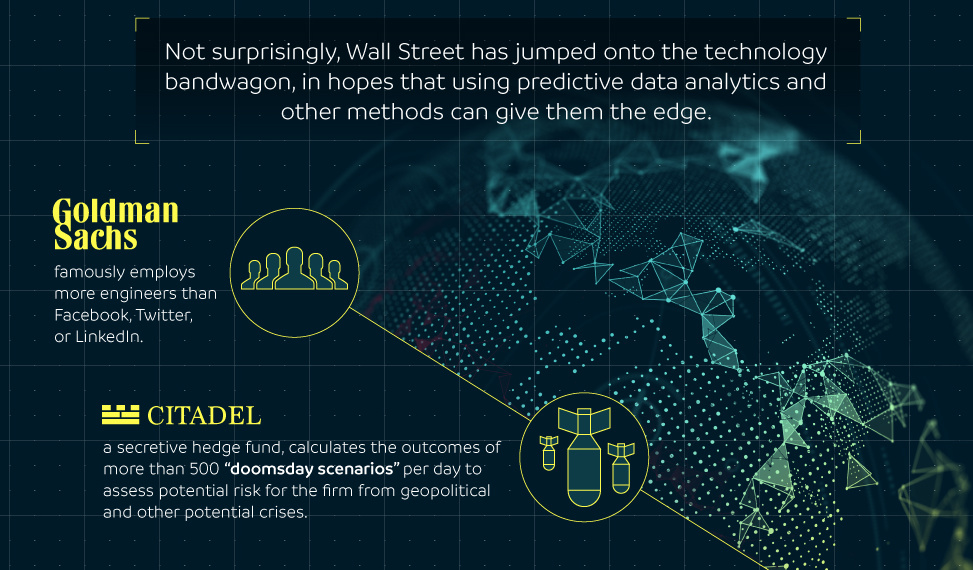
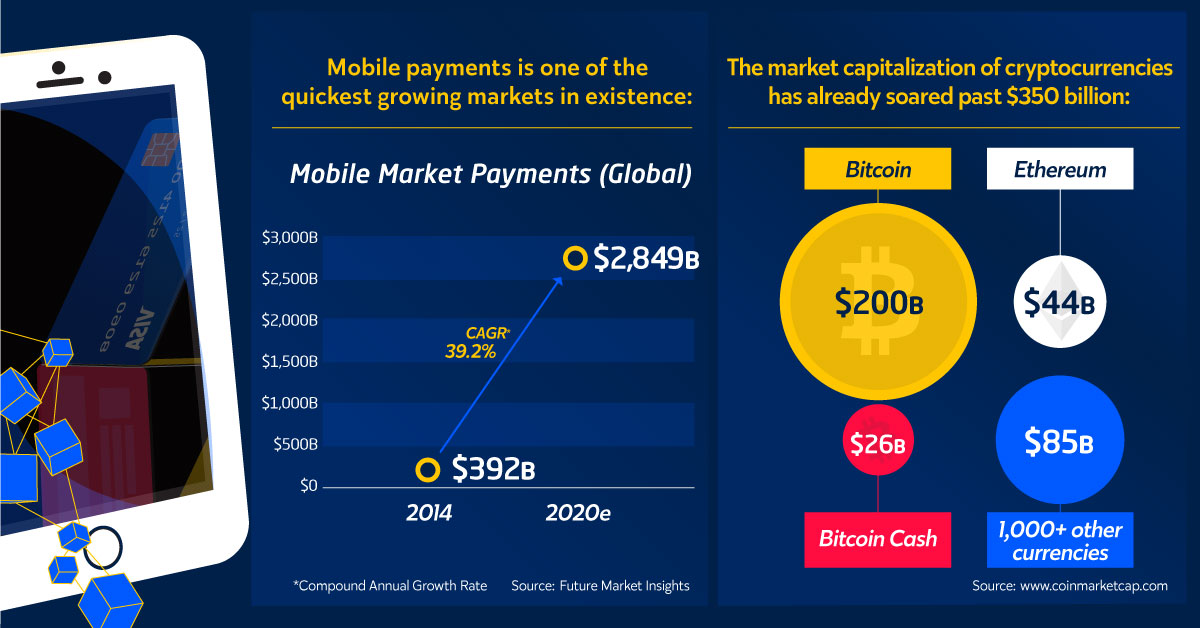
Soon, having information in real-time may not be enough. Here's why predictive data could be a big part of the future for sophisticated, active investors.
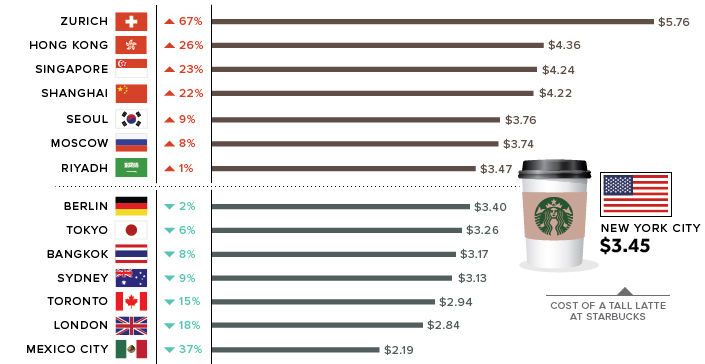
How good is a cup of joe at measuring the variance between different national currencies? We look at the Latte Index, developed by the WSJ, to...
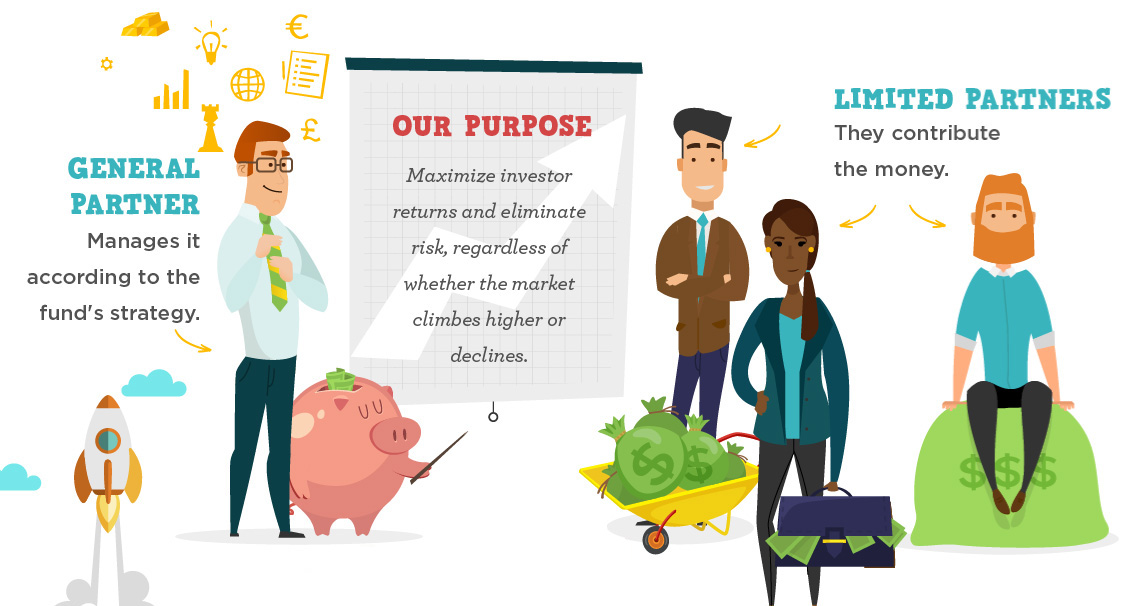
Hedge funds have a reputation for being secretive and elite investment vehicles - but the basics around hedge funds are actually easy for anyone to understand.
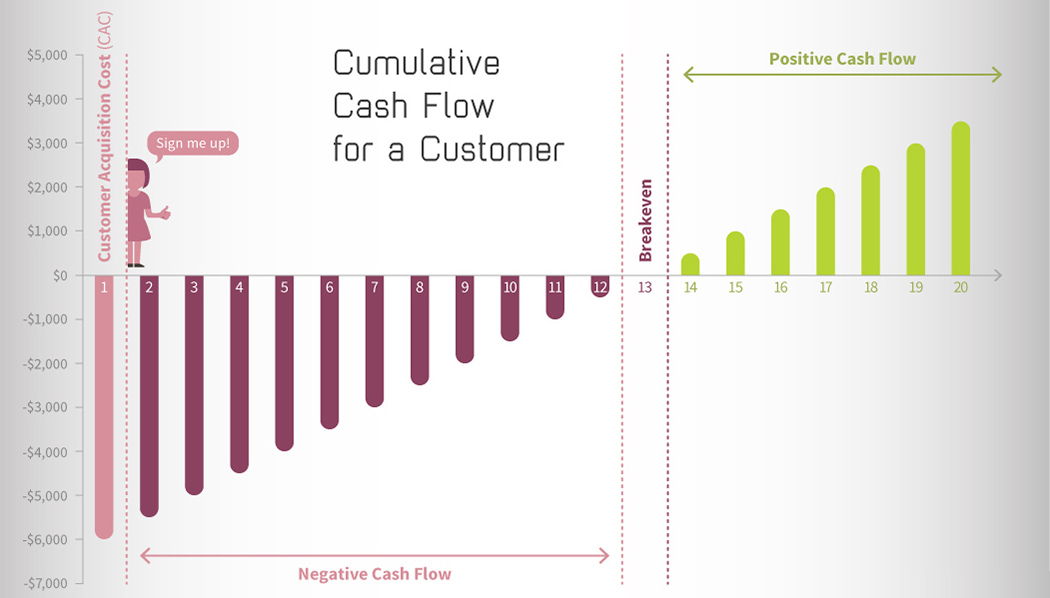
Recurring, predictable revenue is one reason why elite tech investors love making investments in SaaS companies. See the others in this infographic.
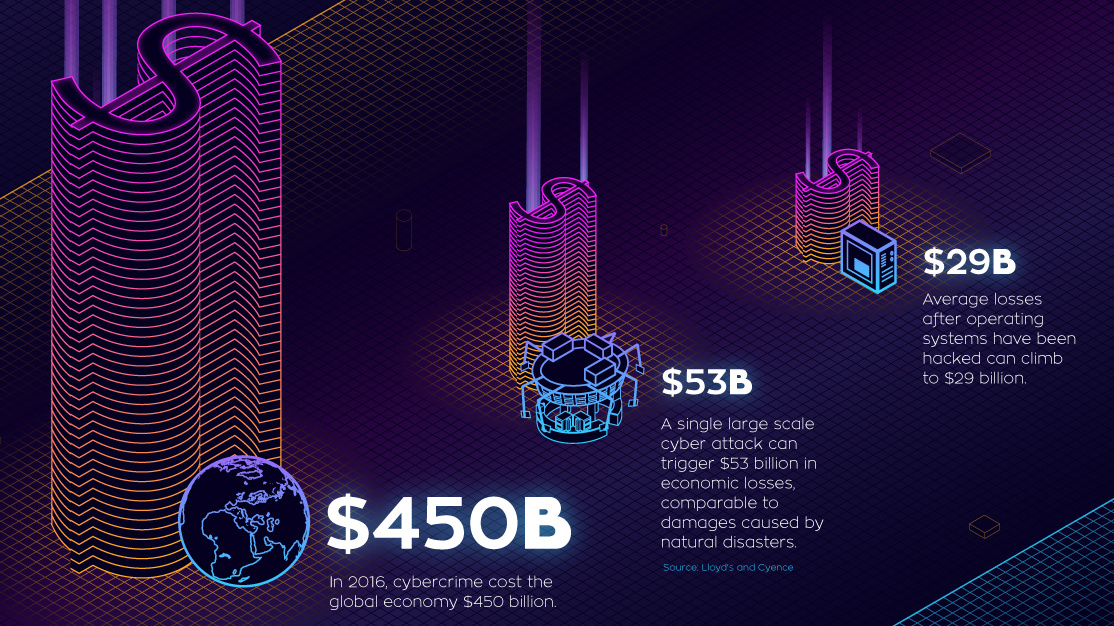
Cybercrime is rising, and companies like Uber, Equifax, and HBO are getting hit hard. See the resulting boom in cybersecurity spending in this infographic.
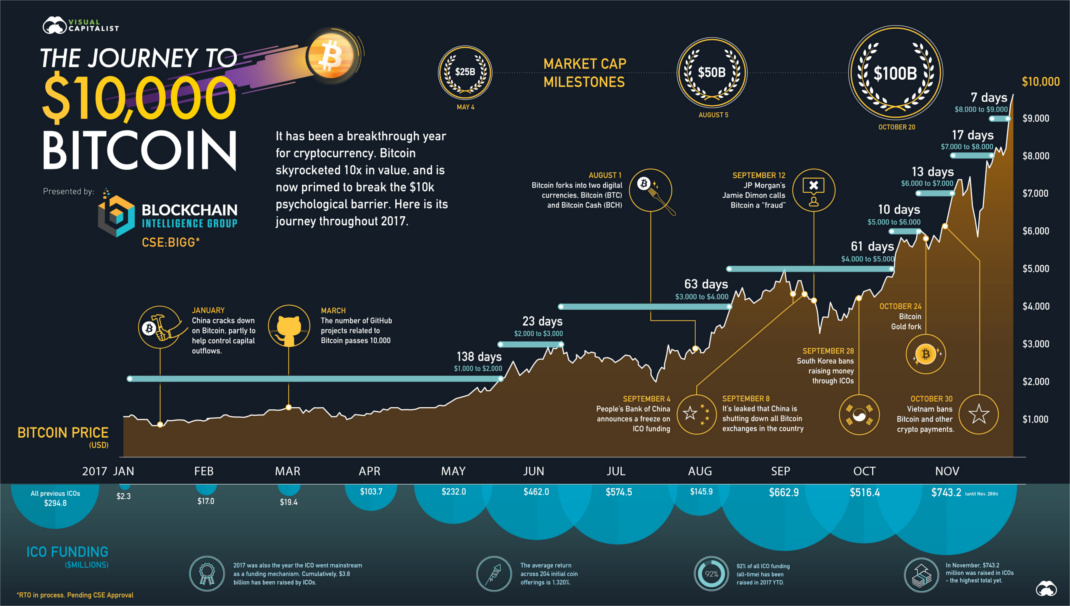
How did Bitcoin jump 10X in value in the matter of just 11 months? This timeline visualizes the events in the journey to $10,000 Bitcoin.
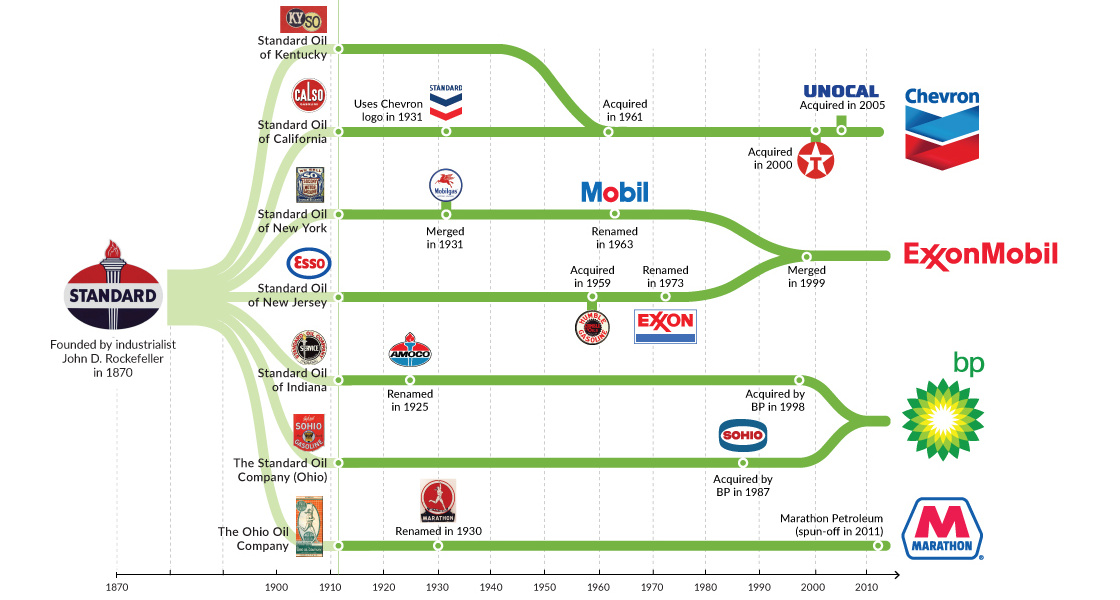
In 1911, John D. Rockefeller's Standard Oil was broken up into 34 pieces by the Supreme Court. Today, the remnants form the base of the U.S....
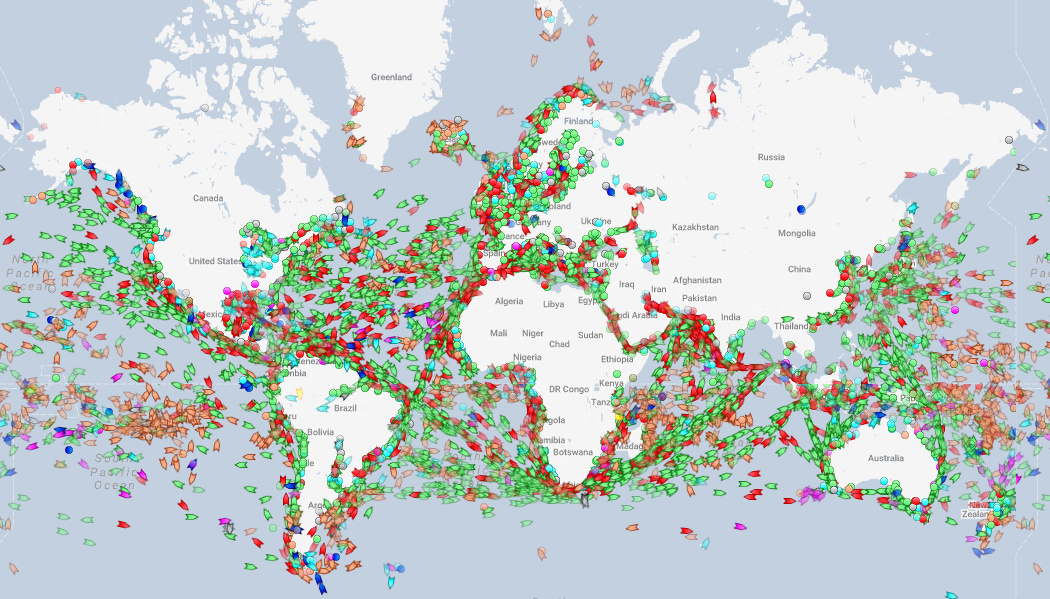
We show you a website that tracks every ship in real-time, and use it to highlight the world's oil chokepoints, the coast of Somalia, and other...
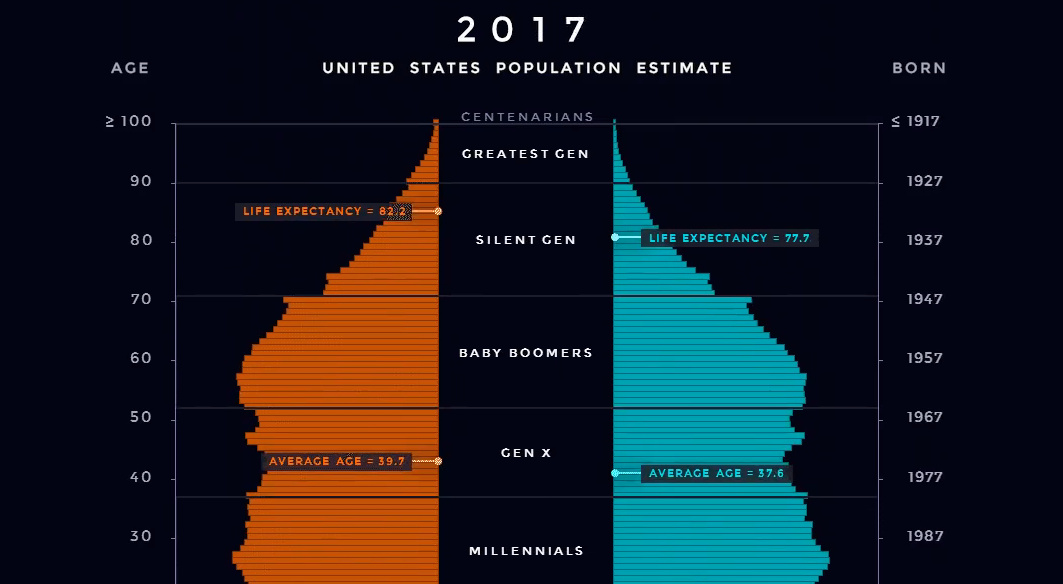
Watch the generations fly by in this animation showing the changing age composition of the U.S. population.
What would happen if you had invested $1,000 in Apple, Starbucks, Walmart, Coca-Cola, or other household names right before the market crash?
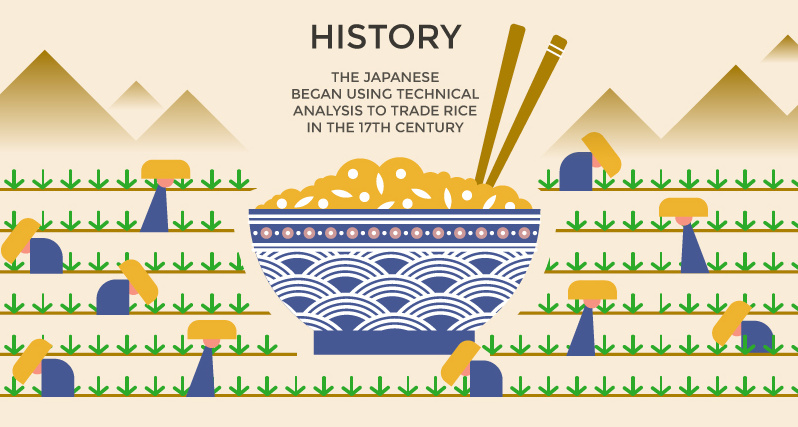
Originally used by 17th century rice traders in Japan, today candlestick charts are used by investors and traders to gauge the momentum of securities.
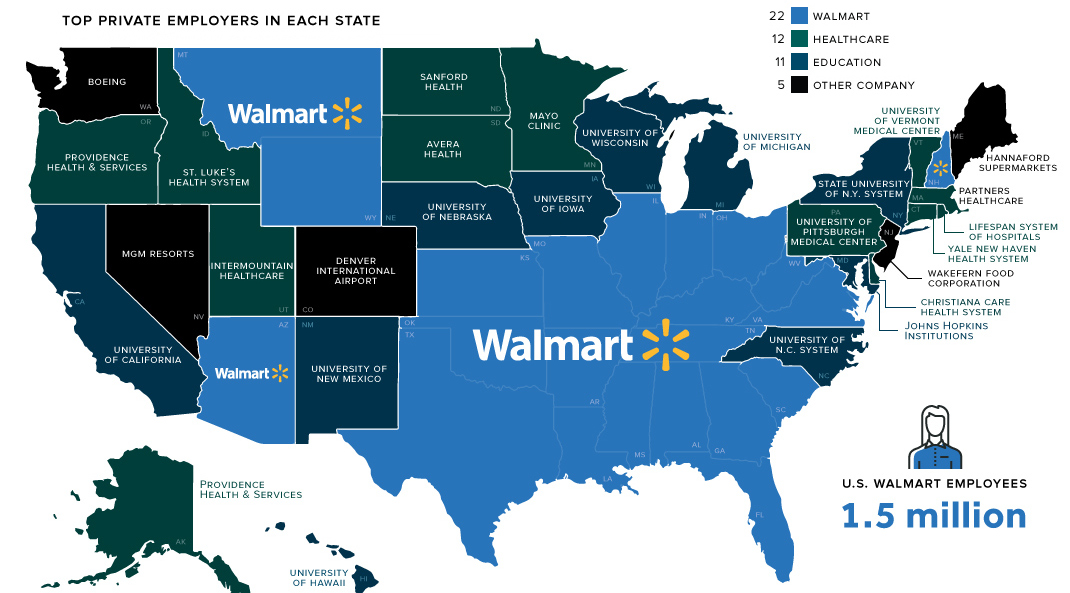
Walmart employs 1.5 million people across the country - and the retail behemoth is now the largest private employer in 22 states.
This infographic tells Tesla's history like no other. From being on the brink of bankruptcy to Musk's dramatic takeover, see Tesla's early story in graphics.
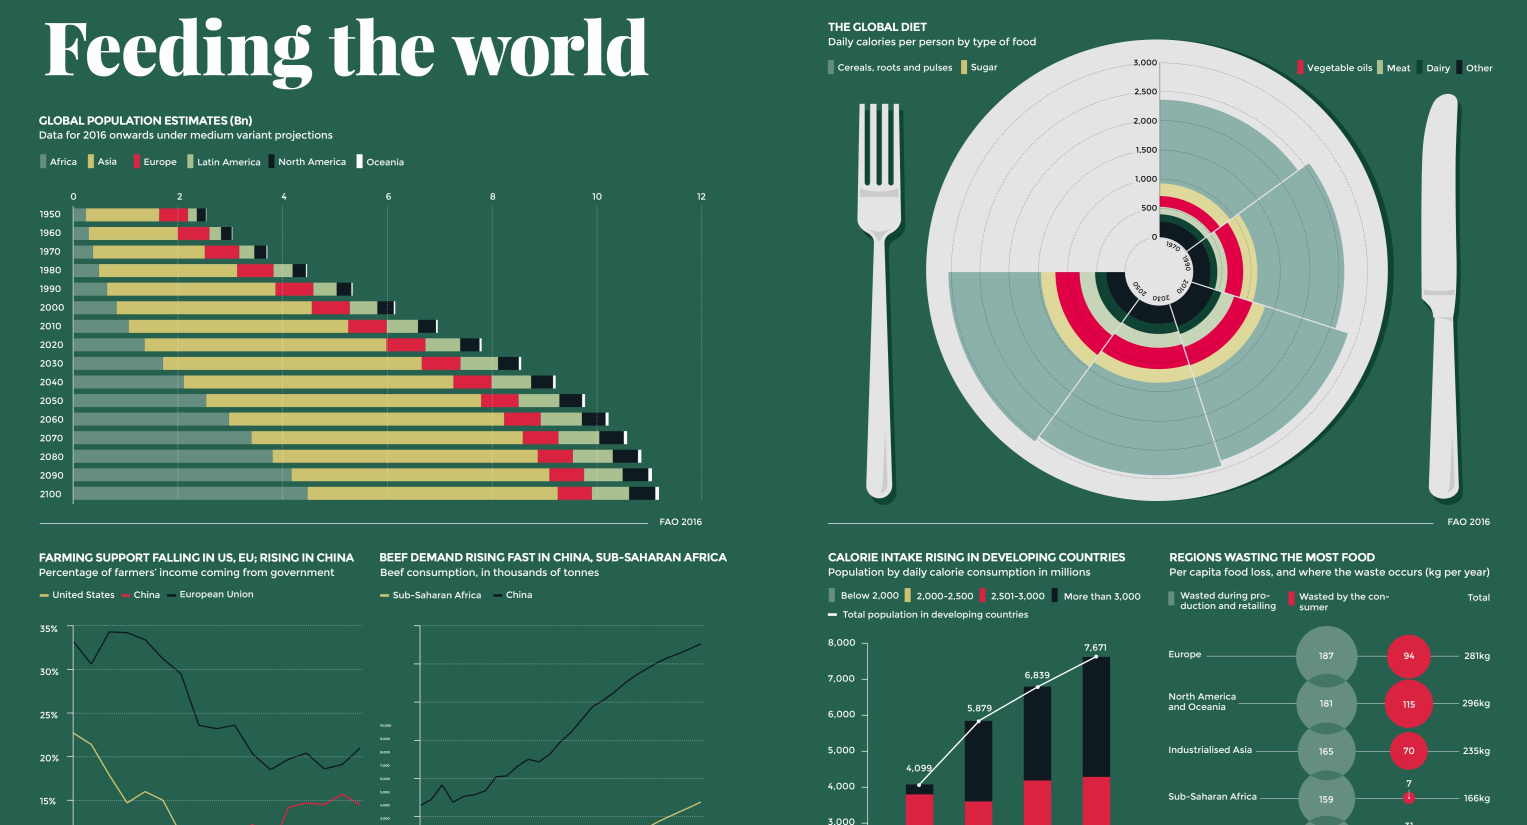
The global population will grow by billions in the coming years - but more importantly, the global diet is changing rapidly, as well.
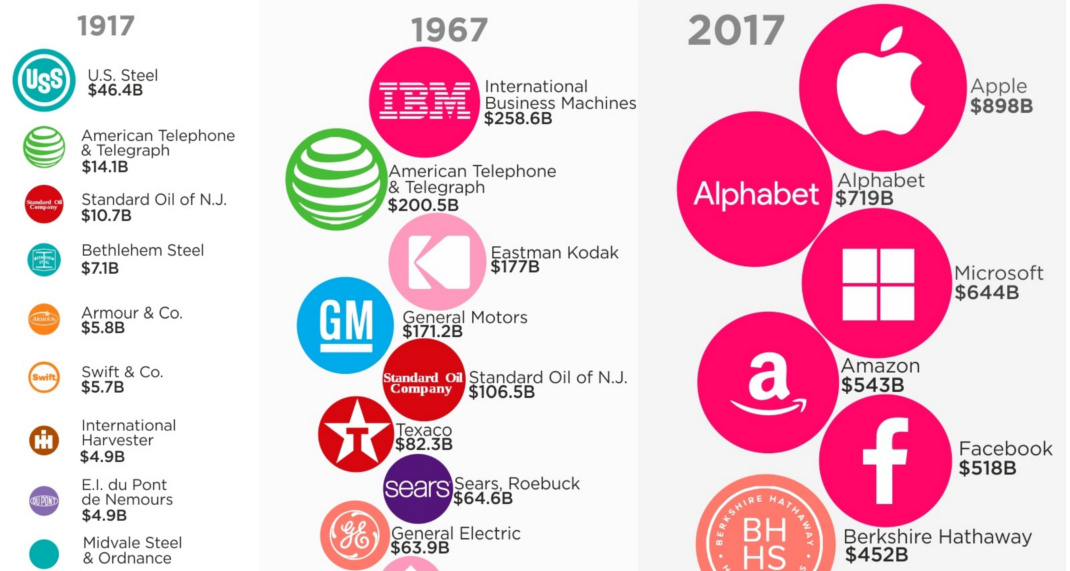
How have the most valuable companies in the U.S. changed over the last century? Today's graphic shows the evolution from U.S. Steel to Apple.
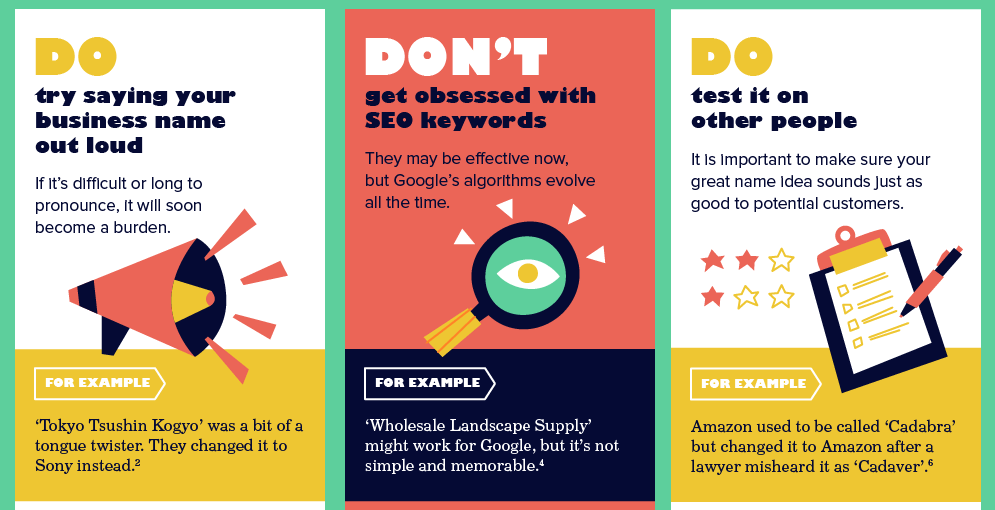
Guidelines to follow for coming up with a business name, along with the lessons learned the hard way by companies like Amazon, AOL, and Sony.
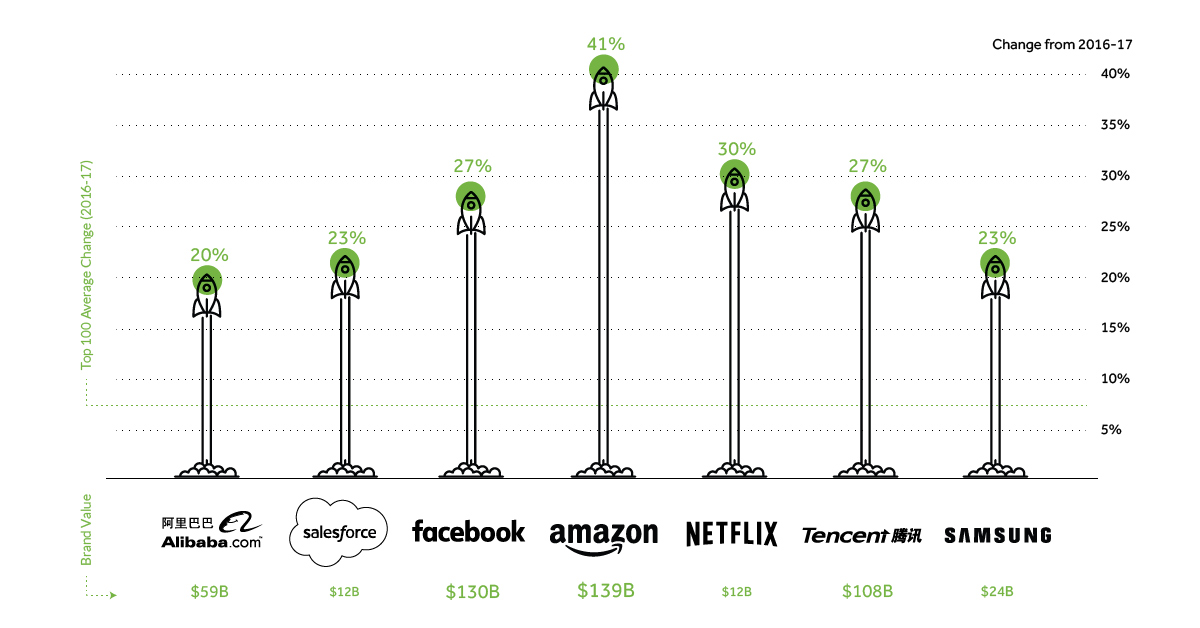
Which brands are winning the hearts of consumers the quickest? Today's charts look at trends in brand value, showing the fastest growing brands globally.
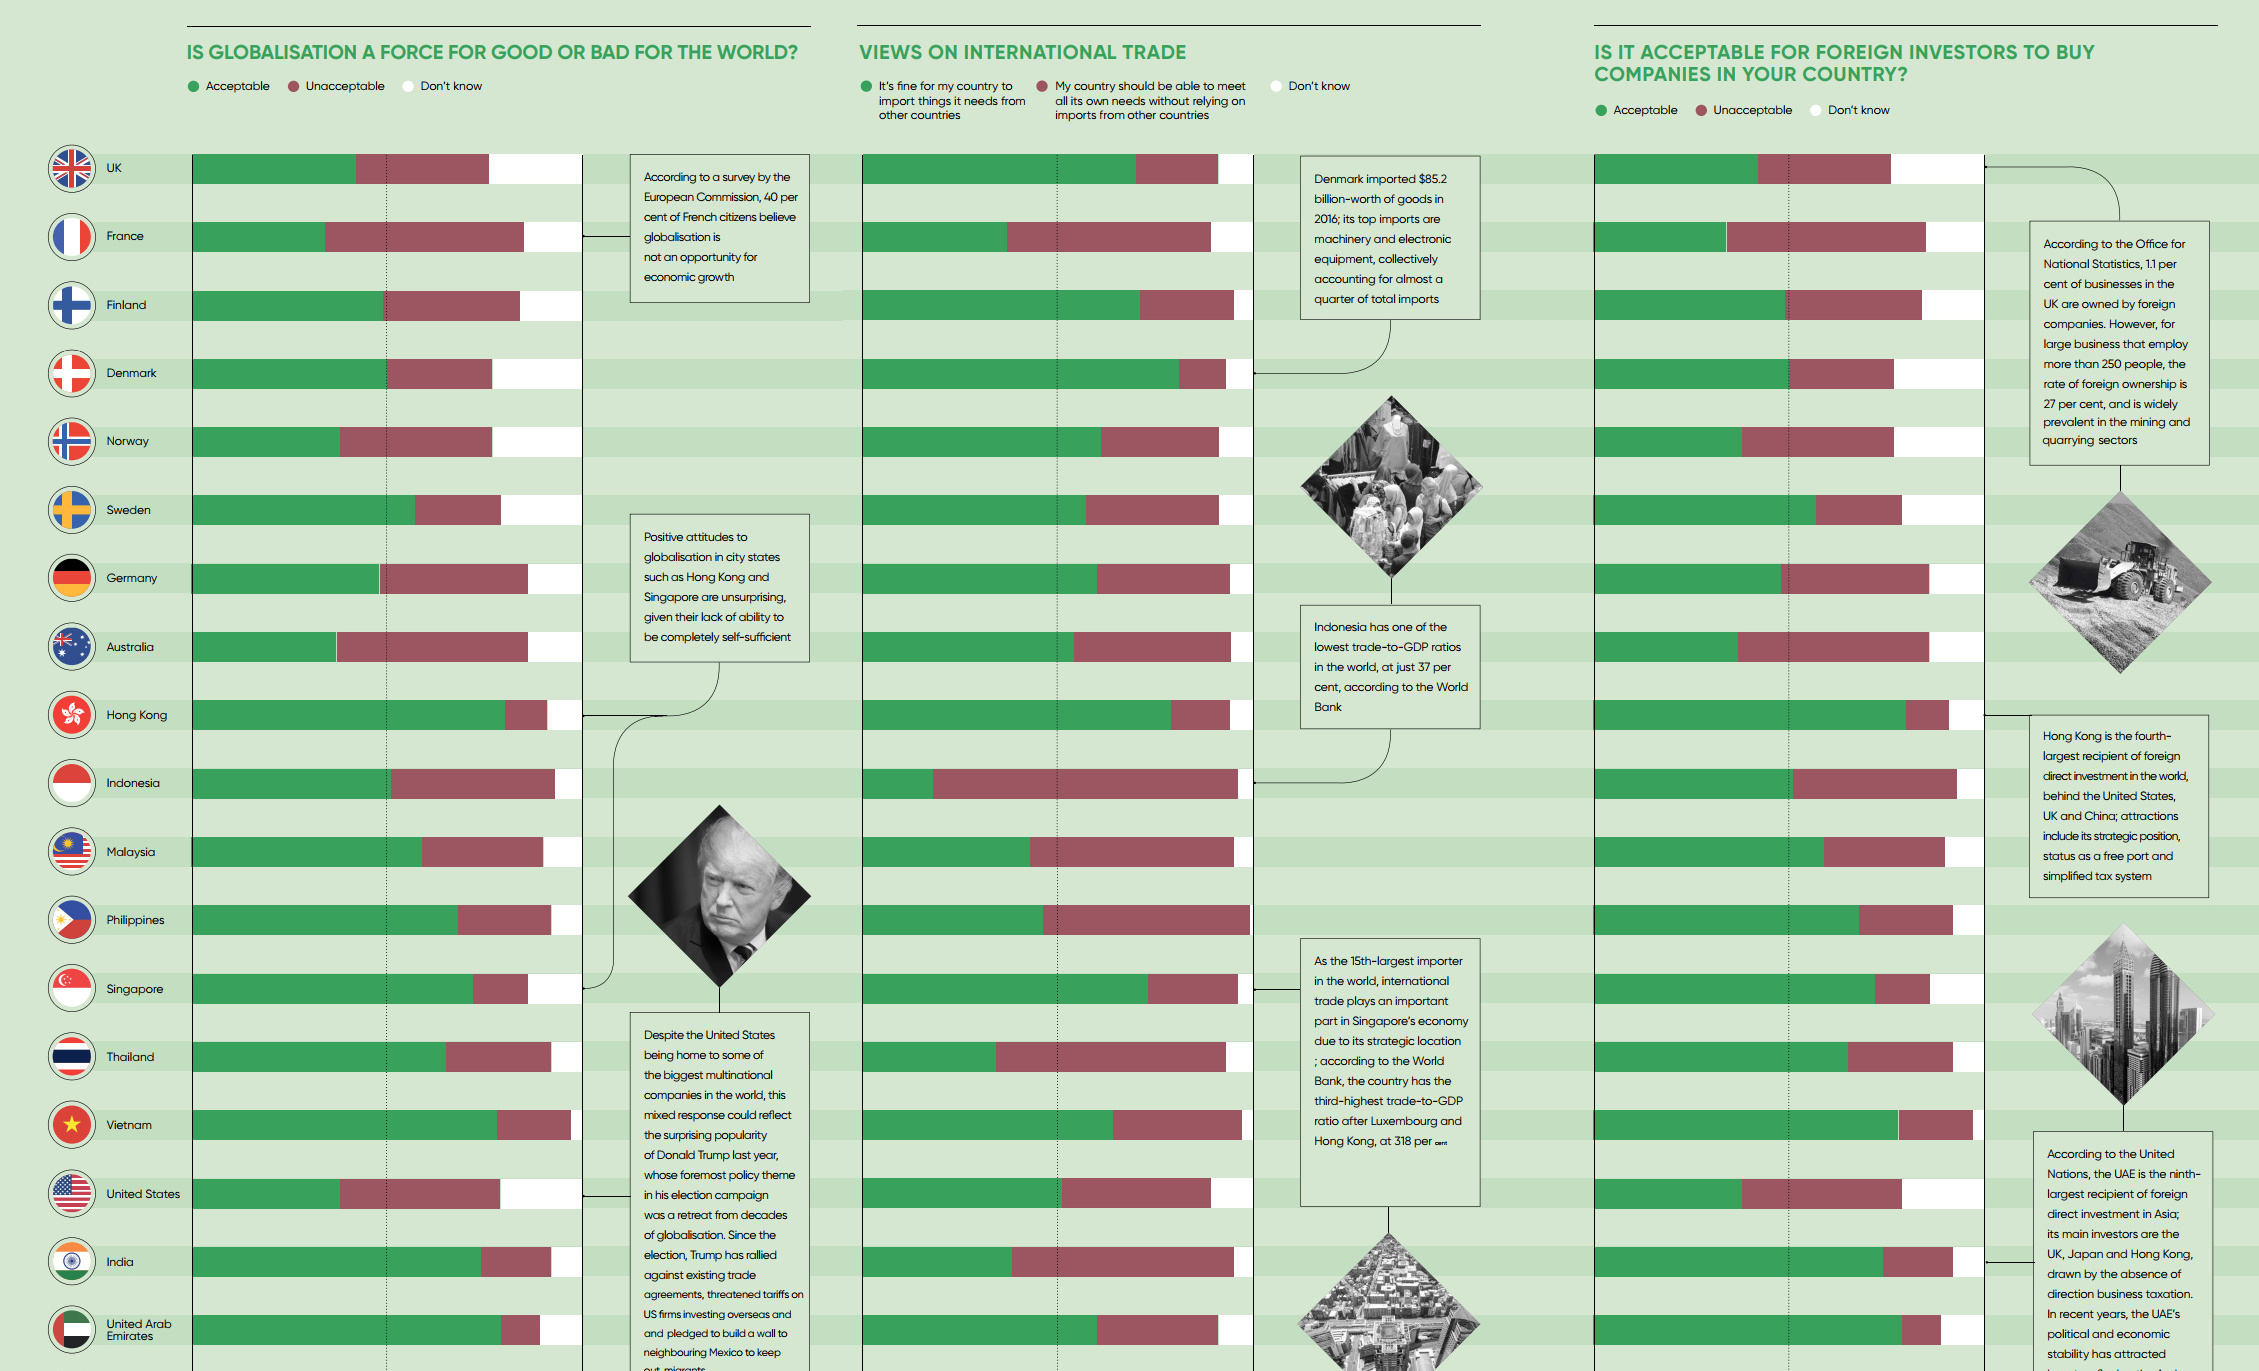
Is globalization a force for good or bad? The answer to this question depends greatly on who you ask - here is a survey of people...
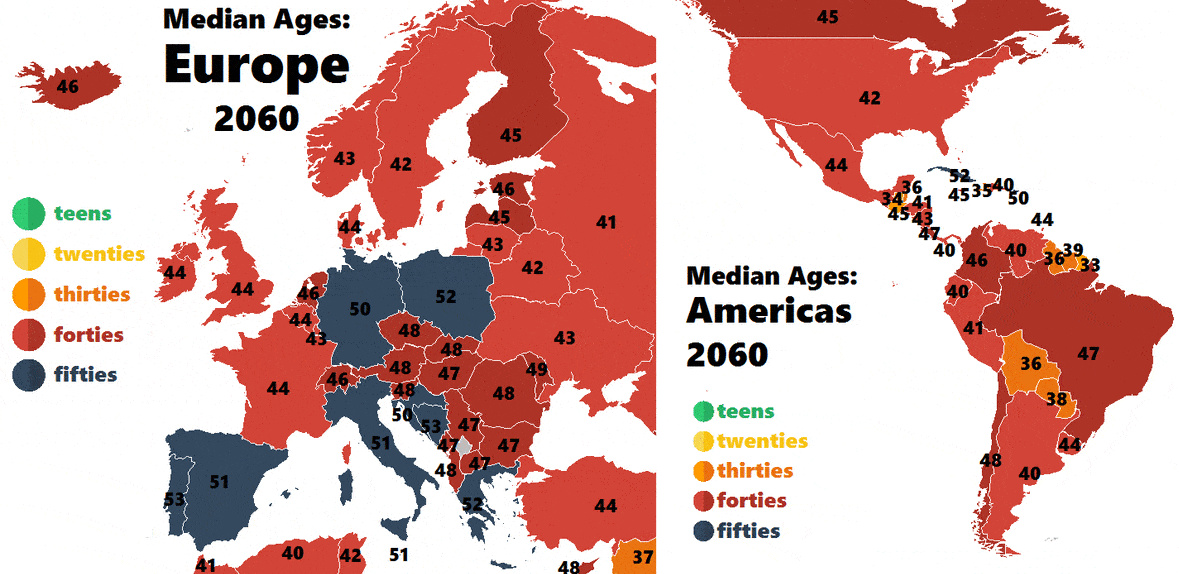
How fast are countries in Europe and the Americas aging? These colorful animations show how the median age is projected to change up until the year...
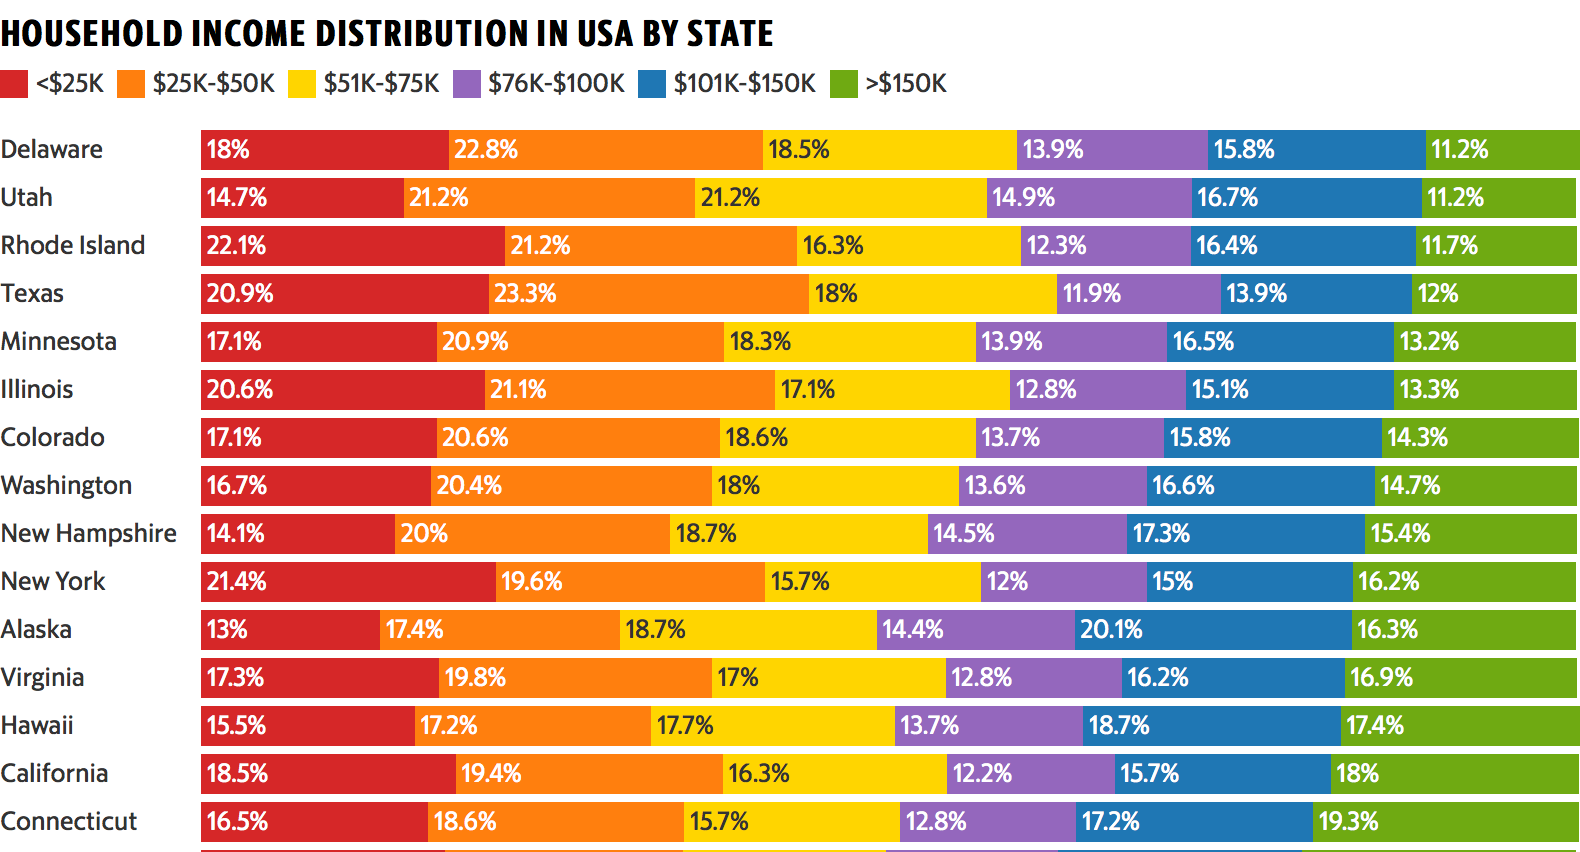
This colorful data visualization breaks down the household income of each U.S. state into six income brackets.
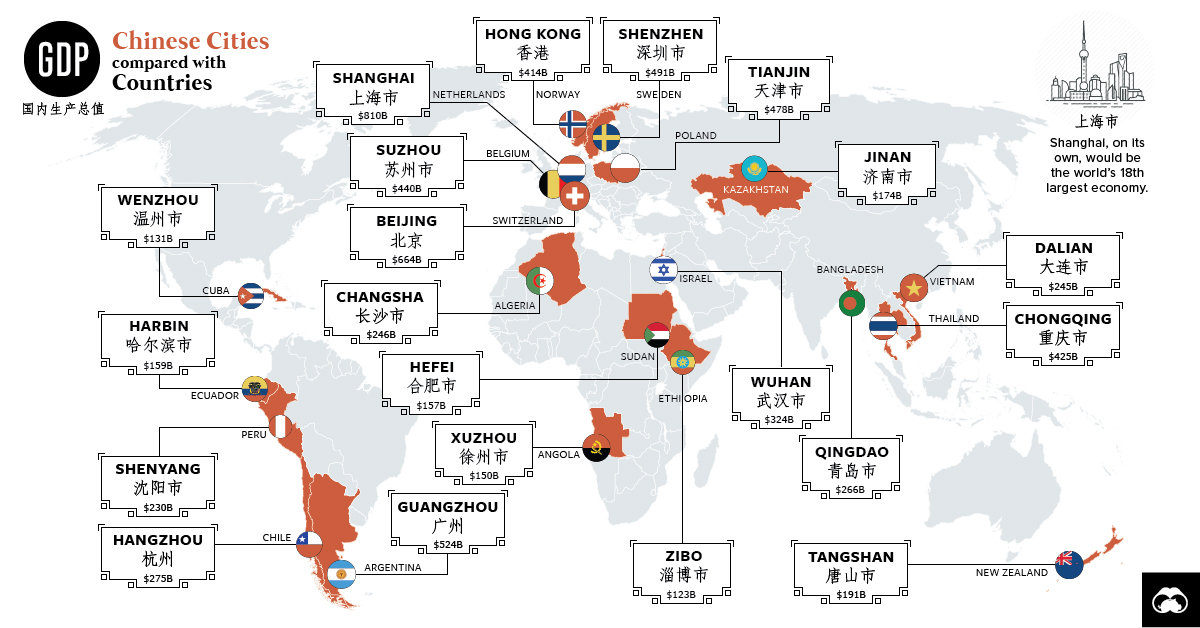
You've probably heard of Chinese cities like Beijing, Hong Kong, and Shanghai - but those actually only scratch the surface of China's economic picture.
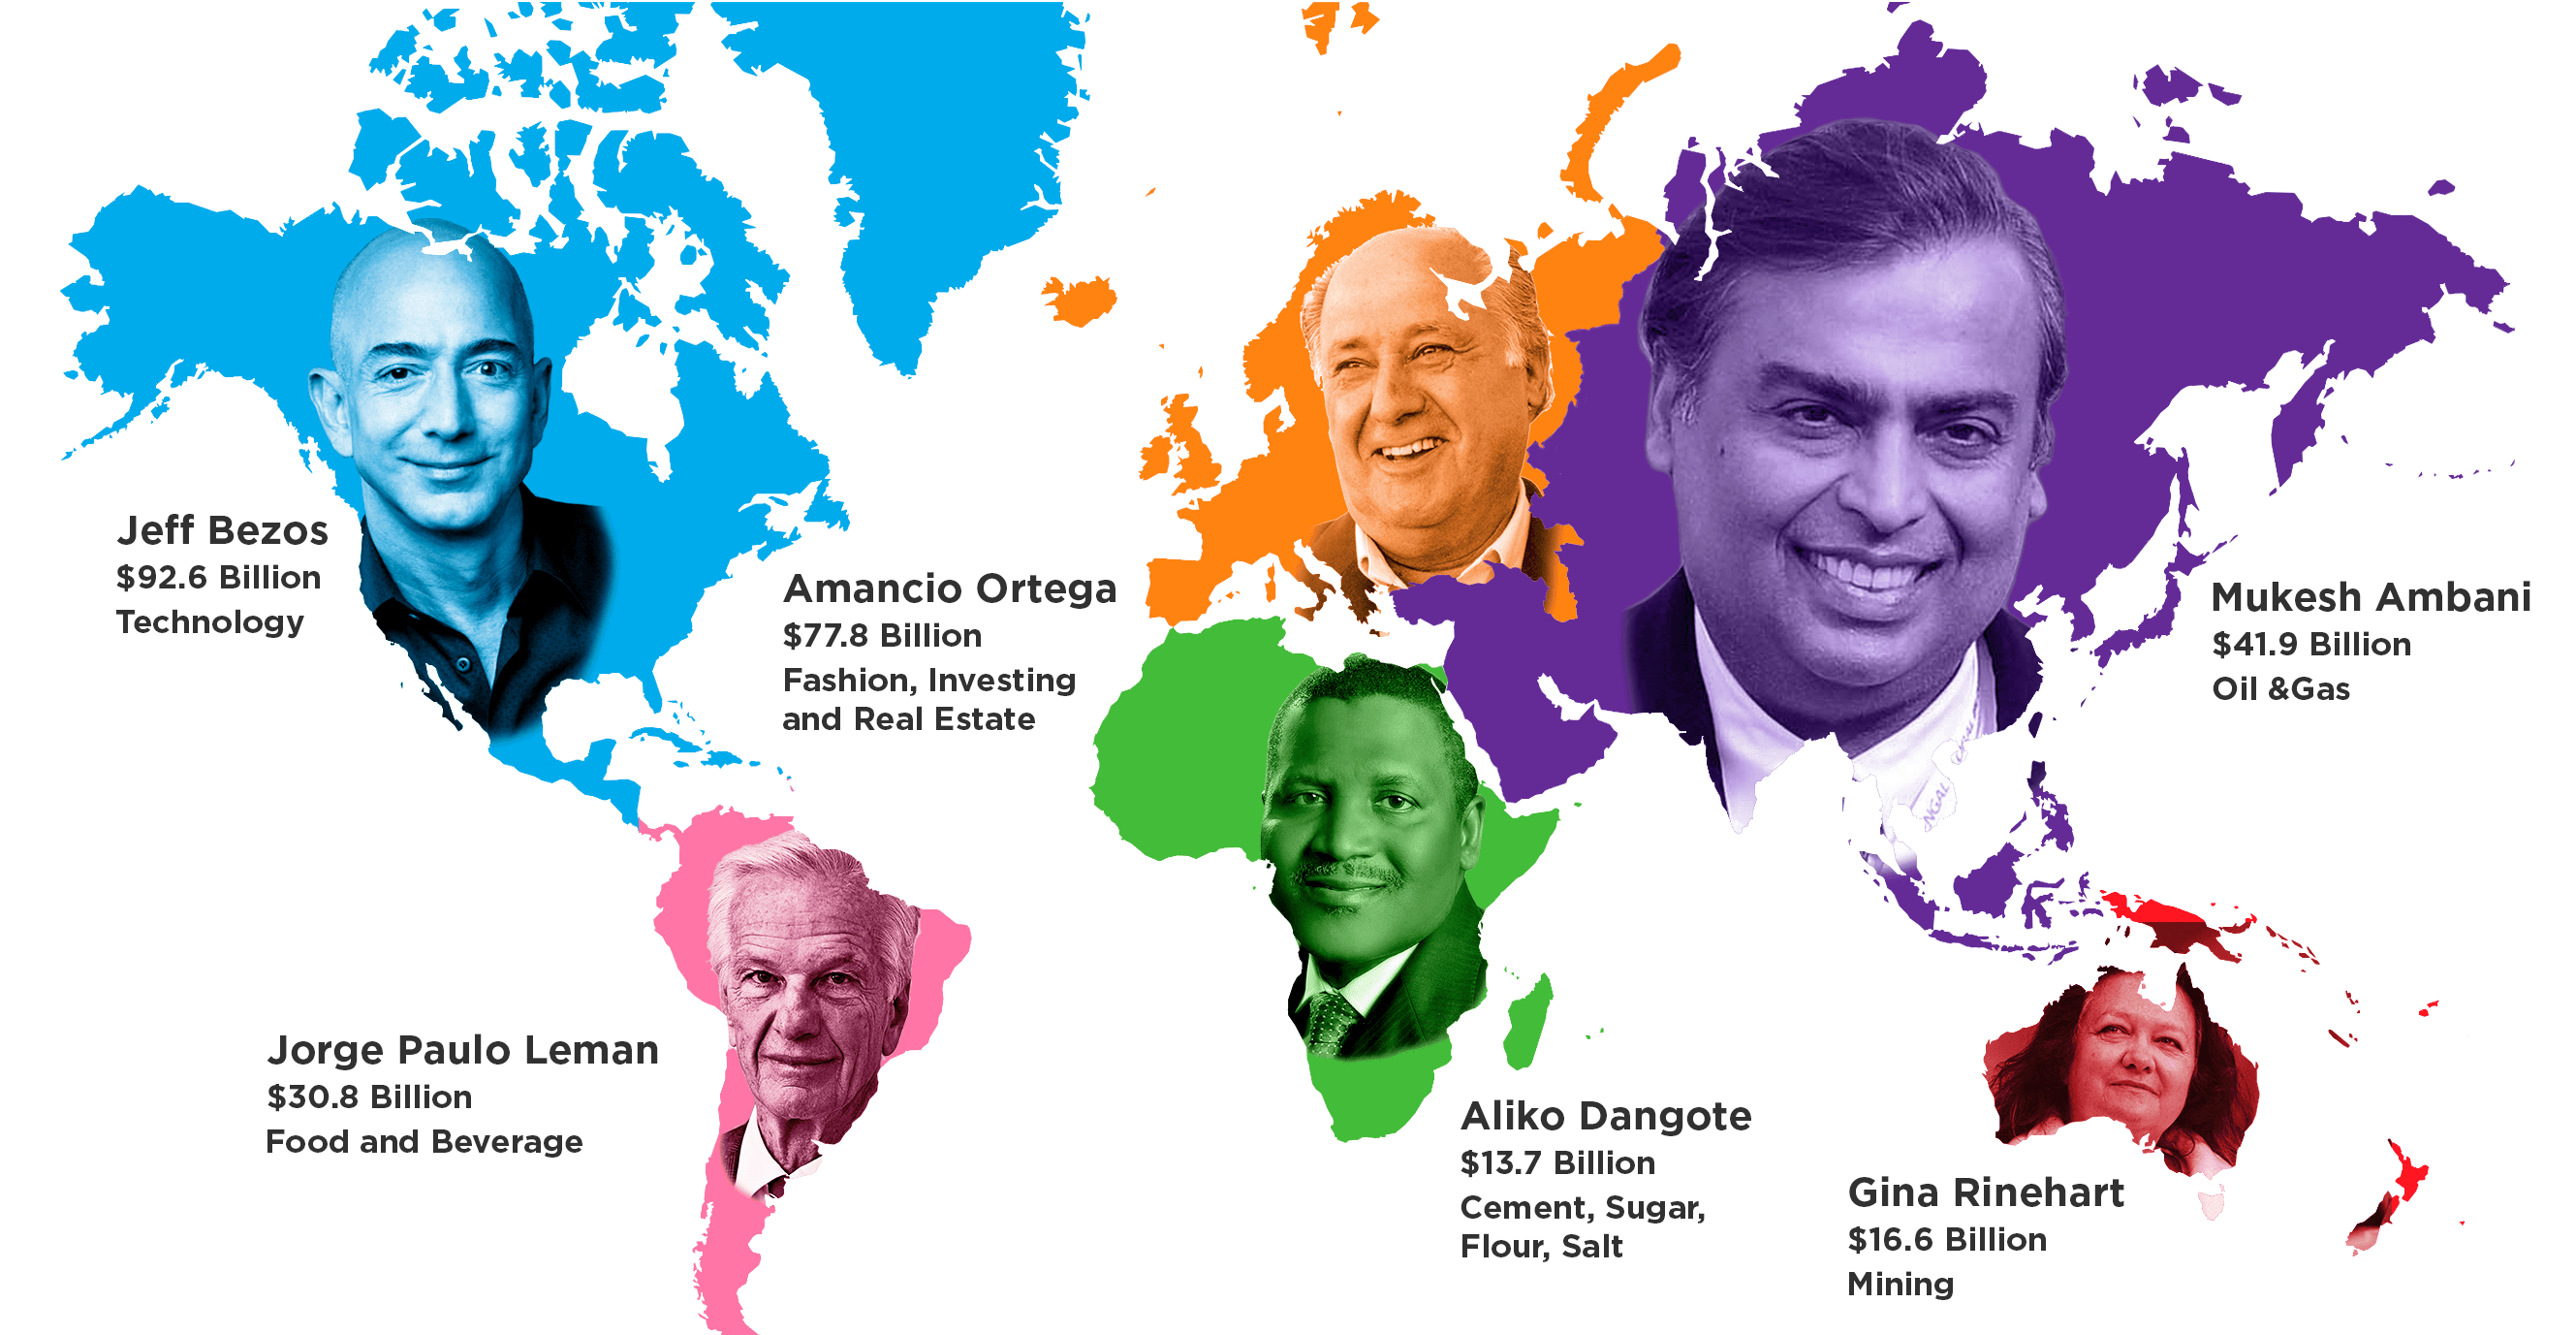
The net worth and source of wealth for the richest person on each continent. It includes Jeff Bezos, who is now the world's richest person overall.
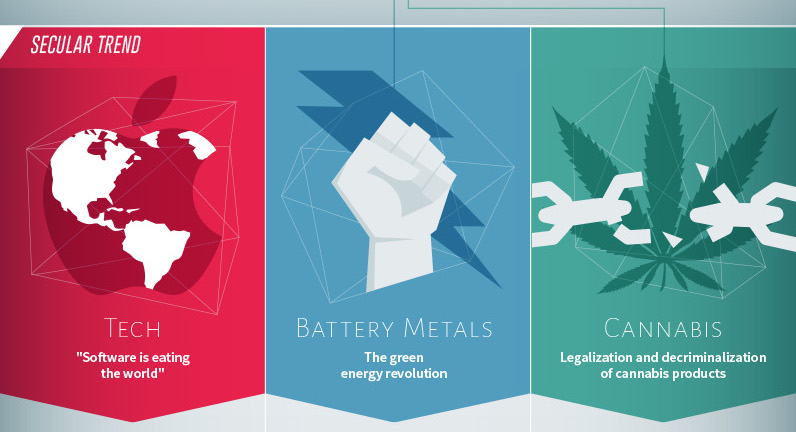
The tech sector has dominated the stock market for years - but battery metals and cannabis could give tech a run for its money.
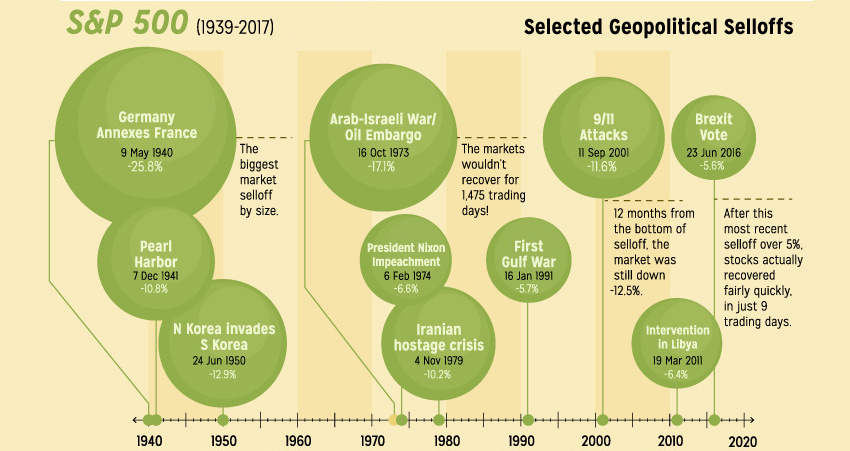
With geopolitical risk at the forefront of discussion again, here are the ways the world's billionaire investors are hedging against potential black swans.
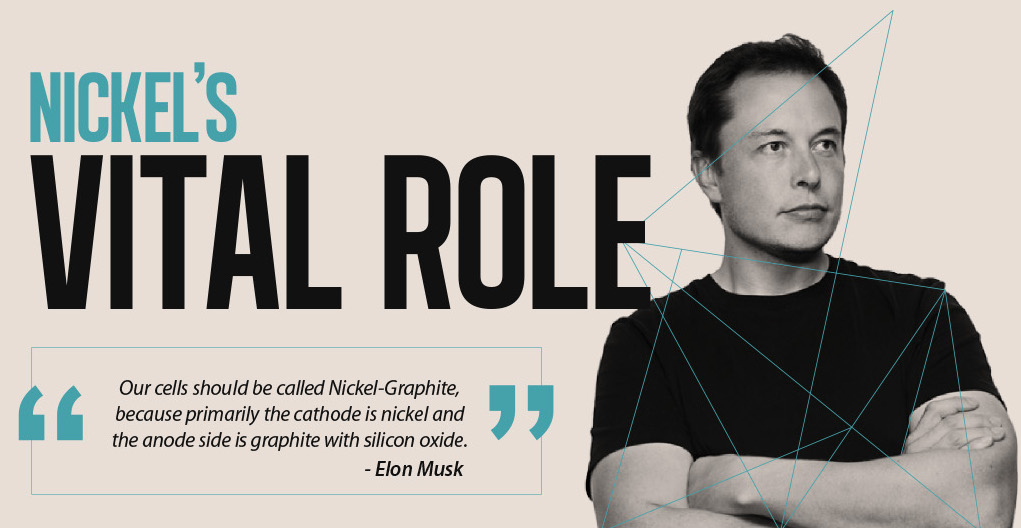
Nickel is the most important metal by mass in lithium-ion batteries, and its role is only increasing going forward.
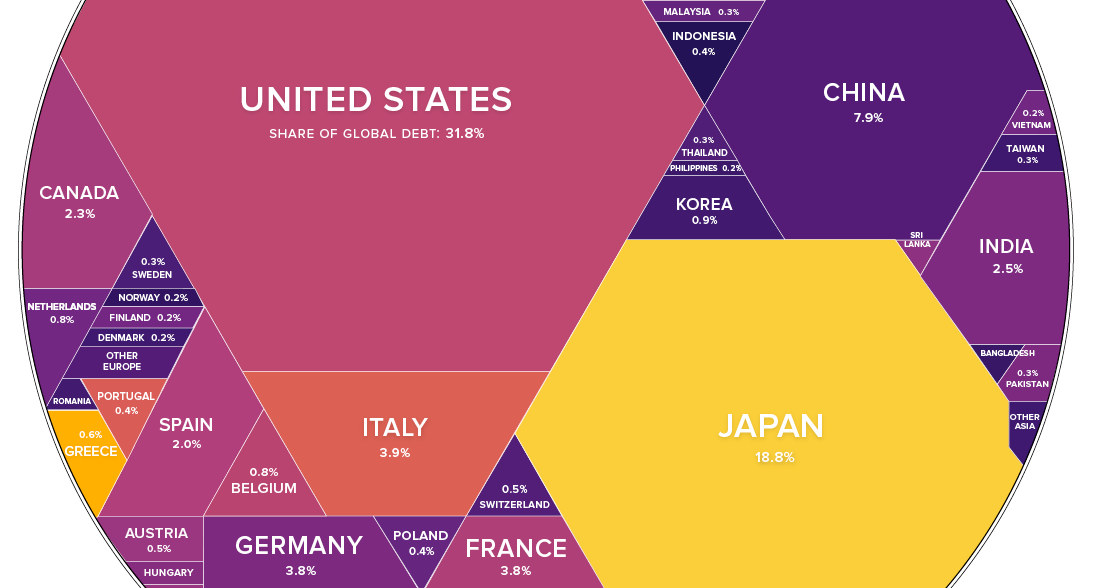
How much debt has been racked up by governments? This stunning infographic shows each country's share of world debt, along with their debt-to-GDP ratio.
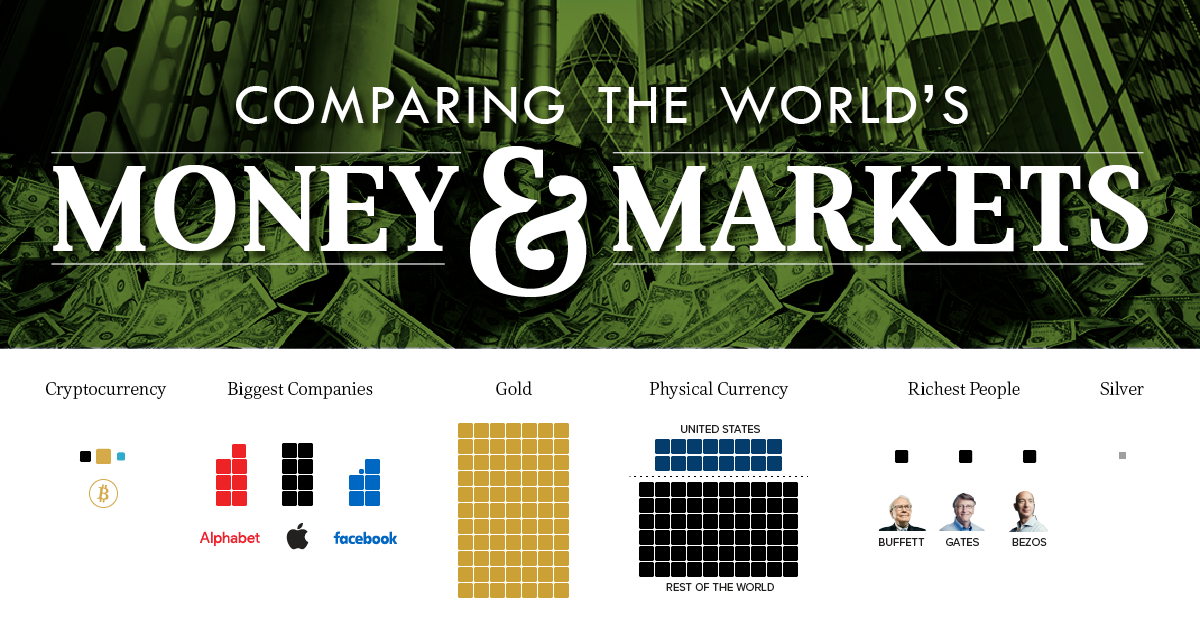
How much money exists in the world? This updated visualization compares the world's richest people, companies, and markets with the world's money supply.

By the end of 2017, it's estimated that 16.3% of Americans will live in smart homes, and this percentage will increase to 35.6% by 2021.
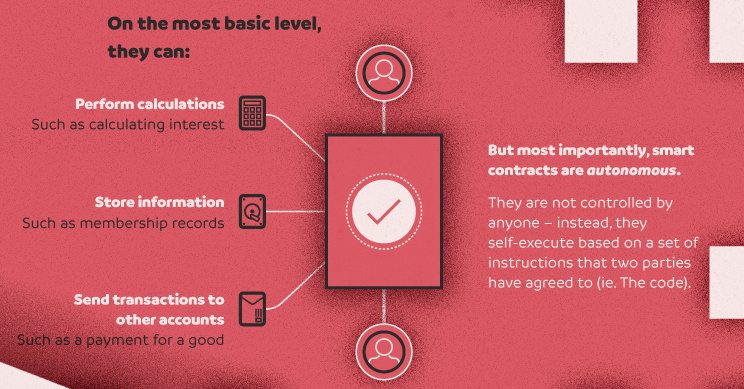
The applications of blockchain tech go way beyond just payments. See how smart contracts work in this infographic, and how they may shape entire industries.
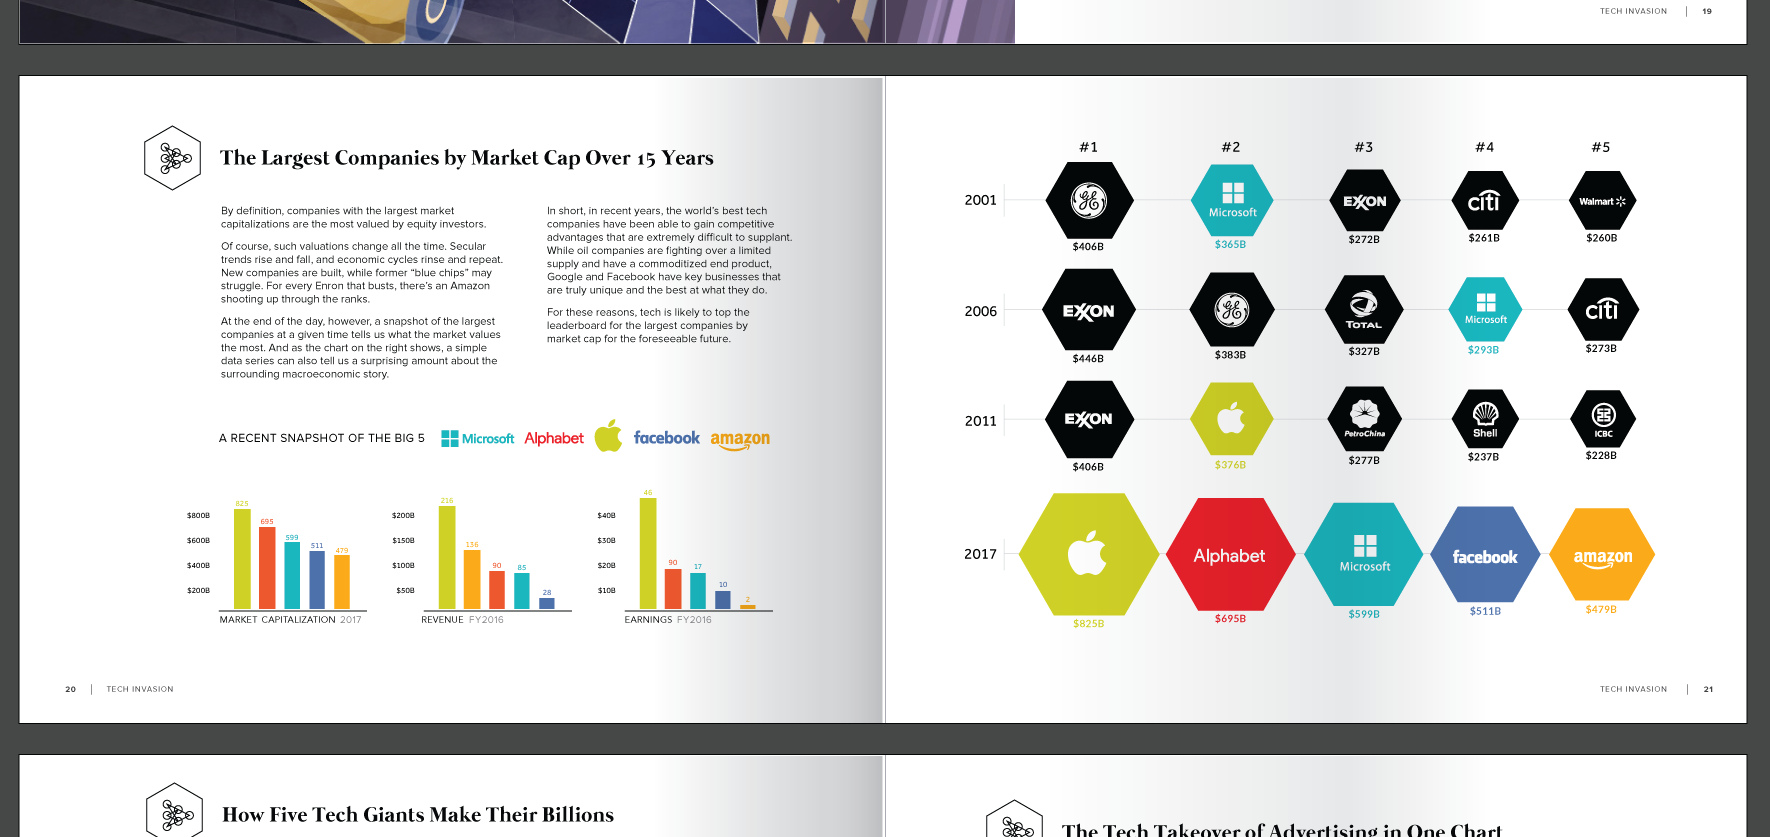
Two example spreads from Visual Capitalist's new book 'Visualizing Change'. Over 12 pages of infographics to sample here, as they would appear in the book.
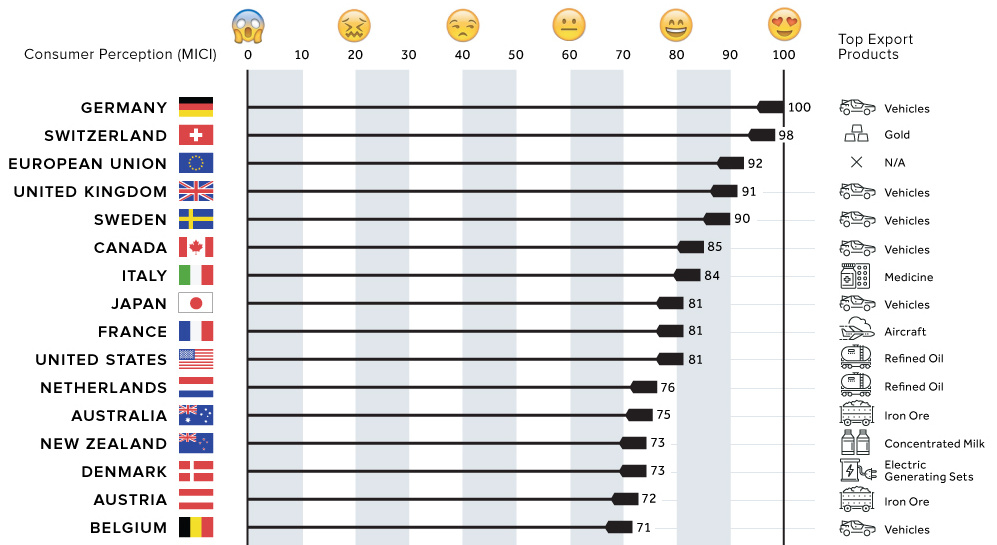
Which countries have the best reputations for the goods they produce? We look at survey results of 43,000 consumers on products with a country of origin.
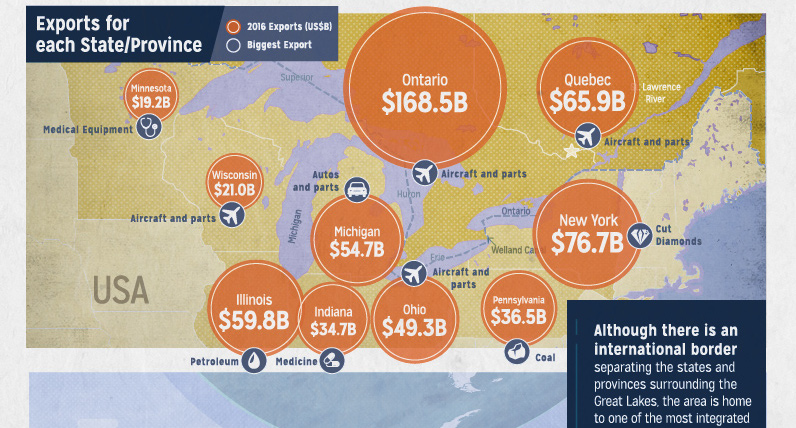
Despite having an international border, the Great Lakes area is tightly integrated - a necessity to compete in the competitive and borderless global economy.
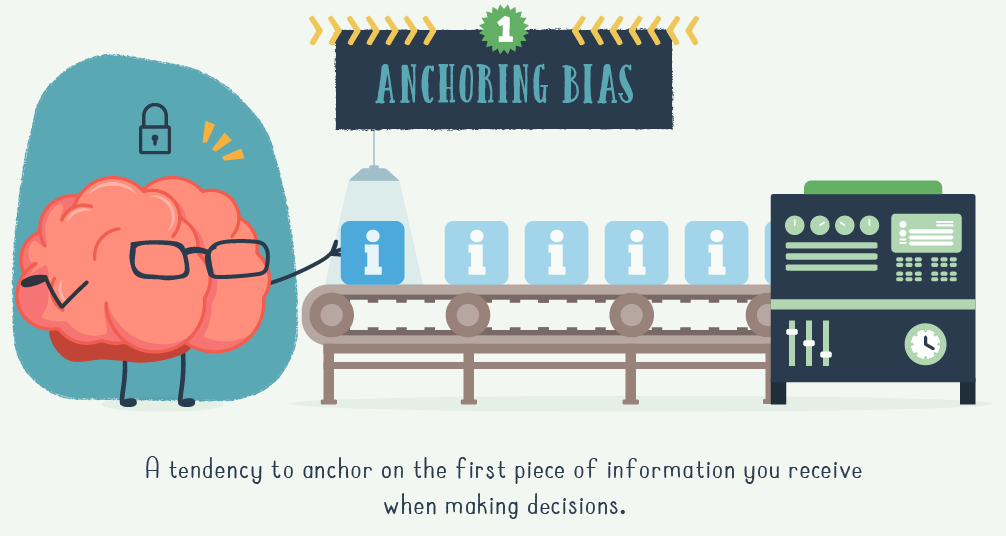
To be a better investor, make sure you take note of these five cognitive biases that can completely trip up your investment decisions.
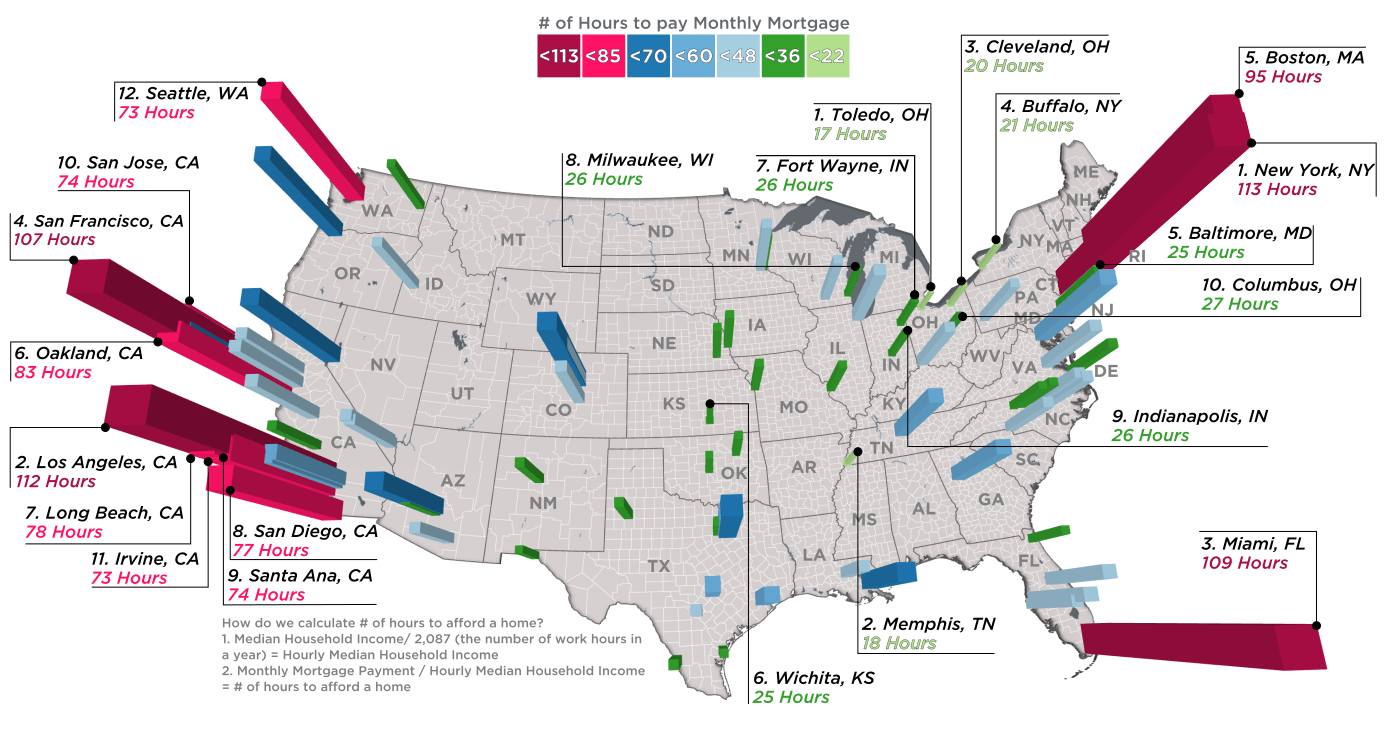
Every month, the average New Yorker needs 113.5 hours of work to pay down a mortgage, while in Memphis it's just 18.4 hours.


