Investor Education
Volatility 101: An Introduction to Market Volatility

Volatility 101: An Introduction to Market Volatility
Almost all assets see fluctuations in value over time.
But while price swings are a common phenomenon in most asset classes that exist, they are the most famous in the stock market.
These upward and downward movements in price are known as volatility, which is defined as “a measure of the frequency and severity of price movement in a given market”.
Understanding Volatility
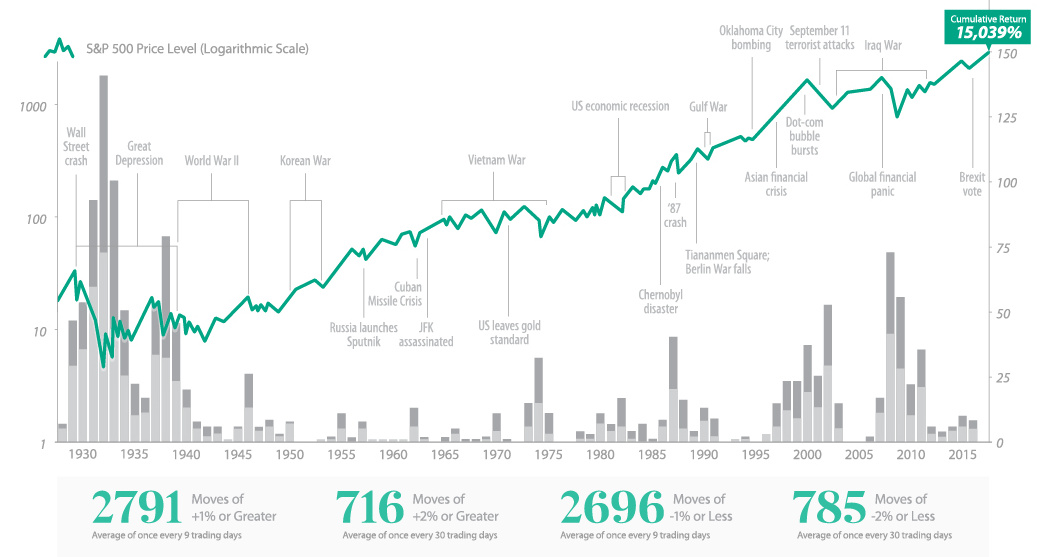
Today’s infographic comes to us from Fisher Investments, and it serves as an introduction to the concept of volatility, along with offering a perspective on volatility’s impact on investments.
Why are certain times more volatile than others?
In the short term, volatility is driven by changes in demand, which is largely related to changes in earnings expectations. These expectations can be affected by:
- Earnings reports
- New economic data
- Company leadership changes
- New innovations
- Herd mentality
- Political changes
- Interest rate changes
- Market sentiment swings
- Other events (economic, political, etc.)
Often the media and investors assign certain narratives to price changes, but the reality is that the stock market is very complex, and has many underlying factors that drive movements.
What ultimately matters for volatility is demand: if stocks move up or down on a given day, we can say definitively that demand for stock was more (or less) than stock supply.
Calculating Volatility
Technically speaking, volatility is a statistical measure of the dispersion of returns for a given security or market index over a specific timeframe.
In other words, two stocks may have the same average rate of return over a year, but one may have daily moves of 1%, while the other may jump around by 5% each day. The latter stock has a higher standard deviation of returns, and thus has higher volatility.
Here’s what you need to know about standard deviation, which is a common measure of volatility:
- Roughly 68% of returns fall within +/-1 standard deviation
- To calculate standard deviation, differences must be squared. This means negative and positive differences are combined
- Standard deviation tells you how likely a particular value is, based on past data
- Standard deviation doesn’t, however, show you the direction of movement
This all gets more interesting as we look at the market as a whole, in which thousands of stocks (each with their own individual volatility) are moving up and down simultaneously.
Market Volatility
Now that you can see how volatility plays out with individual stocks, it makes sense that market volatility is the overall volatility from the vast collection of stocks that make up the market.
In the United States, the most watched stock market index is the S&P 500 – a collection of 500 of the largest companies listed in the country. One measure of the volatility of the S&P 500 is the CBOE Volatility Index, or as it is known by its ticker symbol, the VIX.
Volatility and market sentiment in the overall market are important, because humans tend to experience the pain of loss more acutely than the upside of gains – and this can impact short-term decision making in the markets.
Negative price swings in the wider market can be distressful and unnerving for investors, and high volatility does present some challenges:
- Uncertainty in the markets can lead to fear, which can lead investors to make decisions they may otherwise not make
- If certain cashflows are needed at a later date, higher volatility means a greater chance of a shortfall
- Higher volatility also means a wider distribution of possible final portfolio values
That said, volatility also represents a chance of better returns than expected – and for long-term investors that are patient, volatility can help drive outcomes.


Investor Education
How MSCI Builds Thematic Indexes: A Step-by-Step Guide
From developing an index objective to choosing relevant stocks, this graphic breaks down how MSCI builds thematic indexes using examples.


How MSCI Builds Thematic Indexes: A Step-by-Step Guide
Have you ever wondered how MSCI builds its thematic indexes?
To capture long-term, structural trends that could drive business performance in the future, the company follows a systematic approach. This graphic from MSCI breaks down each step in the process used to create its thematic indexes.
Step 1: Develop an Index Objective
MSCI first builds a broad statement of what the theme aims to capture based on extensive research and insights from industry experts.
Steps 2 and 3: List Sub-Themes, Generate Keyword List
Together with experts, MSCI creates a list of sub-themes or “seedwords” to identify aligned business activities.
The team then assembles a collection of suitable documents describing the theme. Natural language processing efficiently analyzes word frequency and relevance to generate a more detailed set of keywords contextually similar to the seedwords.
Step 4: Find Relevant Companies
By analyzing financial reports, MSCI picks companies relevant to the theme using two methods:
- Direct approach: Revenue from a company’s business segment is considered 100% relevant if the segment name matches a theme keyword. Standard Industrial Classification (SIC) codes from these directly-matched segments make up the eligible SIC code list used in the indirect approach.
- Indirect approach: If a segment name doesn’t match theme keywords, MSCI will:
- Analyze the density of theme keywords mentioned in the company’s description. A minimum of two unique keywords is required.
- The keyword density determines a “discount factor” to reflect lower certainty in theme alignment.
- Revenue from business segments with an eligible SIC code, regardless of how they are named, is scaled down by the discount factor.
The total percentage of revenue applicable to the theme from both approaches determines a company’s relevance score.
Step 5: Select the Stocks
Finally, MSCI narrows down the stocks that will be included:
- Global parent universe: The ACWI Investable Market Index (IMI) is the starting point for standard thematic indexes.
- Relevance filter: The universe is filtered for companies with a relevance score of at least 25%.
- False positive control: Eligible companies that are mapped to un-related GICS sub-industries are removed.
Companies with higher relevance scores and market caps have a higher weighting in the index, with the maximum weighting for any one issuer capped at 5%. The final selected stocks span various sectors.
MSCI Thematic Indexes: Regularly Updated and Rules-Based
Once an index is built, it is reviewed semi-annually and updated based on:
- Changes to the parent index
- Changes at individual companies
- Theme developments based on expert input
Theme keywords are reviewed yearly in May. Overall, MSCI’s thematic index construction process is objective, scalable, and flexible. The process can be customized based on the theme(s) you want to capture.
Learn more about MSCI’s thematic indexes.

-

 Investor Education6 months ago
The 20 Most Common Investing Mistakes, in One Chart
Here are the most common investing mistakes to avoid, from emotionally-driven investing to paying too much in fees.
-

 Stocks10 months ago
Visualizing BlackRock’s Top Equity Holdings
BlackRock is the world’s largest asset manager, with over $9 trillion in holdings. Here are the company’s top equity holdings.
-

 Investor Education10 months ago
10-Year Annualized Forecasts for Major Asset Classes
This infographic visualizes 10-year annualized forecasts for both equities and fixed income using data from Vanguard.
-

 Investor Education1 year ago
Visualizing 90 Years of Stock and Bond Portfolio Performance
How have investment returns for different portfolio allocations of stocks and bonds compared over the last 90 years?
-

 Debt2 years ago
Countries with the Highest Default Risk in 2022
In this infographic, we examine new data that ranks the top 25 countries by their default risk.
-

 Markets2 years ago
The Best Months for Stock Market Gains
This infographic analyzes over 30 years of stock market performance to identify the best and worst months for gains.

-

 Markets1 week ago
U.S. Debt Interest Payments Reach $1 Trillion
-

 Business2 weeks ago
Charted: Big Four Market Share by S&P 500 Audits
-

 Markets2 weeks ago
Ranked: The Most Valuable Housing Markets in America
-

 Money2 weeks ago
Which States Have the Highest Minimum Wage in America?
-

 AI2 weeks ago
Ranked: Semiconductor Companies by Industry Revenue Share
-

 Markets2 weeks ago
Ranked: The World’s Top Flight Routes, by Revenue
-

 Countries2 weeks ago
Population Projections: The World’s 6 Largest Countries in 2075
-

 Markets2 weeks ago
The Top 10 States by Real GDP Growth in 2023