Markets
How Wall Street Fools You Into Overpaying for Underperformance
.container {
max-width: 1070px;
}
.button {
display: inline-block;
height: 45px;
color: #ffffff;
text-align: center;
font-family: helvetica;
letter-spacing: .01rem;
text-decoration: none;
white-space: nowrap;
border-radius: 0px;
line-height: 45px;
border: 1px;
font-size: em(13);
cursor: pointer;
box-sizing: border-box;
background: #1A3838;
transition-duration: 0.4s;
margin-bottom: 1px;
width: 16.6666%;
}
.button-group {
position: left;
width: 100%;
display: inline-block;
list-style: none;
padding: 0;
margin: 0;
/* IE hacks */
zoom: 1;
*display: inline;
}
.button-group li {
float: left;
padding: 0;
margin: 0;
}
.button-group .button {
display: inline-block;
box-sizing: border-box;
color: white;
}
.button-group > .button:not(:first-child):not(:last-child), .button-group li:not(:first-child):not(:last-child) .button {
border-radius: 0;
}
.button-group > .button:first-child, .button-group li:first-child .button {
margin-left: 0;
border-top-right-radius: 0;
border-bottom-right-radius: 0;
}
.button-group > .button:last-child, .button-group li:last-child > .button {
border-top-left-radius: 0;
border-bottom-left-radius: 0;
border-bottom-right-radius: 0;
}
.button:hover {
background-color: #8E8059;
}
.button.active {
background-color: #8E8059;
}
.button-group :not(:last-child) {
border-right: 1px solid white;
padding-right: 2px;
}
.button-group {
border-right: none;
margin-right: none;
}
@media (max-width: 600px) {
.button {
font-size: 13px;}
}

How Wall Street Fools You to Overpay for Underperformance
Why do most people invest their hard-earned money?
Ultimately what most people really want is freedom – the freedom to do more of what they want, whenever they want, and with whomever they want.
Sadly, many people never achieve this long-desired freedom for themselves or their families. That’s because there is a silent investment killer that picks away at many investors’ portfolios, and it’s all part of Wall Street’s plan to line their pockets.
Becoming Unshakeable
Today’s infographic is from Tony Robbins, and it uses data and talking points from his #1 Best Selling book Unshakeable: Your Financial Freedom Playbook, which is now available on paperback.
Specifically, the infographic dives deep into the rabbit hole of fees associated with the investing products sold to most people saving for retirement, while also showing that these same Wall Street products often can’t beat the performance of the market.
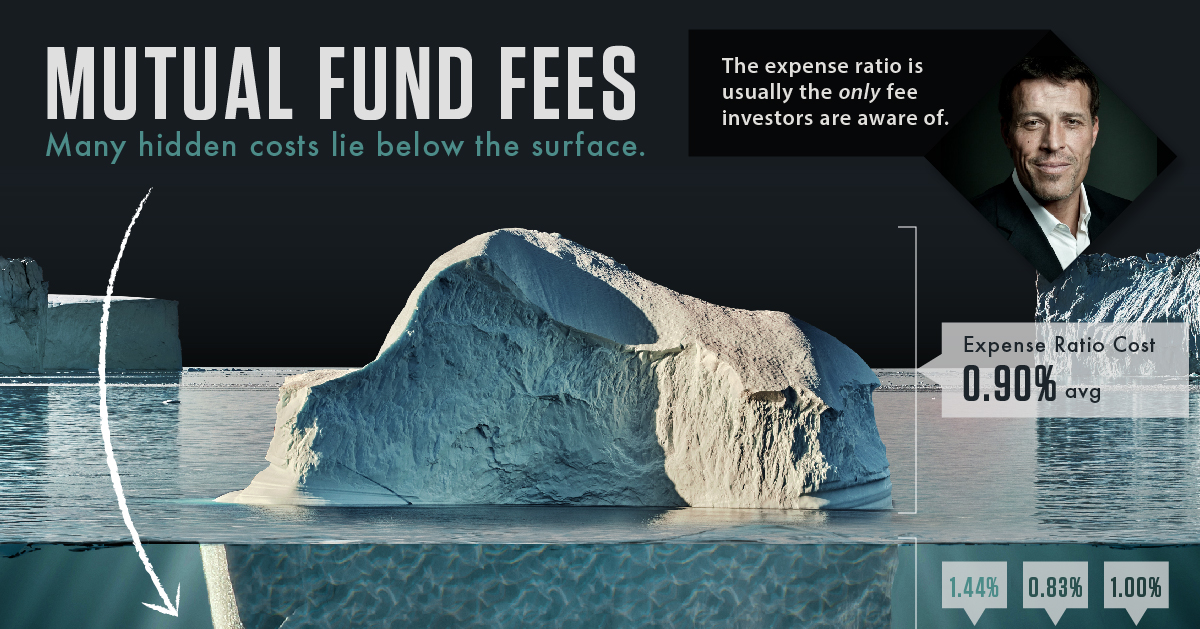
The Silent Portfolio Killer
Take a look at your investing statement, and it’s likely that your portfolio is in fact growing. Unfortunately, most people leave it at that, and they don’t question any further.
But the stats are revealing:
- 71% of Americans believe they pay no fees at all to have a 401(k) plan
- 92% of Americans admit they have no idea how much they are paying
In other words, they are blindly trusting the financial industry to look out for their best interests.
Meanwhile, the grim reality is that mutual funds, which are used in many 401(k) plans, have visible and hidden costs that can impact portfolio performance.
| Fee | Description | Cost (Avg.) |
|---|---|---|
| Expense ratio | This covers marketing and distribution costs, as well as management fees. | 0.90% |
| Transaction costs | Includes brokerage commissions, market impact cost, and spread cost. | 1.44% |
| Cash drag | Paying 100% of fund's expense ratio, even though fund isn't fully invested. | 0.83% |
| Taxes | Mutual fund gains are taxed - this doesn't apply to tax-free plans like 401(k)s | 1.00% |
| Advisory fees | For fee-based financial advisors, these fees often range from 0.25% - 2.50%. | n/a |
| Soft dollar cost | A hard cost to estimate, this a quid pro quo between funds and brokerage companies. | n/a |
Source: Forbes
According to Forbes, the average total of all of these costs is 4.17% – though of course, costs usually vary widely from fund to fund.
When you calculate the impact of excessive costs multiplied over many years, it takes your breath away.
– Tony Robbins
Not All Fees are Bad
It is important to note that not all fees are bad. Working with the right financial advisor can help you make better decisions, and this expertise can be used to save you money in the long run.
A recent Vanguard study helps quantify the value a good advisor can bring:
- Rebalancing portfolio – 0.35%
- Lowering expense ratios – 0.45%
- Asset allocation – 0.75%
- Withdrawing the right investments for retirement – 0.70%
- Behavioral coaching – 1.50%
In aggregate, the right financial advisor can create 3.75% in value – that’s 3X more than a sophisticated advisor might charge, and doesn’t even include the added benefits of reducing taxes, estate planning, and other areas.
A Difference Maker
One percent here, two percent there – it’s barely anything in the long run, right?
It turns out, however, that the power of compound interest is so great, that even 2% can be the difference between financial freedom and financial ruin.
Put $1 in the stock market for 50 years at a 7% rate of return, and you’ll end up with nearly $30. Get charged a 2% fee to bring your returns to 5%, and your fortune is one-third the size!
You put up 100% of the capital, you took 100% of the risk, and you got 33% of the return!
– Jack Bogle
Chasing Market Beating Returns
Investors often buy top performing mutual funds or try to time the market, because ultimately they are hoping to beat the market to achieve financial freedom.
However, it’s not clear that either of these strategies work.
Buying “Top-Performing” Funds
Industry expert Robert Arnott studied all 203 actively managed mutual funds with at least $100 million in assets, tracking their returns for the 15 years from 1984 through 1998.
And you know what he found?
Only 8 of these 203 funds actually beat the S&P 500 index. That’s less than 4%!
Trying to Time the Market
Researchers Richard Bauer and Julie Dahlquist examined more than a million market-timing sequences from 1926 to 1999. Their conclusion: just holding the market outperformed more than 80% of market-timing strategies
The Moral of the Story
Wall Street tries to fool you into overpaying for underperformance.
Overpaying: Fees and taxes can be silent portfolio killers. Even 1% or 2% makes a big difference over time.
Underperformance: Only a small percentage of funds beat the market over time, and much of this can be attributed to randomness.
Only being in the market, while minimizing costs, can empower you to getting the real financial freedom you deserve.


Markets
U.S. Debt Interest Payments Reach $1 Trillion
U.S. debt interest payments have surged past the $1 trillion dollar mark, amid high interest rates and an ever-expanding debt burden.


U.S. Debt Interest Payments Reach $1 Trillion
This was originally posted on our Voronoi app. Download the app for free on iOS or Android and discover incredible data-driven charts from a variety of trusted sources.
The cost of paying for America’s national debt crossed the $1 trillion dollar mark in 2023, driven by high interest rates and a record $34 trillion mountain of debt.
Over the last decade, U.S. debt interest payments have more than doubled amid vast government spending during the pandemic crisis. As debt payments continue to soar, the Congressional Budget Office (CBO) reported that debt servicing costs surpassed defense spending for the first time ever this year.
This graphic shows the sharp rise in U.S. debt payments, based on data from the Federal Reserve.
A $1 Trillion Interest Bill, and Growing
Below, we show how U.S. debt interest payments have risen at a faster pace than at another time in modern history:
| Date | Interest Payments | U.S. National Debt |
|---|---|---|
| 2023 | $1.0T | $34.0T |
| 2022 | $830B | $31.4T |
| 2021 | $612B | $29.6T |
| 2020 | $518B | $27.7T |
| 2019 | $564B | $23.2T |
| 2018 | $571B | $22.0T |
| 2017 | $493B | $20.5T |
| 2016 | $460B | $20.0T |
| 2015 | $435B | $18.9T |
| 2014 | $442B | $18.1T |
| 2013 | $425B | $17.2T |
| 2012 | $417B | $16.4T |
| 2011 | $433B | $15.2T |
| 2010 | $400B | $14.0T |
| 2009 | $354B | $12.3T |
| 2008 | $380B | $10.7T |
| 2007 | $414B | $9.2T |
| 2006 | $387B | $8.7T |
| 2005 | $355B | $8.2T |
| 2004 | $318B | $7.6T |
| 2003 | $294B | $7.0T |
| 2002 | $298B | $6.4T |
| 2001 | $318B | $5.9T |
| 2000 | $353B | $5.7T |
| 1999 | $353B | $5.8T |
| 1998 | $360B | $5.6T |
| 1997 | $368B | $5.5T |
| 1996 | $362B | $5.3T |
| 1995 | $357B | $5.0T |
| 1994 | $334B | $4.8T |
| 1993 | $311B | $4.5T |
| 1992 | $306B | $4.2T |
| 1991 | $308B | $3.8T |
| 1990 | $298B | $3.4T |
| 1989 | $275B | $3.0T |
| 1988 | $254B | $2.7T |
| 1987 | $240B | $2.4T |
| 1986 | $225B | $2.2T |
| 1985 | $219B | $1.9T |
| 1984 | $205B | $1.7T |
| 1983 | $176B | $1.4T |
| 1982 | $157B | $1.2T |
| 1981 | $142B | $1.0T |
| 1980 | $113B | $930.2B |
| 1979 | $96B | $845.1B |
| 1978 | $84B | $789.2B |
| 1977 | $69B | $718.9B |
| 1976 | $61B | $653.5B |
| 1975 | $55B | $576.6B |
| 1974 | $50B | $492.7B |
| 1973 | $45B | $469.1B |
| 1972 | $39B | $448.5B |
| 1971 | $36B | $424.1B |
| 1970 | $35B | $389.2B |
| 1969 | $30B | $368.2B |
| 1968 | $25B | $358.0B |
| 1967 | $23B | $344.7B |
| 1966 | $21B | $329.3B |
Interest payments represent seasonally adjusted annual rate at the end of Q4.
At current rates, the U.S. national debt is growing by a remarkable $1 trillion about every 100 days, equal to roughly $3.6 trillion per year.
As the national debt has ballooned, debt payments even exceeded Medicaid outlays in 2023—one of the government’s largest expenditures. On average, the U.S. spent more than $2 billion per day on interest costs last year. Going further, the U.S. government is projected to spend a historic $12.4 trillion on interest payments over the next decade, averaging about $37,100 per American.
Exacerbating matters is that the U.S. is running a steep deficit, which stood at $1.1 trillion for the first six months of fiscal 2024. This has accelerated due to the 43% increase in debt servicing costs along with a $31 billion dollar increase in defense spending from a year earlier. Additionally, a $30 billion increase in funding for the Federal Deposit Insurance Corporation in light of the regional banking crisis last year was a major contributor to the deficit increase.
Overall, the CBO forecasts that roughly 75% of the federal deficit’s increase will be due to interest costs by 2034.

-

 Mining2 weeks ago
Charted: The Value Gap Between the Gold Price and Gold Miners
-

 Real Estate1 week ago
Ranked: The Most Valuable Housing Markets in America
-

 Business1 week ago
Charted: Big Four Market Share by S&P 500 Audits
-

 AI1 week ago
The Stock Performance of U.S. Chipmakers So Far in 2024
-

 Misc1 week ago
Almost Every EV Stock is Down After Q1 2024
-

 Money2 weeks ago
Where Does One U.S. Tax Dollar Go?
-

 Green2 weeks ago
Ranked: Top Countries by Total Forest Loss Since 2001
-

 Real Estate2 weeks ago
Visualizing America’s Shortage of Affordable Homes