Markets
California Cannabis: A Golden Opportunity With Unique Challenges
If the state of California were a country, it would have the fifth largest GDP in the world.
Take this kind of spending power and combine it with the recent legalization of recreational cannabis, and it’s fair to say that the Golden State is primed to become the Holy Grail of cannabis opportunities.
But while the market is home to immense potential, this doesn’t mean that the California cannabis business isn’t without its own unique challenges and obstacles to navigate.
Navigating California Cannabis
Today’s infographic comes to us from High Hampton Holdings and it helps set the stage for the boom in California, as well as listing the regulatory hurdles that companies must be prepared to deal with in the jurisdiction.

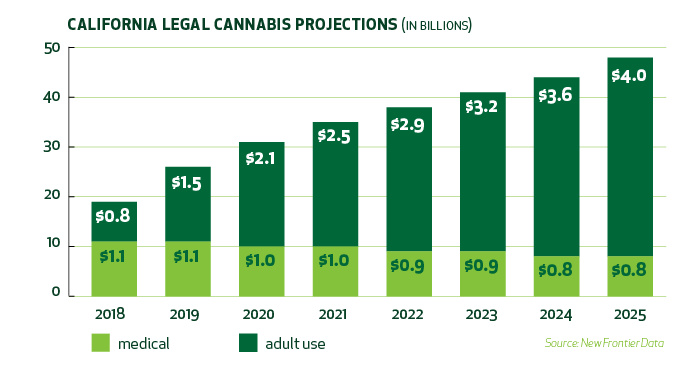
In the next year, it’s expected that recreational cannabis sales in California will surpass the existing total from the already established medical market.
By 2025, those recreational sales could be $4 billion per year – that’s five times the size of the medical market!
Sticker Shock
The potential of the California cannabis market may be obvious, but navigating both the state’s notorious regulatory system and tax regime is a clear threat for companies aiming to succeed in the space.
Since legalization, the price of cannabis in California has become an immediate hiccup that has initially angered consumers, reducing expected demand and state revenues.
According to BDS Analytics, the effective sales tax on a gram of cannabis bought in San Jose works out to a hefty 38%. Add this to the higher cost of doing business in the state, and the sticker shock for consumers is real.
Complex Legislation
After high taxes, companies entering the California market must also navigate the state’s complex rules and regulations about growing, distributing, and selling cannabis.
To give an idea of what this looks like for the average company, here is a brief snapshot of California’s regulatory environment:
- There are three governing bodies for cannabis in the state: California Department of Food and Agriculture (CDFA), California Department of Public Health (CDPH), and the Bureau of Cannabis Control (BCC)
- There is a dual licensing requirement in the state, in which companies must be licensed both by the state as well as by local authorities
- Companies must get their local license before their state license – and this is complicated: there are 58 counties and 482 incorporated cities, each with their own specific set of rules and requirements
- Currently, many growers do not meet state or local standards
- The supply of zoned, permitted areas for cannabis cultivation are scarce and in high demand
Even further, the rules around cultivating, distributing, and retailing all involve specific and highly-specialized licenses. For example, only those with a full-service distribution license can coordinate required third-party testing, ensure packaging reviews of products, and collect and remit cultivation excise taxes.
Golden Potential
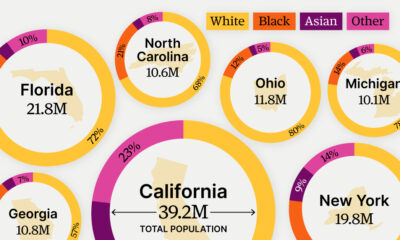
Despite the challenges that exist in the California cannabis market, it is still the undisputed jewel in the crown of the global legal cannabis space, offering access to 39 million consumers and large amounts of disposable income at play.
Only companies that can navigate this uncharted territory will be able to take advantage of this lucrative opportunity.


Markets
U.S. Debt Interest Payments Reach $1 Trillion
U.S. debt interest payments have surged past the $1 trillion dollar mark, amid high interest rates and an ever-expanding debt burden.


U.S. Debt Interest Payments Reach $1 Trillion
This was originally posted on our Voronoi app. Download the app for free on iOS or Android and discover incredible data-driven charts from a variety of trusted sources.
The cost of paying for America’s national debt crossed the $1 trillion dollar mark in 2023, driven by high interest rates and a record $34 trillion mountain of debt.
Over the last decade, U.S. debt interest payments have more than doubled amid vast government spending during the pandemic crisis. As debt payments continue to soar, the Congressional Budget Office (CBO) reported that debt servicing costs surpassed defense spending for the first time ever this year.
This graphic shows the sharp rise in U.S. debt payments, based on data from the Federal Reserve.
A $1 Trillion Interest Bill, and Growing
Below, we show how U.S. debt interest payments have risen at a faster pace than at another time in modern history:
| Date | Interest Payments | U.S. National Debt |
|---|---|---|
| 2023 | $1.0T | $34.0T |
| 2022 | $830B | $31.4T |
| 2021 | $612B | $29.6T |
| 2020 | $518B | $27.7T |
| 2019 | $564B | $23.2T |
| 2018 | $571B | $22.0T |
| 2017 | $493B | $20.5T |
| 2016 | $460B | $20.0T |
| 2015 | $435B | $18.9T |
| 2014 | $442B | $18.1T |
| 2013 | $425B | $17.2T |
| 2012 | $417B | $16.4T |
| 2011 | $433B | $15.2T |
| 2010 | $400B | $14.0T |
| 2009 | $354B | $12.3T |
| 2008 | $380B | $10.7T |
| 2007 | $414B | $9.2T |
| 2006 | $387B | $8.7T |
| 2005 | $355B | $8.2T |
| 2004 | $318B | $7.6T |
| 2003 | $294B | $7.0T |
| 2002 | $298B | $6.4T |
| 2001 | $318B | $5.9T |
| 2000 | $353B | $5.7T |
| 1999 | $353B | $5.8T |
| 1998 | $360B | $5.6T |
| 1997 | $368B | $5.5T |
| 1996 | $362B | $5.3T |
| 1995 | $357B | $5.0T |
| 1994 | $334B | $4.8T |
| 1993 | $311B | $4.5T |
| 1992 | $306B | $4.2T |
| 1991 | $308B | $3.8T |
| 1990 | $298B | $3.4T |
| 1989 | $275B | $3.0T |
| 1988 | $254B | $2.7T |
| 1987 | $240B | $2.4T |
| 1986 | $225B | $2.2T |
| 1985 | $219B | $1.9T |
| 1984 | $205B | $1.7T |
| 1983 | $176B | $1.4T |
| 1982 | $157B | $1.2T |
| 1981 | $142B | $1.0T |
| 1980 | $113B | $930.2B |
| 1979 | $96B | $845.1B |
| 1978 | $84B | $789.2B |
| 1977 | $69B | $718.9B |
| 1976 | $61B | $653.5B |
| 1975 | $55B | $576.6B |
| 1974 | $50B | $492.7B |
| 1973 | $45B | $469.1B |
| 1972 | $39B | $448.5B |
| 1971 | $36B | $424.1B |
| 1970 | $35B | $389.2B |
| 1969 | $30B | $368.2B |
| 1968 | $25B | $358.0B |
| 1967 | $23B | $344.7B |
| 1966 | $21B | $329.3B |
Interest payments represent seasonally adjusted annual rate at the end of Q4.
At current rates, the U.S. national debt is growing by a remarkable $1 trillion about every 100 days, equal to roughly $3.6 trillion per year.
As the national debt has ballooned, debt payments even exceeded Medicaid outlays in 2023—one of the government’s largest expenditures. On average, the U.S. spent more than $2 billion per day on interest costs last year. Going further, the U.S. government is projected to spend a historic $12.4 trillion on interest payments over the next decade, averaging about $37,100 per American.
Exacerbating matters is that the U.S. is running a steep deficit, which stood at $1.1 trillion for the first six months of fiscal 2024. This has accelerated due to the 43% increase in debt servicing costs along with a $31 billion dollar increase in defense spending from a year earlier. Additionally, a $30 billion increase in funding for the Federal Deposit Insurance Corporation in light of the regional banking crisis last year was a major contributor to the deficit increase.
Overall, the CBO forecasts that roughly 75% of the federal deficit’s increase will be due to interest costs by 2034.

-

 Real Estate2 weeks ago
Visualizing America’s Shortage of Affordable Homes
-

 Technology1 week ago
Ranked: Semiconductor Companies by Industry Revenue Share
-

 Money1 week ago
Which States Have the Highest Minimum Wage in America?
-

 Real Estate1 week ago
Ranked: The Most Valuable Housing Markets in America
-

 Business2 weeks ago
Charted: Big Four Market Share by S&P 500 Audits
-

 AI2 weeks ago
The Stock Performance of U.S. Chipmakers So Far in 2024
-

 Misc2 weeks ago
Almost Every EV Stock is Down After Q1 2024
-

 Money2 weeks ago
Where Does One U.S. Tax Dollar Go?