Technology
Chart: Amazon’s Dominance in Ecommerce
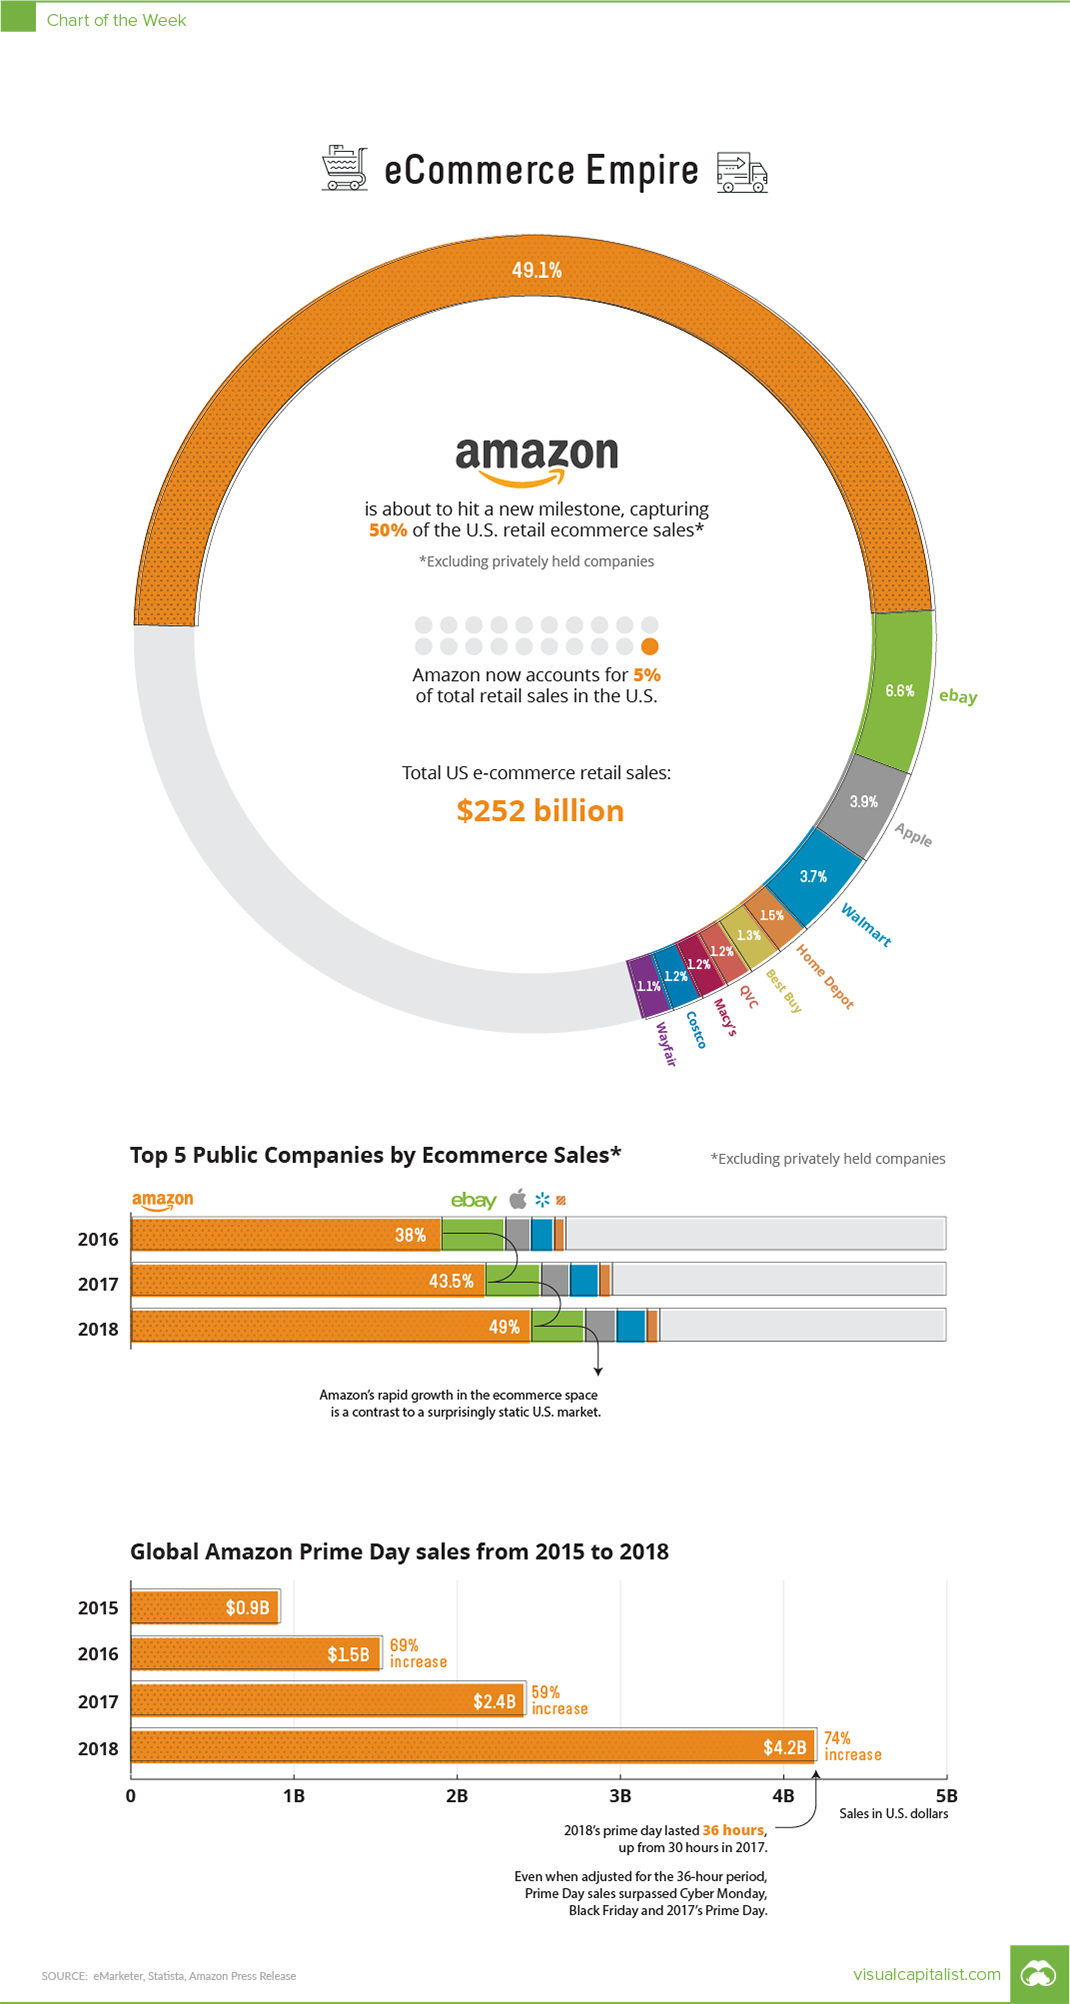
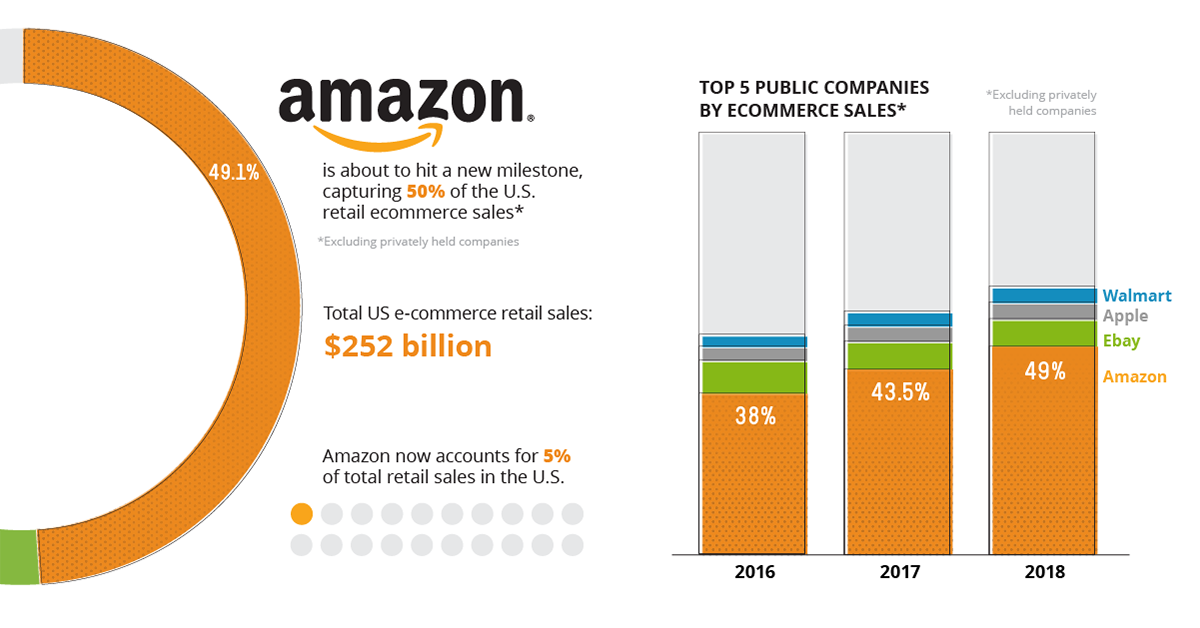
This Chart Shows Amazon’s Dominance in Ecommerce
It’s no secret that Amazon is dominant in ecommerce.
But despite this being common knowledge, the most recent data behind the explosion in Amazon’s market position is still stunning to behold: in the last two years, the already monstrous Amazon somehow was able to increase their share of the total U.S. ecommerce market from 38% to 49%.
Amazon holds almost half of the massive $252.7 billion market – that’s more than double the market share of the next nine companies (including eBay, Walmart, Best Buy, Apple, etc.) combined!
Leaders and Laggards
Capturing a 50% share of a coveted U.S. ecommerce market is impressive, especially considering Amazon is up against many formidable retailers:
| Rank | Company | Market Share (2018) |
|---|---|---|
| #1 | Amazon | 49.1% |
| #2 | eBay | 6.6% |
| #3 | Apple | 3.9% |
| #4 | Walmart | 3.7% |
| #5 | The Home Depot | 1.5% |
| #6 | Best Buy | 1.3% |
| #7 | Qurate Retail Group | 1.2% |
| #8 | Macy's | 1.2% |
| #9 | Costco | 1.2% |
| #10 | Wayfair | 1.1% |
Retailers like Walmart and Best Buy are collectively throwing billions of dollars to get a foothold online. The competition is certainly fierce, but Amazon has still been able to achieve astronomical growth:
| 2016 | 2017 | 2018 | |
|---|---|---|---|
| Amazon market share | 38.1% | 43.5% | 49.1% |
Will Amazon cap out at 50%, 60%, 70%, or beyond?
At this point no one can tell – but regardless of where the growth ends, such a level of dominance has never been achieved in the retail market like this before.
A Prime Driver
Although not as stunning as overall ecommerce market share, the company’s Prime Day numbers also illustrate the vast size and scale of the company.
The most recent rendition of the annual event in July 2018 raked in $4.2 billion of revenue in a 36-hour period, even though the company had well-publicized technical issues that cost the company $72 million.
| 2015 | 2016 | 2017 | 2018 | |
|---|---|---|---|---|
| Prime Day Sales | $0.9B | $1.5B | $2.4B | $4.2B |
The 2018 event brought a revenue increase of 74% – and Prime Day now generates more sales than Cyber Monday or Black Friday ecommerce sales.
There’s no doubt that the Jeff Bezos Empire is holding strong: with $900 billion in market capitalization, Amazon is now in the conversation to join Apple in hitting the $1 trillion milestone in the coming months.


Technology
Ranked: Semiconductor Companies by Industry Revenue Share
Nvidia is coming for Intel’s crown. Samsung is losing ground. AI is transforming the space. We break down revenue for semiconductor companies.


Semiconductor Companies by Industry Revenue Share
This was originally posted on our Voronoi app. Download the app for free on Apple or Android and discover incredible data-driven charts from a variety of trusted sources.
Did you know that some computer chips are now retailing for the price of a new BMW?
As computers invade nearly every sphere of life, so too have the chips that power them, raising the revenues of the businesses dedicated to designing them.
But how did various chipmakers measure against each other last year?
We rank the biggest semiconductor companies by their percentage share of the industry’s revenues in 2023, using data from Omdia research.
Which Chip Company Made the Most Money in 2023?
Market leader and industry-defining veteran Intel still holds the crown for the most revenue in the sector, crossing $50 billion in 2023, or 10% of the broader industry’s topline.
All is not well at Intel, however, with the company’s stock price down over 20% year-to-date after it revealed billion-dollar losses in its foundry business.
| Rank | Company | 2023 Revenue | % of Industry Revenue |
|---|---|---|---|
| 1 | Intel | $51B | 9.4% |
| 2 | NVIDIA | $49B | 9.0% |
| 3 | Samsung Electronics | $44B | 8.1% |
| 4 | Qualcomm | $31B | 5.7% |
| 5 | Broadcom | $28B | 5.2% |
| 6 | SK Hynix | $24B | 4.4% |
| 7 | AMD | $22B | 4.1% |
| 8 | Apple | $19B | 3.4% |
| 9 | Infineon Tech | $17B | 3.2% |
| 10 | STMicroelectronics | $17B | 3.2% |
| 11 | Texas Instruments | $17B | 3.1% |
| 12 | Micron Technology | $16B | 2.9% |
| 13 | MediaTek | $14B | 2.6% |
| 14 | NXP | $13B | 2.4% |
| 15 | Analog Devices | $12B | 2.2% |
| 16 | Renesas Electronics Corporation | $11B | 1.9% |
| 17 | Sony Semiconductor Solutions Corporation | $10B | 1.9% |
| 18 | Microchip Technology | $8B | 1.5% |
| 19 | Onsemi | $8B | 1.4% |
| 20 | KIOXIA Corporation | $7B | 1.3% |
| N/A | Others | $126B | 23.2% |
| N/A | Total | $545B | 100% |
Note: Figures are rounded. Totals and percentages may not sum to 100.
Meanwhile, Nvidia is very close to overtaking Intel, after declaring $49 billion of topline revenue for 2023. This is more than double its 2022 revenue ($21 billion), increasing its share of industry revenues to 9%.
Nvidia’s meteoric rise has gotten a huge thumbs-up from investors. It became a trillion dollar stock last year, and broke the single-day gain record for market capitalization this year.
Other chipmakers haven’t been as successful. Out of the top 20 semiconductor companies by revenue, 12 did not match their 2022 revenues, including big names like Intel, Samsung, and AMD.
The Many Different Types of Chipmakers
All of these companies may belong to the same industry, but they don’t focus on the same niche.
According to Investopedia, there are four major types of chips, depending on their functionality: microprocessors, memory chips, standard chips, and complex systems on a chip.
Nvidia’s core business was once GPUs for computers (graphics processing units), but in recent years this has drastically shifted towards microprocessors for analytics and AI.
These specialized chips seem to be where the majority of growth is occurring within the sector. For example, companies that are largely in the memory segment—Samsung, SK Hynix, and Micron Technology—saw peak revenues in the mid-2010s.

-

 Real Estate2 weeks ago
Visualizing America’s Shortage of Affordable Homes
-

 Technology1 week ago
Ranked: Semiconductor Companies by Industry Revenue Share
-

 Money1 week ago
Which States Have the Highest Minimum Wage in America?
-

 Real Estate1 week ago
Ranked: The Most Valuable Housing Markets in America
-

 Business2 weeks ago
Charted: Big Four Market Share by S&P 500 Audits
-

 AI2 weeks ago
The Stock Performance of U.S. Chipmakers So Far in 2024
-

 Misc2 weeks ago
Almost Every EV Stock is Down After Q1 2024
-

 Money2 weeks ago
Where Does One U.S. Tax Dollar Go?