Technology
The Apps Winning the Battle For Our Attention
The Apps Winning the Battle For Our Attention Span
With the smartphone as the centerpiece of the new global consumer economy, how we allocate our screentime between the myriad of apps that exist is becoming a very telling statistic.
After all, the companies that win the battle for app mindshare will have unfettered access to billions of consumers, as well as the economic opportunities that emerge from that access.
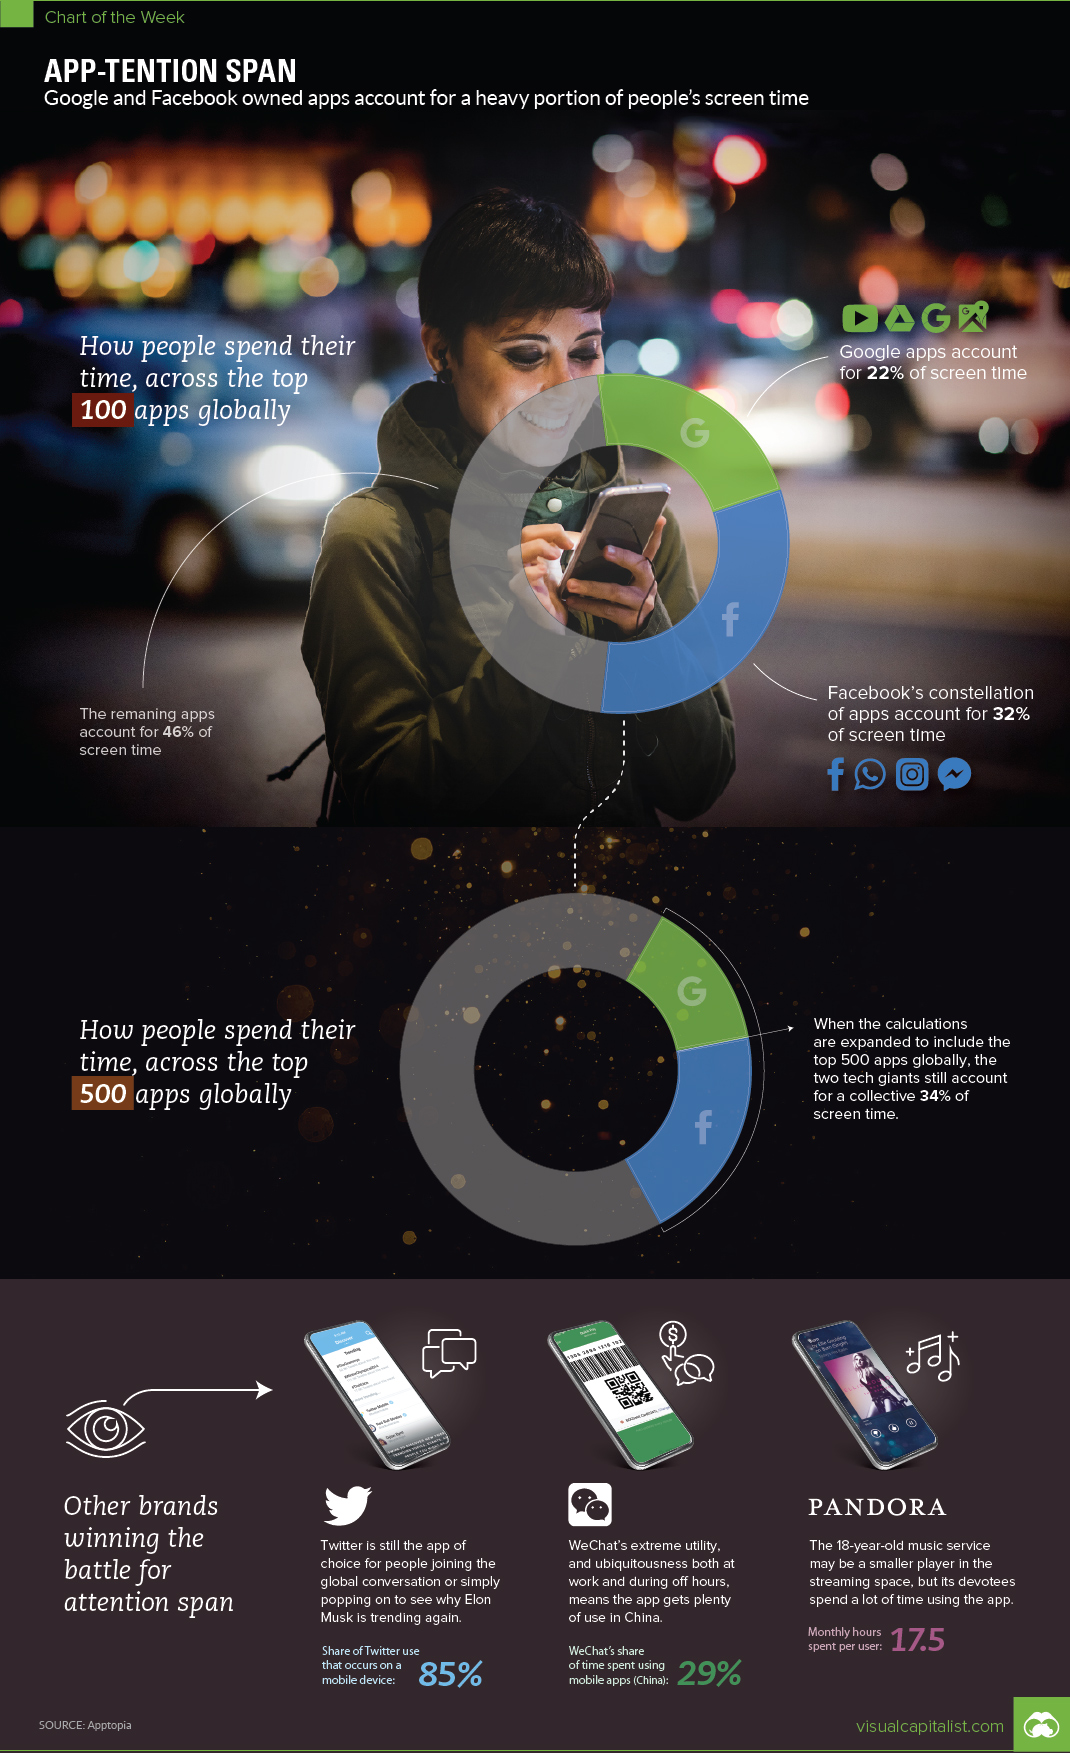
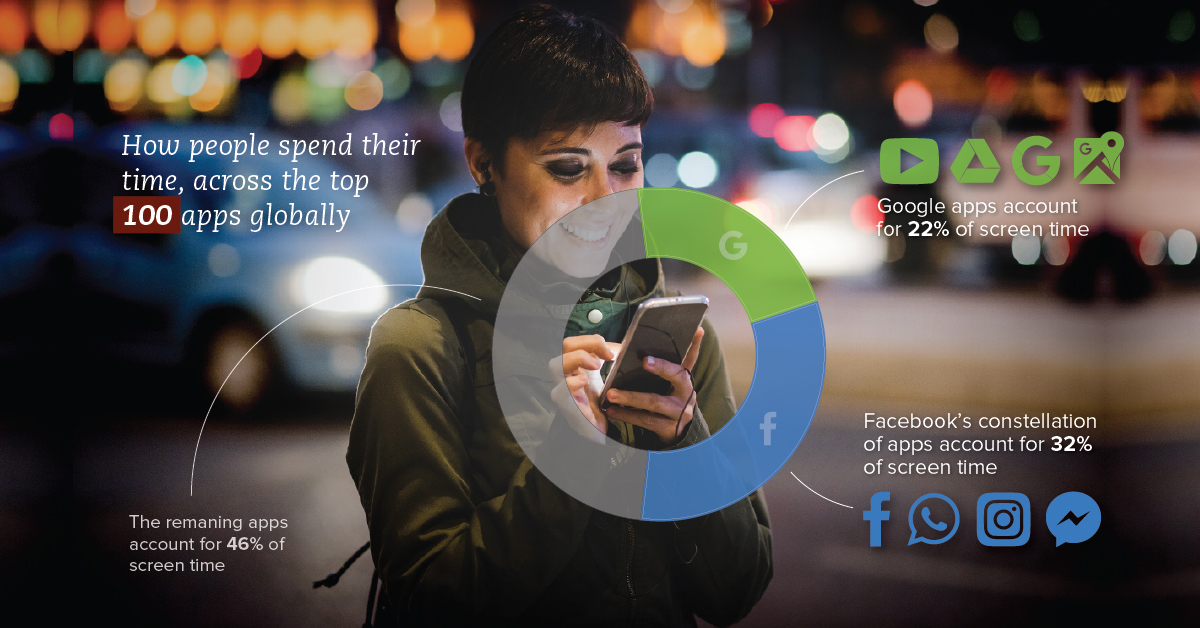
The Duopoly vs. Everyone Else
Most know that Facebook and Google, the two tech giants that are lovingly referred to as “The Duopoly” by advertising executives, are already capturing $0.60 of every dollar spent on advertising online.
And now, through acquisitions, The Duopoly is showing that they are able to stay ubiquitous as consumers spend even more time on their smartphones.
According to recent data from Apptopia, the global app ecosystem is dominated by Facebook and Google owned apps. Together, among the top 100 apps, their products account for 54% of all screen time.
What’s up with WhatsApp?
In particular, Facebook’s showing is impressive here: users spend an average of 79 minutes per day in its apps.
What’s even more interesting is that this is mainly due to the success of WhatsApp, a company that Facebook successfully acquired for $19 billion in 2014. WhatsApp has a user base well beyond 1 billion people, and in the last three months it saw 82.21 billion hours of time spent on the messaging app – more than any other.
Here are the 10 top apps, in terms of screen time, as estimated by Apptopia:
- Messenger
- Pandora
- YouTube
- Google Maps
- Spotify
Note: May-July 2018. Data is global and includes iOS and Android. Excludes third-party app stores.
To understand the dominance of WhatsApp, keep in mind the top-viewed game over this May-July 2018 period was Clash of Clans, in which users spent 3.83 billion hours. Compared to WhatsApp’s 82 billion hours, that’s just a drop in the bucket!
Facebook owns three of the top four apps, even though the company isn’t the base of any ecosystem like Google or Apple. The question it does face however, is how it will monetize WhatsApp and Messenger, each apps with over 1 billion users.
Most Downloaded Apps
In 2017, WhatsApp was downloaded a whopping 924 million times.
Here’s how that compares to other top apps in different categories based on 2017 data:
| Category | App | # of Downloads (2017) |
|---|---|---|
| Social | 924 million | |
| Music and Audio | Spotify | 299 million |
| Games | Subway Surfers | 190 million |
| Travel | Uber | 189 million |
| Entertainment | Netflix | 118 million |
| Shopping | AliExpress | 81 million |
| Dating | Tinder | 58 million |
| Food and Drink | Subway | 35 million |
As you can see, WhatsApp (and other social apps) blow away the competition from all other categories.
It’s something that Facebook is likely quite happy about, though for now it’s still hard to put a number on the value of WhatsApp to the mother company.


Technology
All of the Grants Given by the U.S. CHIPS Act
Intel, TSMC, and more have received billions in subsidies from the U.S. CHIPS Act in 2024.


All of the Grants Given by the U.S. CHIPS Act
This was originally posted on our Voronoi app. Download the app for free on iOS or Android and discover incredible data-driven charts from a variety of trusted sources.
This visualization shows which companies are receiving grants from the U.S. CHIPS Act, as of April 25, 2024. The CHIPS Act is a federal statute signed into law by President Joe Biden that authorizes $280 billion in new funding to boost domestic research and manufacturing of semiconductors.
The grant amounts visualized in this graphic are intended to accelerate the production of semiconductor fabrication plants (fabs) across the United States.
Data and Company Highlights
The figures we used to create this graphic were collected from a variety of public news sources. The Semiconductor Industry Association (SIA) also maintains a tracker for CHIPS Act recipients, though at the time of writing it does not have the latest details for Micron.
| Company | Federal Grant Amount | Anticipated Investment From Company |
|---|---|---|
| 🇺🇸 Intel | $8,500,000,000 | $100,000,000,000 |
| 🇹🇼 TSMC | $6,600,000,000 | $65,000,000,000 |
| 🇰🇷 Samsung | $6,400,000,000 | $45,000,000,000 |
| 🇺🇸 Micron | $6,100,000,000 | $50,000,000,000 |
| 🇺🇸 GlobalFoundries | $1,500,000,000 | $12,000,000,000 |
| 🇺🇸 Microchip | $162,000,000 | N/A |
| 🇬🇧 BAE Systems | $35,000,000 | N/A |
BAE Systems was not included in the graphic due to size limitations
Intel’s Massive Plans
Intel is receiving the largest share of the pie, with $8.5 billion in grants (plus an additional $11 billion in government loans). This grant accounts for 22% of the CHIPS Act’s total subsidies for chip production.
From Intel’s side, the company is expected to invest $100 billion to construct new fabs in Arizona and Ohio, while modernizing and/or expanding existing fabs in Oregon and New Mexico. Intel could also claim another $25 billion in credits through the U.S. Treasury Department’s Investment Tax Credit.
TSMC Expands its U.S. Presence
TSMC, the world’s largest semiconductor foundry company, is receiving a hefty $6.6 billion to construct a new chip plant with three fabs in Arizona. The Taiwanese chipmaker is expected to invest $65 billion into the project.
The plant’s first fab will be up and running in the first half of 2025, leveraging 4 nm (nanometer) technology. According to TrendForce, the other fabs will produce chips on more advanced 3 nm and 2 nm processes.
The Latest Grant Goes to Micron
Micron, the only U.S.-based manufacturer of memory chips, is set to receive $6.1 billion in grants to support its plans of investing $50 billion through 2030. This investment will be used to construct new fabs in Idaho and New York.

-

 Science7 days ago
Visualizing the Average Lifespans of Mammals
-

 Markets2 weeks ago
The Top 10 States by Real GDP Growth in 2023
-

 Demographics2 weeks ago
The Smallest Gender Wage Gaps in OECD Countries
-

 United States2 weeks ago
Where U.S. Inflation Hit the Hardest in March 2024
-

 Green2 weeks ago
Top Countries By Forest Growth Since 2001
-

 United States2 weeks ago
Ranked: The Largest U.S. Corporations by Number of Employees
-

 Maps2 weeks ago
The Largest Earthquakes in the New York Area (1970-2024)
-

 Green2 weeks ago
Ranked: The Countries With the Most Air Pollution in 2023