Misc
Map: The World’s Top Countries for Tourism
Map: The World’s Top Countries for Tourism
Where do the world’s international tourist dollars get spent?
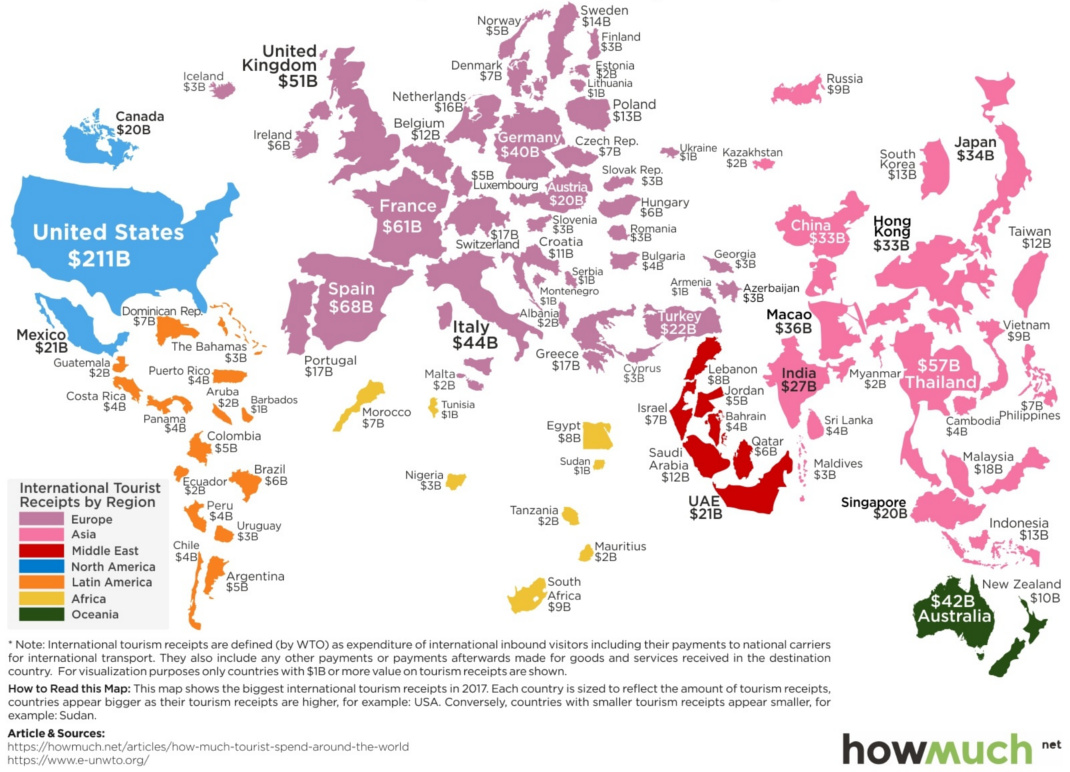
Today’s map from HowMuch.net resizes countries around the world based on international tourist receipts in 2017, using data from the World Tourism Organization.
Top International Destinations
Here are the world’s top countries for tourism, based on total money spent:
| Rank | Country | International Visitors | Dollars Spent |
|---|---|---|---|
| #1 | United States | 74.7 million | $210.7B |
| #2 | Spain | 81.8 million | $68.0B |
| #3 | France | 86.9 million | $60.7B |
| #4 | Thailand | 35.4 million | $57.5B |
| #5 | United Kingdom | 37.6 million | $51.2B |
| #6 | Italy | 58.3 million | $44.2B |
| #7 | Australia | 8.9 million | $41.7B |
| #8 | Germany | 37.5 million | $39.8B |
| #9 | Macao (China) | 17.3 million | $35.6B |
| #10 | Japan | 28.7 million | $34.1B |
| #11 | Hong Kong (China) | 27.9 million | $33.3B |
| #12 | China | 60.7 million | $32.6B |
| #13 | India | 15.5 million | $27.4B |
| #14 | Turkey | 37.6 million | $22.5B |
| #15 | Mexico | 39.3 million | $21.3B |
Data based on international tourism; doesn’t include intercountry tourism (i.e. family trip from Seattle to Hawaii)
Coming into the top spot is the United States with $210.7 billion spent by 74.7 million tourists, or roughly $2,819 per person in 2017. The country boasts attractions like the Grand Canyon, Disneyland, the Statue of Liberty, beaches in Hawaii or California, or Yellowstone National Park, with the highest rated U.S. attraction being Central Park in New York City.
Next up, Europe has a pretty impressive presence. Spain ($68B) and France ($61B) come in at #2 and #3 respectively, and also countries like the United Kingdom ($51B), Italy ($44B), and Germany ($40B) end up rounding out the top eight spots.
Macao surpasses Hong Kong and mainland China as a top destination for tourist dollars, while Australia makes the top 10 despite only having 9 million visitors in 2017.
Dollars Per Visitor
If we take international tourist receipts and divide it by the number of visitors for each country, we also see another interesting measure: dollars spent per visitor.
A country like Australia is not only massive – but it’s also quite remote for many visitors, meaning that tourists get their fill on their trips. Tourists to a destination like Australia are rarely popping in for an overnighter, and are more likely to spend extended periods of time on vacation.
| Rank | Country | International Visitors | Dollars Spent | $/Visitor |
|---|---|---|---|---|
| #1 | Australia | 8.8 million | $41.7B | $4,734 |
| #2 | Luxembourg | 1.0 million | $4.5B | $4,322 |
| #3 | Lebanon | 1.9 million | $7.6B | $4,099 |
| #4 | New Zealand | 3.6 million | $10.3B | $2,893 |
| #5 | United States | 74.7 million | $210.7B | $2,819 |
| #6 | Qatar | 2.3 million | $6.0 B | $2,647 |
| #7 | Panama | 1.8 million | $4.5B | $2,416 |
| #8 | Macao (China) | 17.3 million | $35.6B | $2,062 |
| #9 | Sweden | 6.9 million | $14.1B | $2,060 |
| #10 | Israel | 3.6 million | $6.8B | $1,888 |
Topping this list are places that are hard to reach for many visitors (New Zealand or Israel, for example), as well as more expensive destinations (Luxembourg).
Macao, the gambling capital of the world, also makes the list – with many of those dollars likely being spent on games like roulette, blackjack, sic bo, and fan-tan.


VC+
VC+: Get Our Key Takeaways From the IMF’s World Economic Outlook
A sneak preview of the exclusive VC+ Special Dispatch—your shortcut to understanding IMF’s World Economic Outlook report.

Have you read IMF’s latest World Economic Outlook yet? At a daunting 202 pages, we don’t blame you if it’s still on your to-do list.
But don’t worry, you don’t need to read the whole April release, because we’ve already done the hard work for you.
To save you time and effort, the Visual Capitalist team has compiled a visual analysis of everything you need to know from the report—and our upcoming VC+ Special Dispatch will be available exclusively to VC+ members on Thursday, April 25th.
If you’re not already subscribed to VC+, make sure you sign up now to receive the full analysis of the IMF report, and more (we release similar deep dives every week).
For now, here’s what VC+ members can expect to receive.
Your Shortcut to Understanding IMF’s World Economic Outlook
With long and short-term growth prospects declining for many countries around the world, this Special Dispatch offers a visual analysis of the key figures and takeaways from the IMF’s report including:
- The global decline in economic growth forecasts
- Real GDP growth and inflation forecasts for major nations in 2024
- When interest rate cuts will happen and interest rate forecasts
- How debt-to-GDP ratios have changed since 2000
- And much more!

Get the Full Breakdown in the Next VC+ Special Dispatch
VC+ members will receive the full Special Dispatch on Thursday, April 25th.
Make sure you join VC+ now to receive exclusive charts and the full analysis of key takeaways from IMF’s World Economic Outlook.
Don’t miss out. Become a VC+ member today.
What You Get When You Become a VC+ Member
VC+ is Visual Capitalist’s premium subscription. As a member, you’ll get the following:
- Special Dispatches: Deep dive visual briefings on crucial reports and global trends
- Markets This Month: A snappy summary of the state of the markets and what to look out for
- The Trendline: Weekly curation of the best visualizations from across the globe
- Global Forecast Series: Our flagship annual report that covers everything you need to know related to the economy, markets, geopolitics, and the latest tech trends
- VC+ Archive: Hundreds of previously released VC+ briefings and reports that you’ve been missing out on, all in one dedicated hub
You can get all of the above, and more, by joining VC+ today.

-

 Markets1 week ago
U.S. Debt Interest Payments Reach $1 Trillion
-

 Business2 weeks ago
Charted: Big Four Market Share by S&P 500 Audits
-

 Real Estate2 weeks ago
Ranked: The Most Valuable Housing Markets in America
-

 Money2 weeks ago
Which States Have the Highest Minimum Wage in America?
-

 AI2 weeks ago
Ranked: Semiconductor Companies by Industry Revenue Share
-

 Markets2 weeks ago
Ranked: The World’s Top Flight Routes, by Revenue
-

 Demographics2 weeks ago
Population Projections: The World’s 6 Largest Countries in 2075
-

 Markets2 weeks ago
The Top 10 States by Real GDP Growth in 2023