Technology
Imagining the Future of Design and Collaboration
Imagining the Future of Design and Collaboration
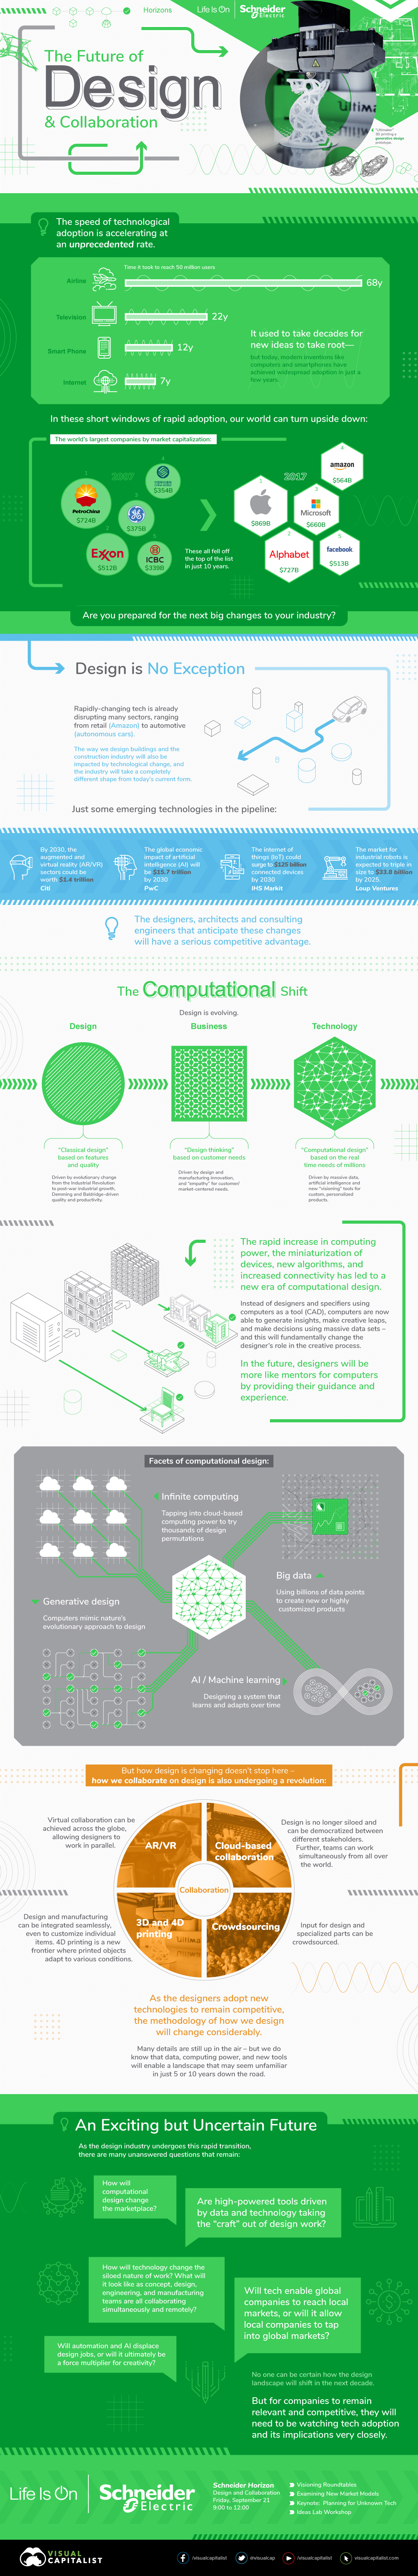
New technologies are getting adopted faster and faster.
In the modern business environment, it no longer takes multiple decades for new ideas to take root. Instead, thanks to increased connectivity, instantaneous communication, and big leaps in computing power, these new innovations can rise to prominence in much shorter time spans.
As these changes surface, companies can either help pioneer these new technologies – or they can be caught off guard by their impact on industry.
A Fundamental Shift
Today’s infographic comes to us from Schneider Electric, and it dives into the many technological forces that will be re-shaping the future of design and collaboration.
It touches on an exciting but uncertain future for industrial designers, architects, engineers, and other design-oriented industries, in which rising processing power and new technologies are re-wiring the fundamental relationship between the designer and the end product.
Almost certainly, these forces will shape a competitive landscape for the design industry that will seem almost completely unfamiliar over the next decade or so.
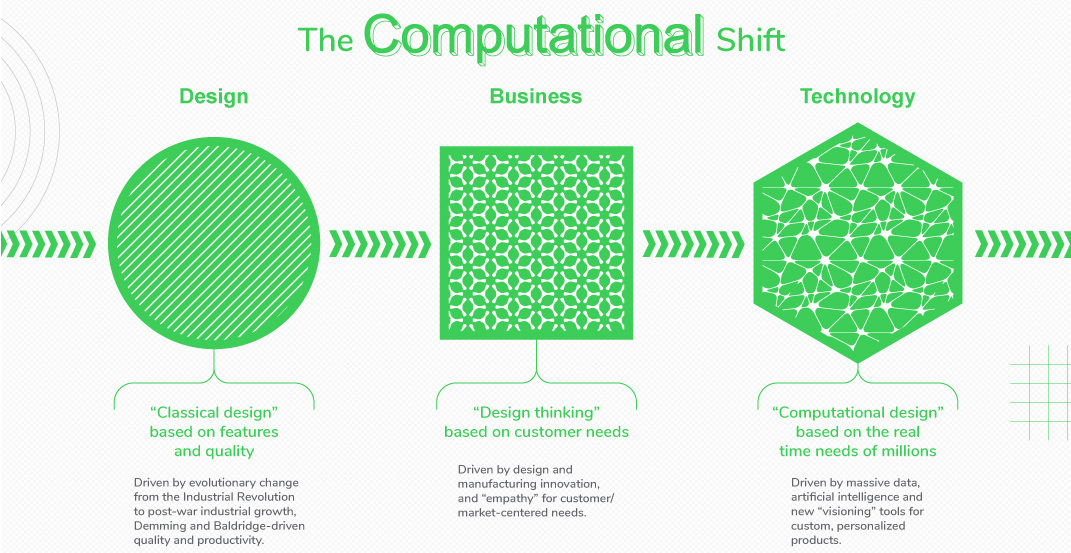
The Computational Era
Computer-aided design (CAD) has already revolutionized design, but it turns out that CAD only scratches the surface of what is possible with computers.
The rapid increase in processing power, the miniaturization of devices, new algorithms, and increased connectivity are leading to a new era of computational design.
Instead of designers using computers as a tool, computers are now able to generate insights, make creative leaps, and jump to decisions using massive data sets – and this will fundamentally change the designer’s role in the creative process.
In the future, designers will be more like mentors for computers by providing their guidance and experience.
The Forces Shaping Design
What do we mean when we say “computational design”?
Infinite computing
Tapping into cloud-based computing power to try thousands of design permutations.
Big data & predictive analytics
Using billions of data points and predictive analytics to create new or highly customized products.
Generative design
Computers mimic nature’s evolutionary approach to design.
AI / Machine learning
Designing a system that learns and adapts over time.
The Forces Shaping Collaboration
But how design is changing doesn’t stop there – how we collaborate on design is also undergoing a revolution:
AR/VR
Virtual collaboration can be achieved across the globe, allowing designers to work in parallel.
Cloud-based collaboration
Design is no longer siloed and can be democratized between different stakeholders. Further, teams can work simultaneously from all over the world.
Crowdsourcing
Input for design and specialized parts can be crowdsourced.
3d and 4d printing
Design and manufacturing can be integrated seamlessly, even to customize individual items. 4d printing is a new frontier where printed objects adapt to various circumstances.
An Uncertain Future
Data, computing power, and new tools are enabling a rapid transition in how we design and collaborate.
No one can be certain about how different the future of design and collaboration will be, or how it will affect business models – but for companies to remain relevant and competitive over the coming years, they will need to be watching this technological revolution very closely.


Technology
Ranked: Semiconductor Companies by Industry Revenue Share
Nvidia is coming for Intel’s crown. Samsung is losing ground. AI is transforming the space. We break down revenue for semiconductor companies.


Semiconductor Companies by Industry Revenue Share
This was originally posted on our Voronoi app. Download the app for free on Apple or Android and discover incredible data-driven charts from a variety of trusted sources.
Did you know that some computer chips are now retailing for the price of a new BMW?
As computers invade nearly every sphere of life, so too have the chips that power them, raising the revenues of the businesses dedicated to designing them.
But how did various chipmakers measure against each other last year?
We rank the biggest semiconductor companies by their percentage share of the industry’s revenues in 2023, using data from Omdia research.
Which Chip Company Made the Most Money in 2023?
Market leader and industry-defining veteran Intel still holds the crown for the most revenue in the sector, crossing $50 billion in 2023, or 10% of the broader industry’s topline.
All is not well at Intel, however, with the company’s stock price down over 20% year-to-date after it revealed billion-dollar losses in its foundry business.
| Rank | Company | 2023 Revenue | % of Industry Revenue |
|---|---|---|---|
| 1 | Intel | $51B | 9.4% |
| 2 | NVIDIA | $49B | 9.0% |
| 3 | Samsung Electronics | $44B | 8.1% |
| 4 | Qualcomm | $31B | 5.7% |
| 5 | Broadcom | $28B | 5.2% |
| 6 | SK Hynix | $24B | 4.4% |
| 7 | AMD | $22B | 4.1% |
| 8 | Apple | $19B | 3.4% |
| 9 | Infineon Tech | $17B | 3.2% |
| 10 | STMicroelectronics | $17B | 3.2% |
| 11 | Texas Instruments | $17B | 3.1% |
| 12 | Micron Technology | $16B | 2.9% |
| 13 | MediaTek | $14B | 2.6% |
| 14 | NXP | $13B | 2.4% |
| 15 | Analog Devices | $12B | 2.2% |
| 16 | Renesas Electronics Corporation | $11B | 1.9% |
| 17 | Sony Semiconductor Solutions Corporation | $10B | 1.9% |
| 18 | Microchip Technology | $8B | 1.5% |
| 19 | Onsemi | $8B | 1.4% |
| 20 | KIOXIA Corporation | $7B | 1.3% |
| N/A | Others | $126B | 23.2% |
| N/A | Total | $545B | 100% |
Note: Figures are rounded. Totals and percentages may not sum to 100.
Meanwhile, Nvidia is very close to overtaking Intel, after declaring $49 billion of topline revenue for 2023. This is more than double its 2022 revenue ($21 billion), increasing its share of industry revenues to 9%.
Nvidia’s meteoric rise has gotten a huge thumbs-up from investors. It became a trillion dollar stock last year, and broke the single-day gain record for market capitalization this year.
Other chipmakers haven’t been as successful. Out of the top 20 semiconductor companies by revenue, 12 did not match their 2022 revenues, including big names like Intel, Samsung, and AMD.
The Many Different Types of Chipmakers
All of these companies may belong to the same industry, but they don’t focus on the same niche.
According to Investopedia, there are four major types of chips, depending on their functionality: microprocessors, memory chips, standard chips, and complex systems on a chip.
Nvidia’s core business was once GPUs for computers (graphics processing units), but in recent years this has drastically shifted towards microprocessors for analytics and AI.
These specialized chips seem to be where the majority of growth is occurring within the sector. For example, companies that are largely in the memory segment—Samsung, SK Hynix, and Micron Technology—saw peak revenues in the mid-2010s.

-

 Maps2 weeks ago
Mapped: Average Wages Across Europe
-

 Money1 week ago
Which States Have the Highest Minimum Wage in America?
-

 Real Estate1 week ago
Ranked: The Most Valuable Housing Markets in America
-

 Markets1 week ago
Charted: Big Four Market Share by S&P 500 Audits
-

 AI1 week ago
The Stock Performance of U.S. Chipmakers So Far in 2024
-

 Automotive2 weeks ago
Almost Every EV Stock is Down After Q1 2024
-

 Money2 weeks ago
Where Does One U.S. Tax Dollar Go?
-

 Green2 weeks ago
Ranked: Top Countries by Total Forest Loss Since 2001