

Intel, TSMC, and more have received billions in subsidies from the U.S. CHIPS Act in 2024.


See which countries have been granted the most AI patents each year, from 2012 to 2022.


From complete overhauls to more subtle tweaks, these tech logos have had quite a journey. Featuring: Google, Apple, and more.


While smaller animals such as weasels typically live 1-2 years, larger counterparts can thrive for decades.


We illustrate how much the highest earning athletes across seven different sports make, and where they get their money from.


See how much the debt-to-GDP ratios of advanced economies have grown (or shrank) since the year 2000.


We detail the admission rates and average annual cost for Ivy League schools, as well as the median SAT scores required to be accepted.


The price of gold has set record highs in 2024, but how has this precious metal performed relative to the S&P 500?


South Asian nations are the global hotspot for pollution. In this graphic, we rank the world’s most polluted countries according to IQAir.


We visualized the top U.S. companies by employees, revealing the massive scale of retailers like Walmart, Target, and Home Depot.


We visualized product categories that saw the highest % increase in price due to U.S. inflation as of March 2024.


See how the world's 6 largest countries will grow (or shrink) by 2075, based on the latest UN population projections.


Which of the Big Four accounting firms take home the most audit fees from their S&P 500 clients?


The Nvidia rocket ship is refusing to slow down, leading the pack of strong stock performance for most major U.S. chipmakers.


We compiled the performance of 10 pure play EV stocks into one chart, revealing one company that bucked the broader trend.


Listing the many programs—health, defense, veterans benefits—that U.S. federal taxes fund, in the form of a single federal tax dollar.


By 2050, one in six people will be aged 65 or older. Here, we map the growth of the senior population by region.


Tesla and BYD have once again swapped places as the global leader in BEV sales.


We compare America's top 10 companies by revenue in 1994 and 2023 to see how the business landscape has changed.


In this graphic, we illustrate the top ten emerging markets according to their foreign direct investment (FDI) momentum in 2024.


See how the Nasdaq debut of Trump Media & Technology Group has influenced Trump's net worth, according to Forbes estimates.


This graphic shows how Nvidia's revenue sources have changed over time, highlighting how the AI boom has transformed its bottom line.
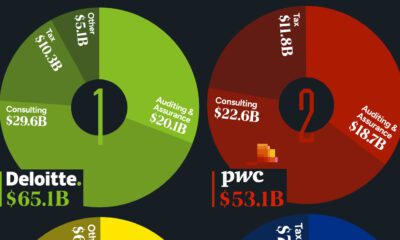

The Big Four accounting firms amassed over $200 billion in combined revenue in 2023.


In a rapidly changing economy, some skill sets are losing their sheen. Here are the worst college majors for finding a job.


We visualize the results of a YouGov survey that determined the most popular beers among each U.S. generation.


This list excludes humans, who would otherwise lead the ranks of most common primates by a significant margin.


In this infographic, we map out internet usage by global region based on the latest data from the World Bank.


Korean brands dominate the U.S. TV market.


North America and East Asia have the speediest internet.


A survey of 600 high net worth individuals revealed there’s one subset of people who are confident of making it in 2024.


We visualize inflation rates across G20 countries as of Feb 2024, in the context of their COVID-19 pandemic peak.


In this graphic we rank the top Swiss watch brands, based on their estimated 2023 market share.


This visual heatmap of unemployment claims by state highlights New York, California, and Alaska leading the country by a wide margin.


This graphic compares the nominal vs. inflation-adjusted value of the U.S. minimum wage, from 1940 to 2023.


This ranking of car brand loyalty shows what percentage of owners would buy from the same brand for their next vehicle.
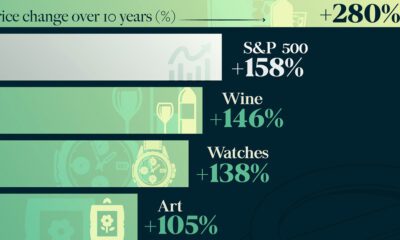

How does investing in luxury goods like expensive watches and rare whisky compare to other goods, or to the S&P 500?


This visualization compares EpiPen prices around the world, with the U.S. having the highest prices by far.
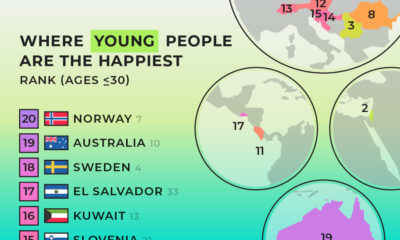

We summarized results from the World Happiness Report 2024 to see where young people are the happiest.


Cloud computing service providers generated $270 billion in revenues last year, concentrated among a few giants.
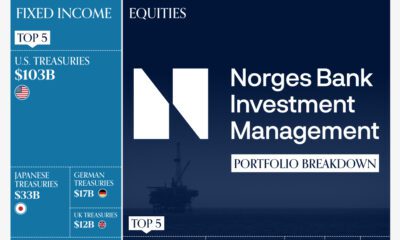

This graphic breaks down the portfolio of the world's largest sovereign wealth fund, valued at $1.4 trillion.


Ramadan is the ninth month of the Islamic calendar, observed by Muslims worldwide as a month of fasting, prayer, reflection, and community.


The 12 worst investment funds have destroyed $56 billion in shareholder wealth over the past decade, as of Dec. 2023.


From MicroStrategy to Tesla, this graphic shows who holds the most bitcoins globally across corporate companies.


Japan’s birth rate has been declining. Here, we illustrate the number of live births each year compared to the number of annual deaths.


How big are the world's biggest banks? In this visualization, we show the top 50 banks by assets and headquarters location.


With trillion dollar valuations becoming more common, we've compared the five biggest companies by stock exchange.


We visualized the results of an analysis by the World Economic Forum, which uncovered the jobs most impacted by AI.


We visualize the recent performance of the Magnificent Seven stocks, uncovering a clear divergence between the group's top and bottom names.


This graphic illustrates the size of the top 20 Chinese stocks, along with their 1-year return as of March 2024.


Sovereign wealth funds have scaled up their green investments in the push towards decarbonizing the global economy.


