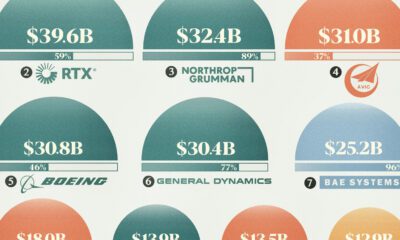

With billions in defense contracts handed out annually, who are the key players profiting? View this graphic to find out.
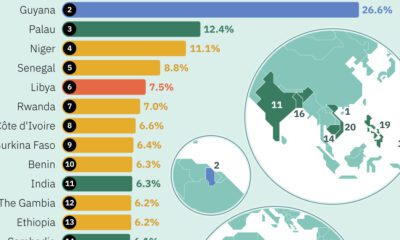

This graphic uses the latest IMF projections to rank the world's top 20 fastest growing economies for 2024.
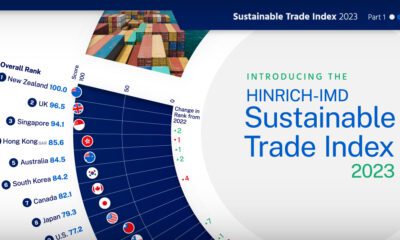

The Sustainable Trade Index 2023 is an annual ranking of the world's most sustainable economies. View this infographic to see the results.


The global middle class is expected to grow by 113 million people in 2024. We visualize this growth by country and region.
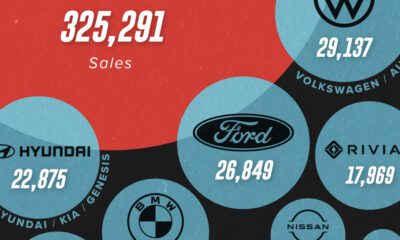

U.S. EV sales continue to be dominated by Tesla, which outsold all of its competitors combined in H1 2023.
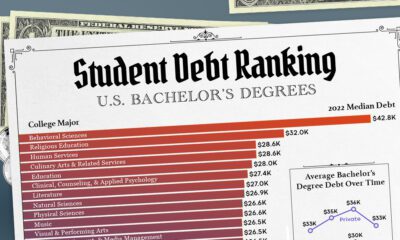

The median student debt for a U.S. bachelor's degree ranges from $43,000 to $13,000. View this graphic to see where each major falls in line.


Data from the World Trade Organization highlights the world's 10 largest automotive exporters in 2022.
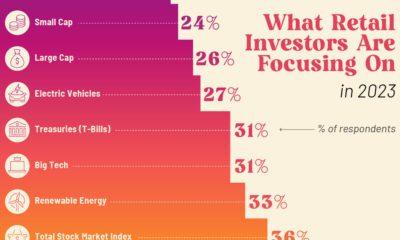

What key themes and strategies are retail investors looking at for the rest of 2023? Preview: AI is a popular choice.


Google’s dominant search engine market share has prompted the U.S. Justice Department to file a lawsuit over anticompetitive practices.
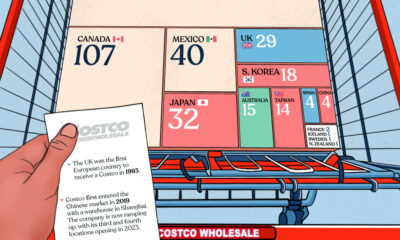

This graphic breaks down the number of Costco stores globally, providing insight into the retailer's global presence.
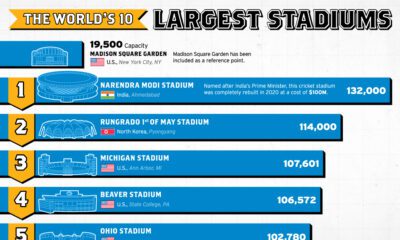

The U.S. is known for its massive arenas, but in a top 10 ranking of the world's largest stadiums, two other countries take the lead.
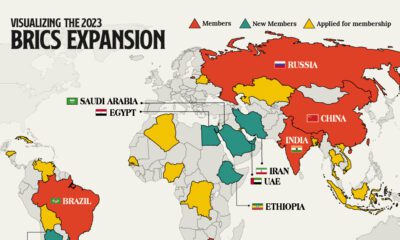

We provide a data-driven overview of how the recent BRICS expansion will grow the group’s influence and reach.
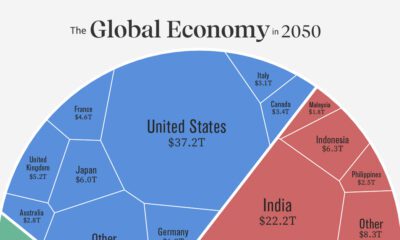

Asia is expected to represent the world's largest share of real GDP in 2050. See how this all breaks down in one chart.
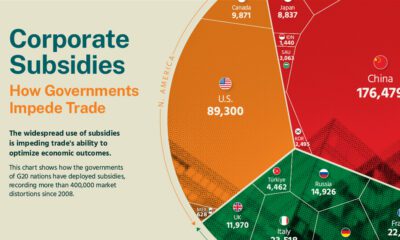

The Hinrich Foundation visualizes the impact of corporate subsidies by G20 nations between 2008 and Q1 2023.
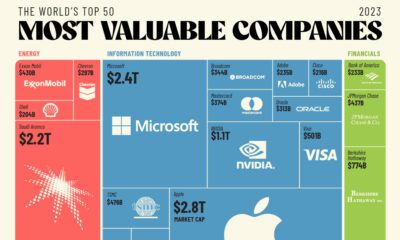

The world's 50 most valuable companies represent over $25 trillion in market cap. We break this massive figure down by company and sector.


We've visualized data from the Federal Reserve to provide a comprehensive break down of U.S. assets by generation.
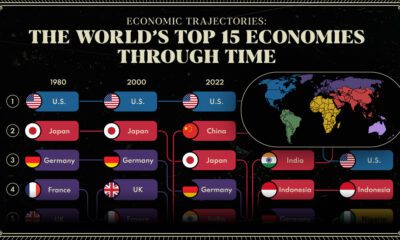

We provide a historical and predictive overview of the top economies in the world, including projections all the way to 2075.
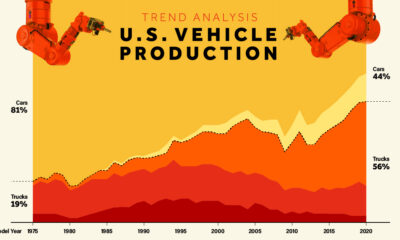

Visualize how U.S. vehicle production has shifted dramatically from cars to trucks, and especially to SUVs, since 1975.


Capture the investment opportunities in biotech with the MSCI Life Sciences Indexes, which target areas like virology and oncology.


From Patagonia to TikTok, which brands are highly regarded in the eyes of Americans? This visual ranks the brand reputations of 100 companies.
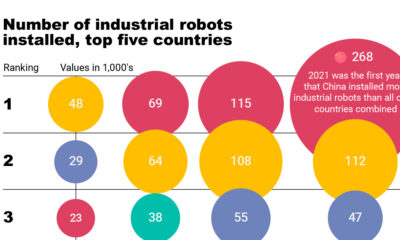

This graphic from MSCI shows the pace of industrial automation across leading countries like China and the U.S.
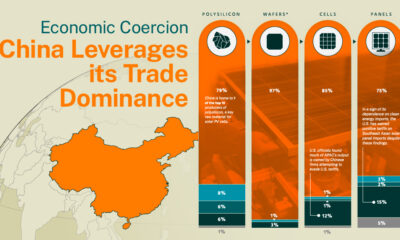

The Hinrich Foundation explores China's use of economic coercion and the implications of its control over the solar energy sector.
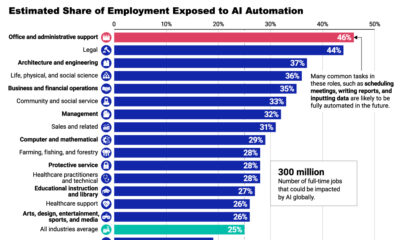

AI automation is expected to impact some industries more than others. See the latest projections in this infographic.


BlackRock is the world's largest asset manager, with over $9 trillion in holdings. Here are the company's top equity holdings.
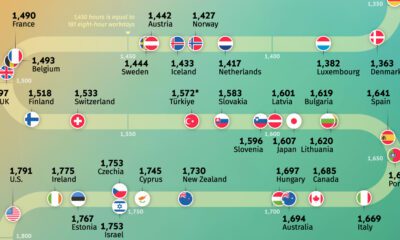

Where do people work the most? Explore our analysis of the average annual working hours across OECD countries.


This infographic visualizes 10-year annualized forecasts for both equities and fixed income using data from Vanguard.


Which companies prioritize innovation the most? This infographic highlights BCG's 2023 Most Innovative Companies ranking.
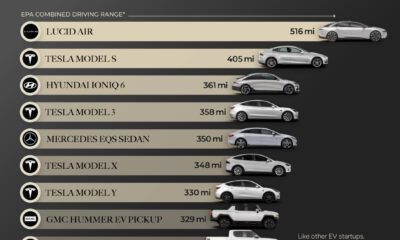

This infographic lists 10 of the longest range EVs currently for sale in the U.S. in 2023. The Lucid Air takes first place at 516 miles.


This graphic visualizes the market capitalizations of America's 15 largest semiconductor companies.
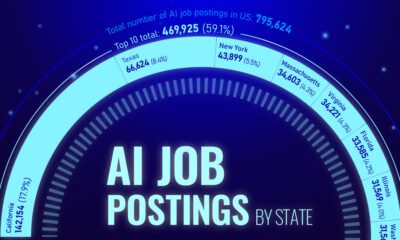

Nearly 800,000 AI jobs were posted in the U.S. throughout 2022. View this graphic to see a breakdown by state.
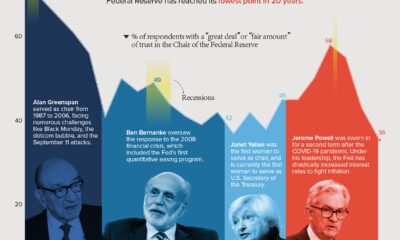

Public trust in the Federal Reserve chair has hit its lowest point in 20 years. Get the details in this infographic.
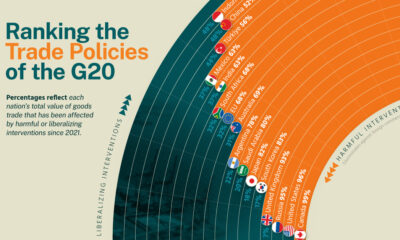

We analyze recent trade policies implemented by G20 members to determine whether they are liberalizing or harmful.
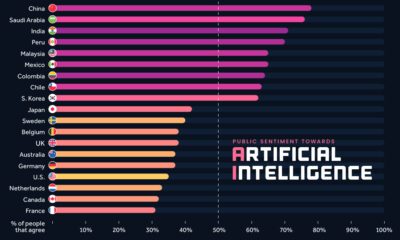

We visualize survey results from over 19,000 adults across 28 countries to see how attitudes towards AI differ around the world.
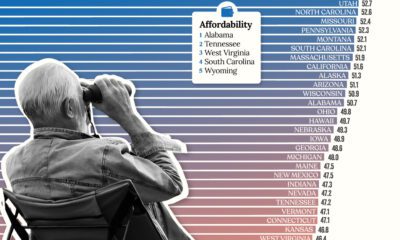

Getting ready for retirement? See which states score the highest in terms of affordability, quality of life, and health care.


We visualize the performance of ChatGPT in various professional and academic exams, highlighting the improvements of GPT-4 over GPT-3.5.
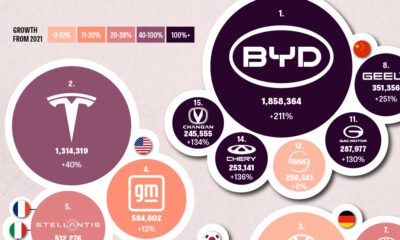

This graphic explores the latest EV production data for 2022, which shows BYD taking a massive step forward to surpass Tesla.
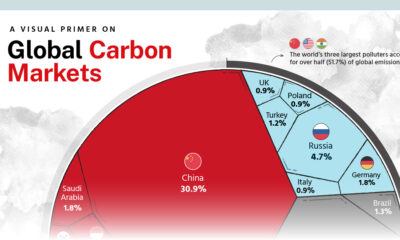

We highlight key findings from the Hinrich Foundation’s latest report on carbon markets, produced in partnership with Visual Capitalist.
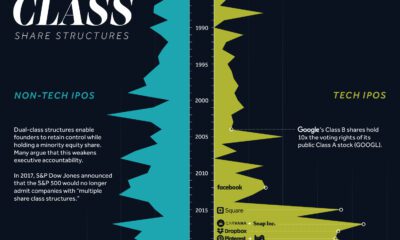

Dual-class share structures are rising in popularity, and they give executives much more voting power within a public company.
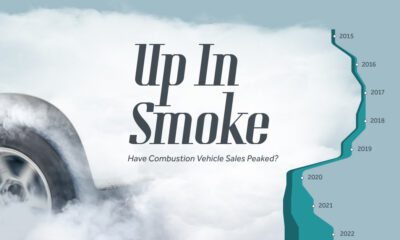

With EVs becoming more popular around the world, have combustion vehicles reached a peak? Find out in this infographic.


This infographic examines 50 years of data to highlight a clear visual trend: recessions are preceded by a cyclical low in unemployment.


This infographic shows the net minimum wage across 67 countries, as of January 2023. A breakdown by U.S. state is also included.


After a borrowing spree during COVID-19, younger Americans are struggling to keep up with their auto loan payments.


This infographic ranks the 10 most valuable bank brands over the past five years (Spoiler: U.S. banks aren't in the top four)


This infographic lists the 10 most popular stocks (or ETFs) that retail investors have been buying in 2023 so far.


See how 14 major automakers have adopted various fuel-saving technologies in this infographic based on EPA data.


This infographic compares Tesla's impressive profit margins to various Western and Chinese competitors.


This infographic shows you the odds of dying from a variety of accidents, including car crashes, bee stings, and more.


This infographic lists the most fuel efficient cars over the past 46 years, including the current leader for 2023.
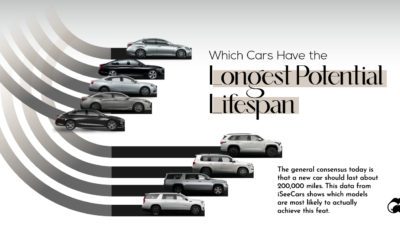

Japanese automakers like Toyota are known to produce some of the longest lasting cars in the world, but does the data support this claim?
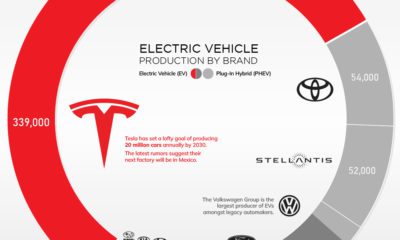

Tesla is still the dominant player in electric vehicles. However, it may not be long until the rest of the industry catches up.


