COVID-19
The Year in Review: 2020 in 20 Visualizations
Can you remember a year more life-changing than 2020?
Over a million lives were lost in the pandemic, oil prices turned negative, and protests swept the streets. At the same time, 10 years of technology advancements seemed to happen in mere months—and now vaccinations are rolling out at a record speed.
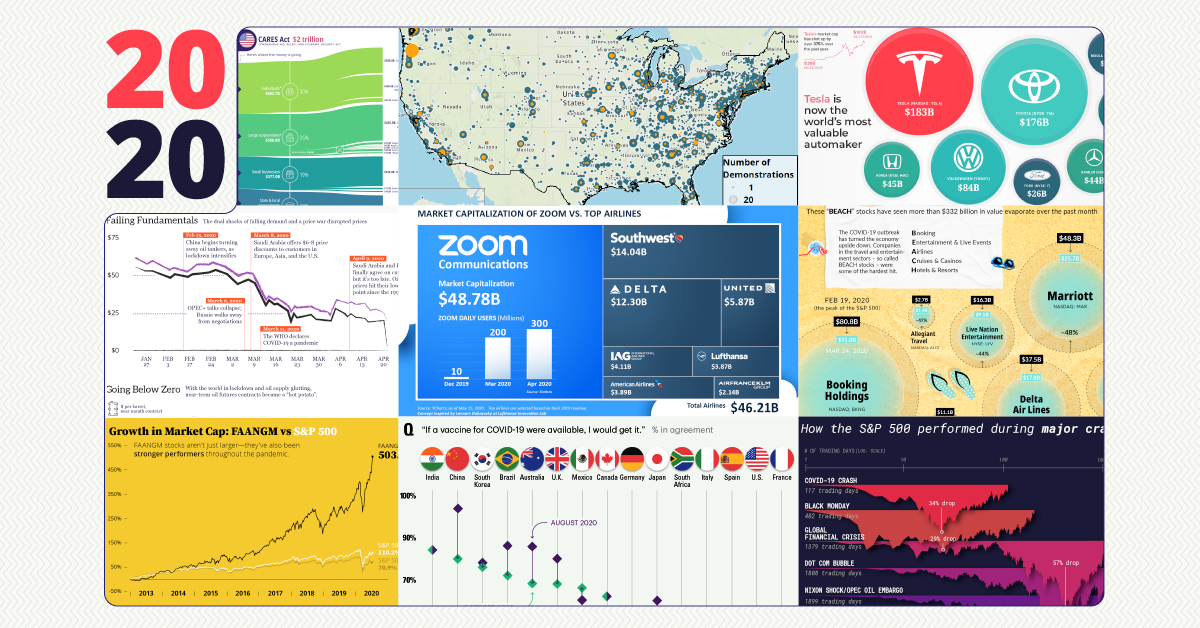
Below, we round up some of the year’s biggest news events with charts and visualizations.
The Year in Review: 2020 in 20 Visualizations
Graphic #1 ⟩⟩ January 2020
Australian Bushfires
For some in the Southern Hemisphere who ushered in the new year first, it started on fire.
Reuters assessed the scale of the damage caused by bushfires across Australia. In fact, total burned areas reached 18.6 million hectares (186,000km²) by March, bigger than the total land mass of entire countries like Cuba.
Here’s the damage done in the state of New South Wales alone, compared to previous years:
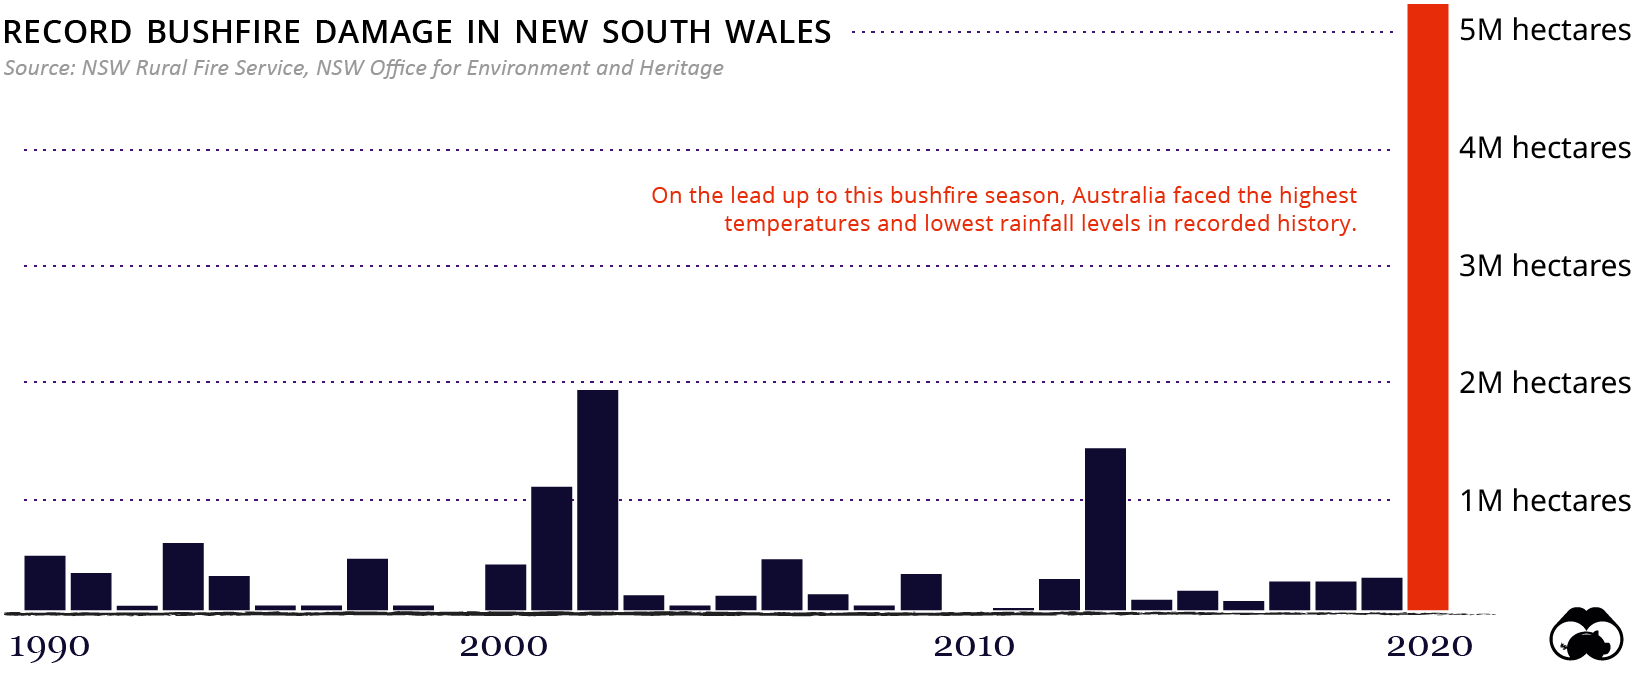
While bushfires are common in Australia, this year, dry conditions fueled the flames. The fires raged for nearly 80 days, displacing or killing nearly 3 billion animals—a devastating biodiversity loss for the country.
Graphic #2 ⟩⟩ January 2020
Rising Iran–U.S. Tensions
In early January, a U.S. air strike incinerated the car of General Qassim Suleimani, a security mastermind and one of Iran’s most powerful military strategists. U.S. officials claimed that Iran was planning an “imminent” attack.
In retaliation, Iran fired two rockets at U.S. military bases located in Iraq. No one was killed. As tensions escalated, the U.S. House of Representatives passed a bill to try and restrict President Trump’s use of military power against Iran without approval.
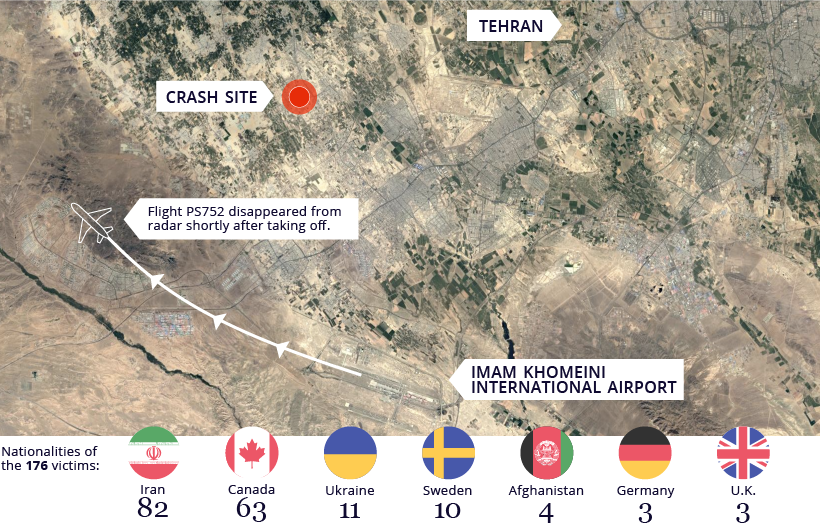
Later, in mid-January, Iran’s Revolutionary Guard admitted that it mistakenly shot down a Ukrainian passenger jet, responsible for the death of 176 people.
Graphic #3 ⟩⟩ March 2020
The Spread of the “Novel Coronavirus”
You’ve heard of Patient Zero, but what about Patient 31?
Before February, cases of the still unnamed virus were largely contained within China, with the rest of the world cautiously observing the country’s containment efforts. Slowly, but surely, the virus began to spread beyond China’s borders.
South Korea’s 31st confirmed COVID-19 case—which was behind the rapid spread of the virus to potentially up to 1,160 contacts in the country—served as a warning to the rest of the world of how fast the virus could spread.
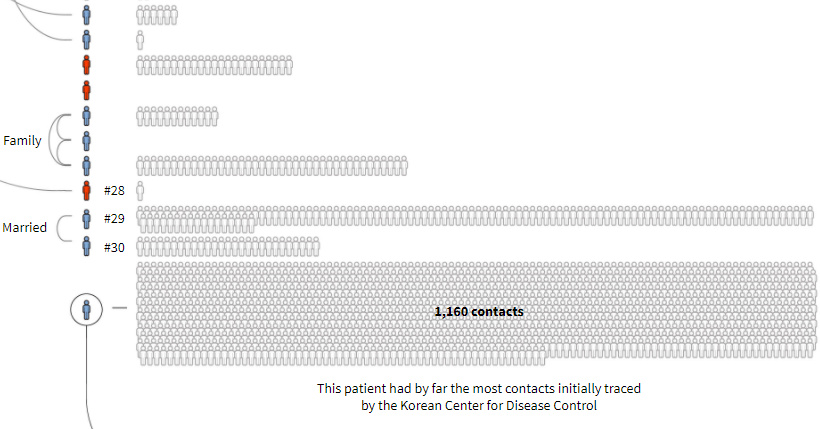
» See the full graphic by Reuters
Reuters’ unique graphic explainer uncovers how just one typical day of multiple “normal” interactions had significant super-spreader effects.
Graphic #4 ⟩⟩ March 2020
The Coronavirus Crash
The S&P 500 erased over a third of its value in under a month—the fastest 30% decline ever recorded on the benchmark index.
As a result, the global tourism industry suffered dramatic losses, with countless cruise ships docked and passenger flights traveling at half-capacity.
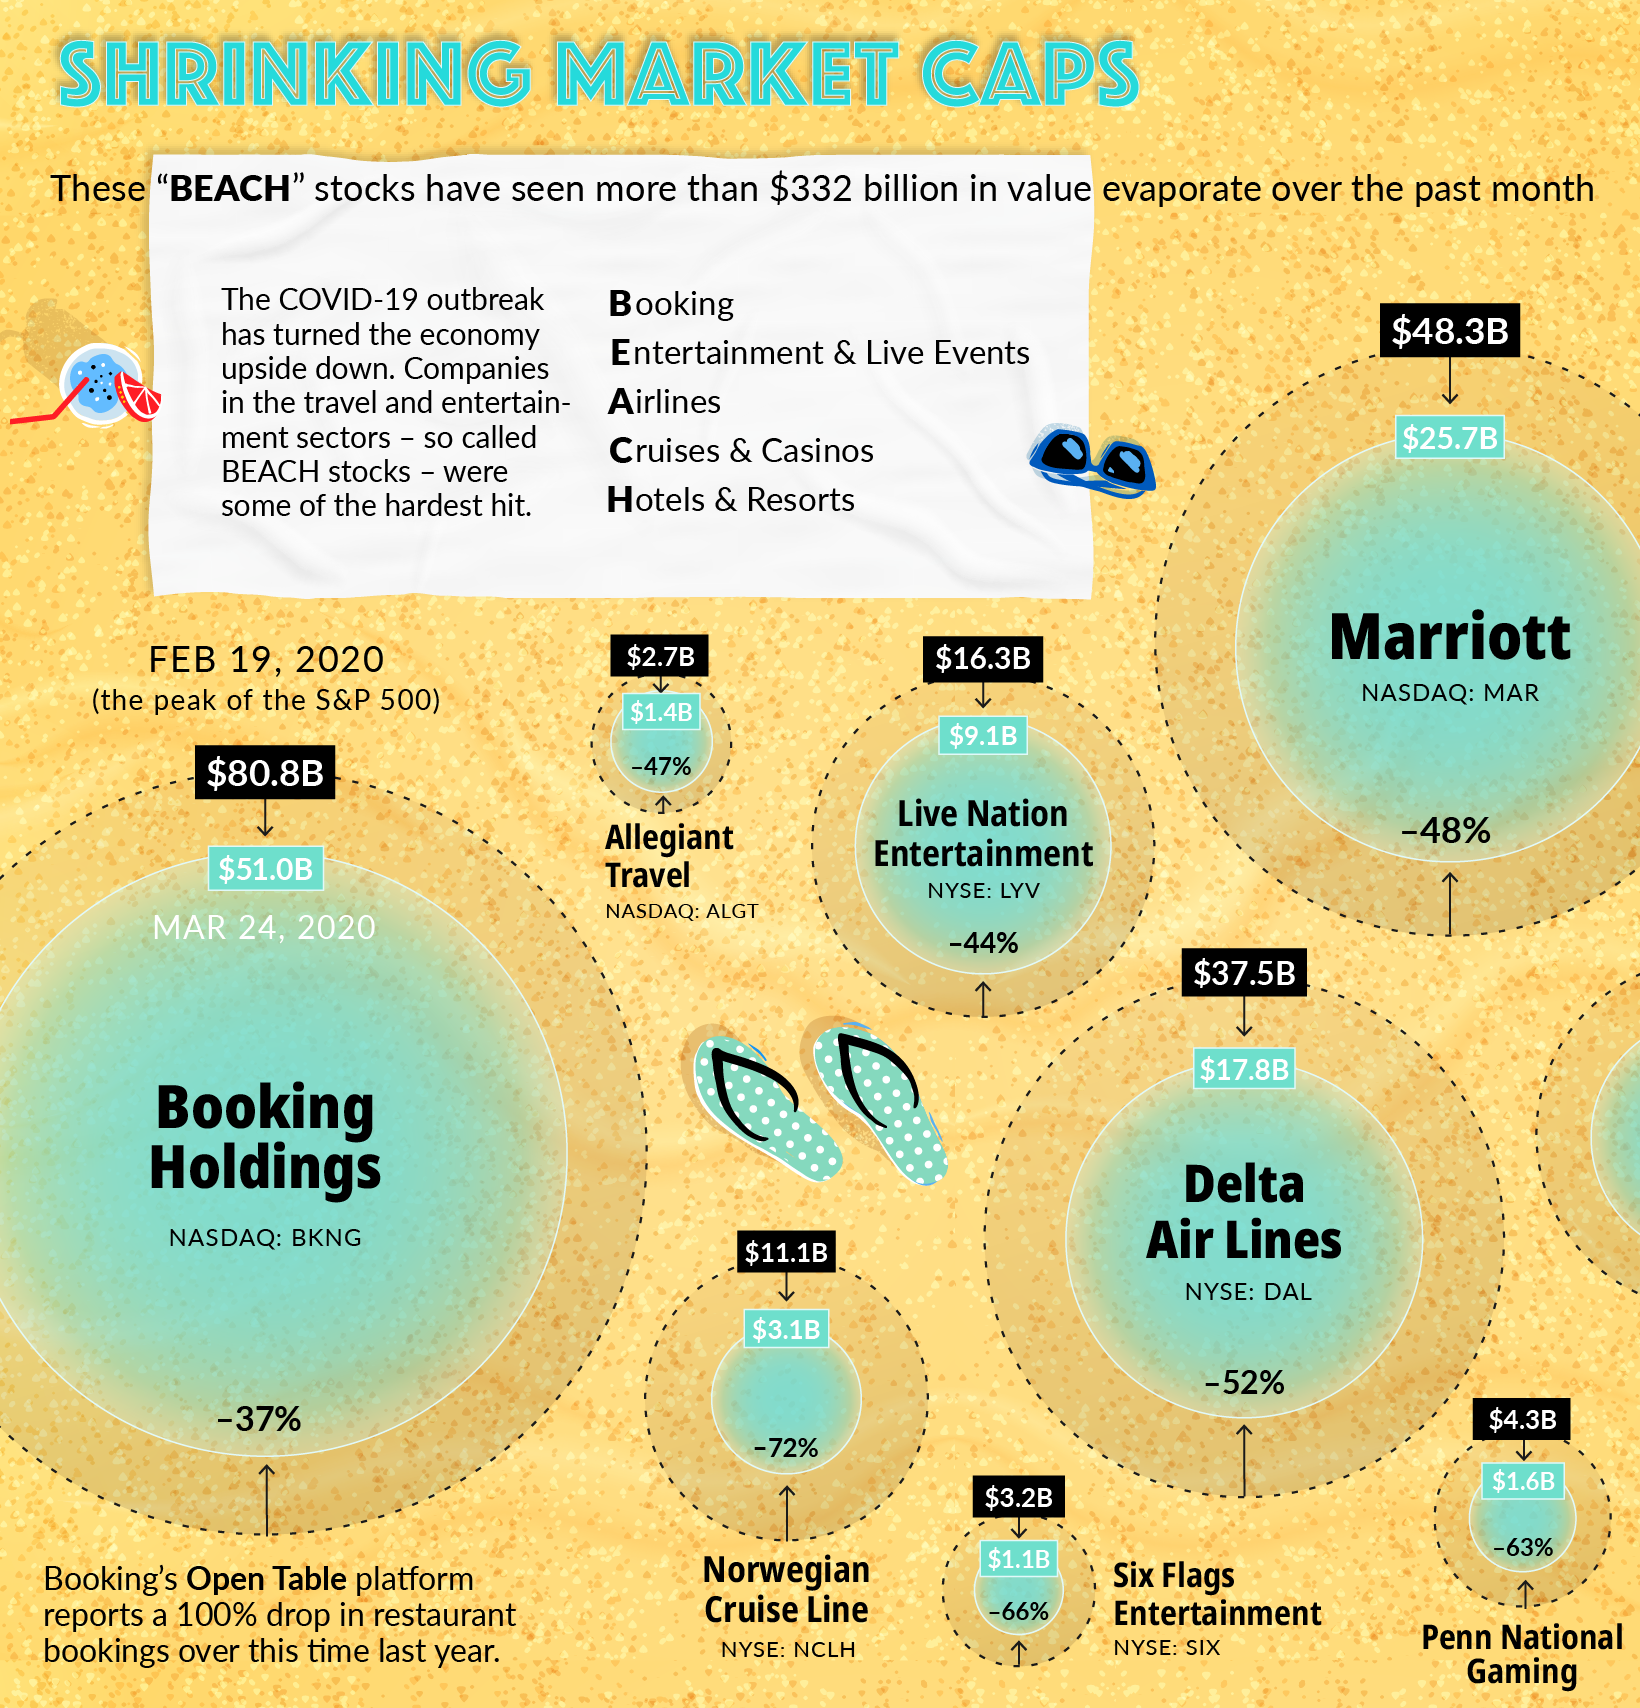
This graphic shows the BEACH stocks—booking, entertainment & live events, airlines, cruises & casinos, hotels & resorts—that were most impacted by worldwide travel bans.
While some of these stocks have since recovered, the ongoing impact of COVID-19 is still most widely being felt among companies in these types of industries.
Graphic #5 & 6 ⟩⟩ March 2020
Lockdown Life Begins
From toilet paper hoarding to limits on gatherings, the pandemic’s immediate effects on our surrounding environment became clear as early as March. As daily life came to a standstill, commuter activity in major cities plummeted throughout the month.
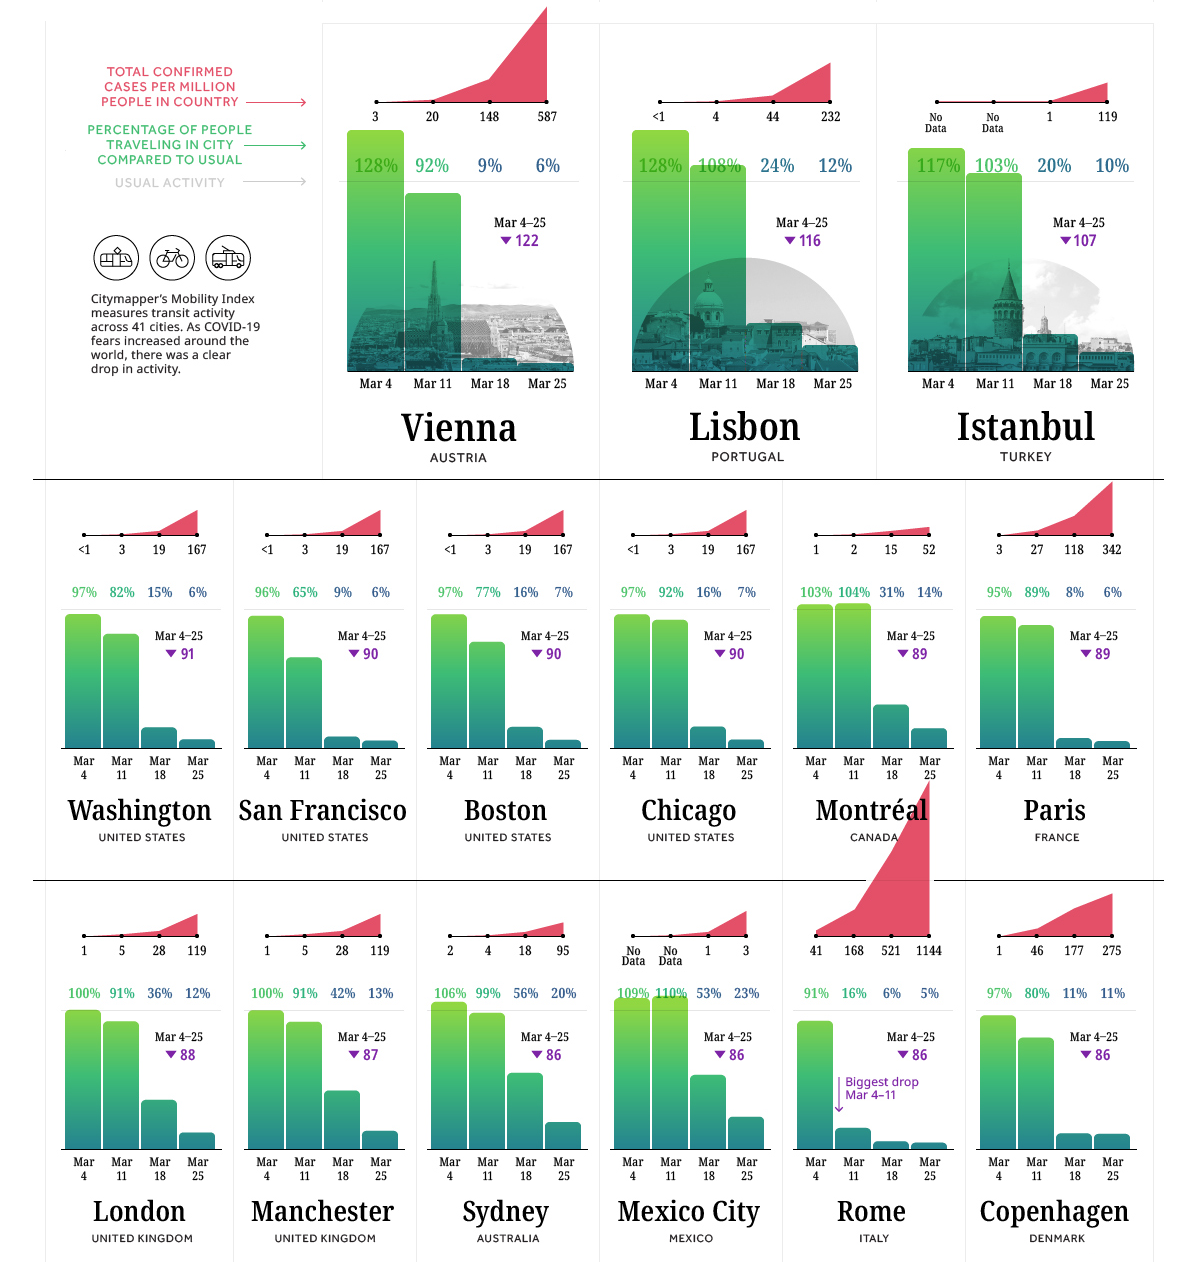
One unintended positive consequence of these shutdowns? Air pollution, such as nitrogen dioxide (NO₂) emissions also steeply dropped alongside these restrictions on movement.
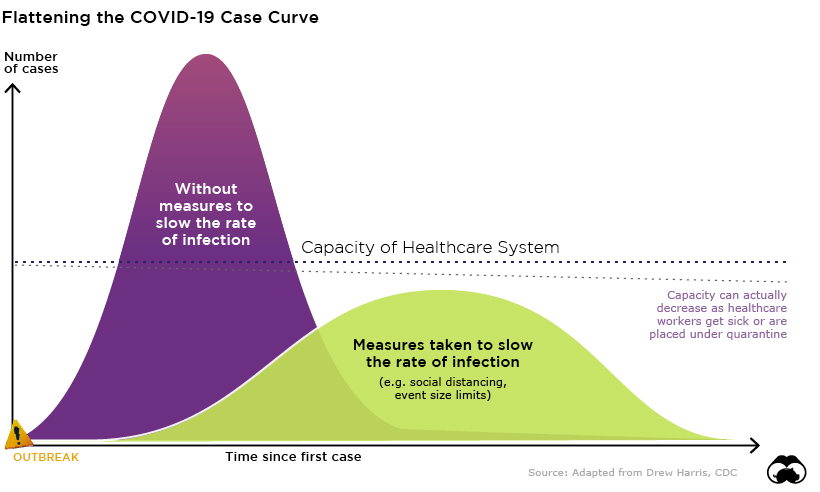
Possibly the most well-known diagram of the pandemic is the one that introduced the world to the phrase “flatten the curve”, showing why it was important to prevent and delay the spread of the virus so that large portions of the population aren’t sick at the same time.
Graphic #7 ⟩⟩ April 2020
Historic U.S. Job Losses
After the World Health Organization declared COVID-19 a global pandemic on March 11, unemployment figures soon hit historic proportions.
Within a month, 22 million in the U.S. had filed jobless claims.
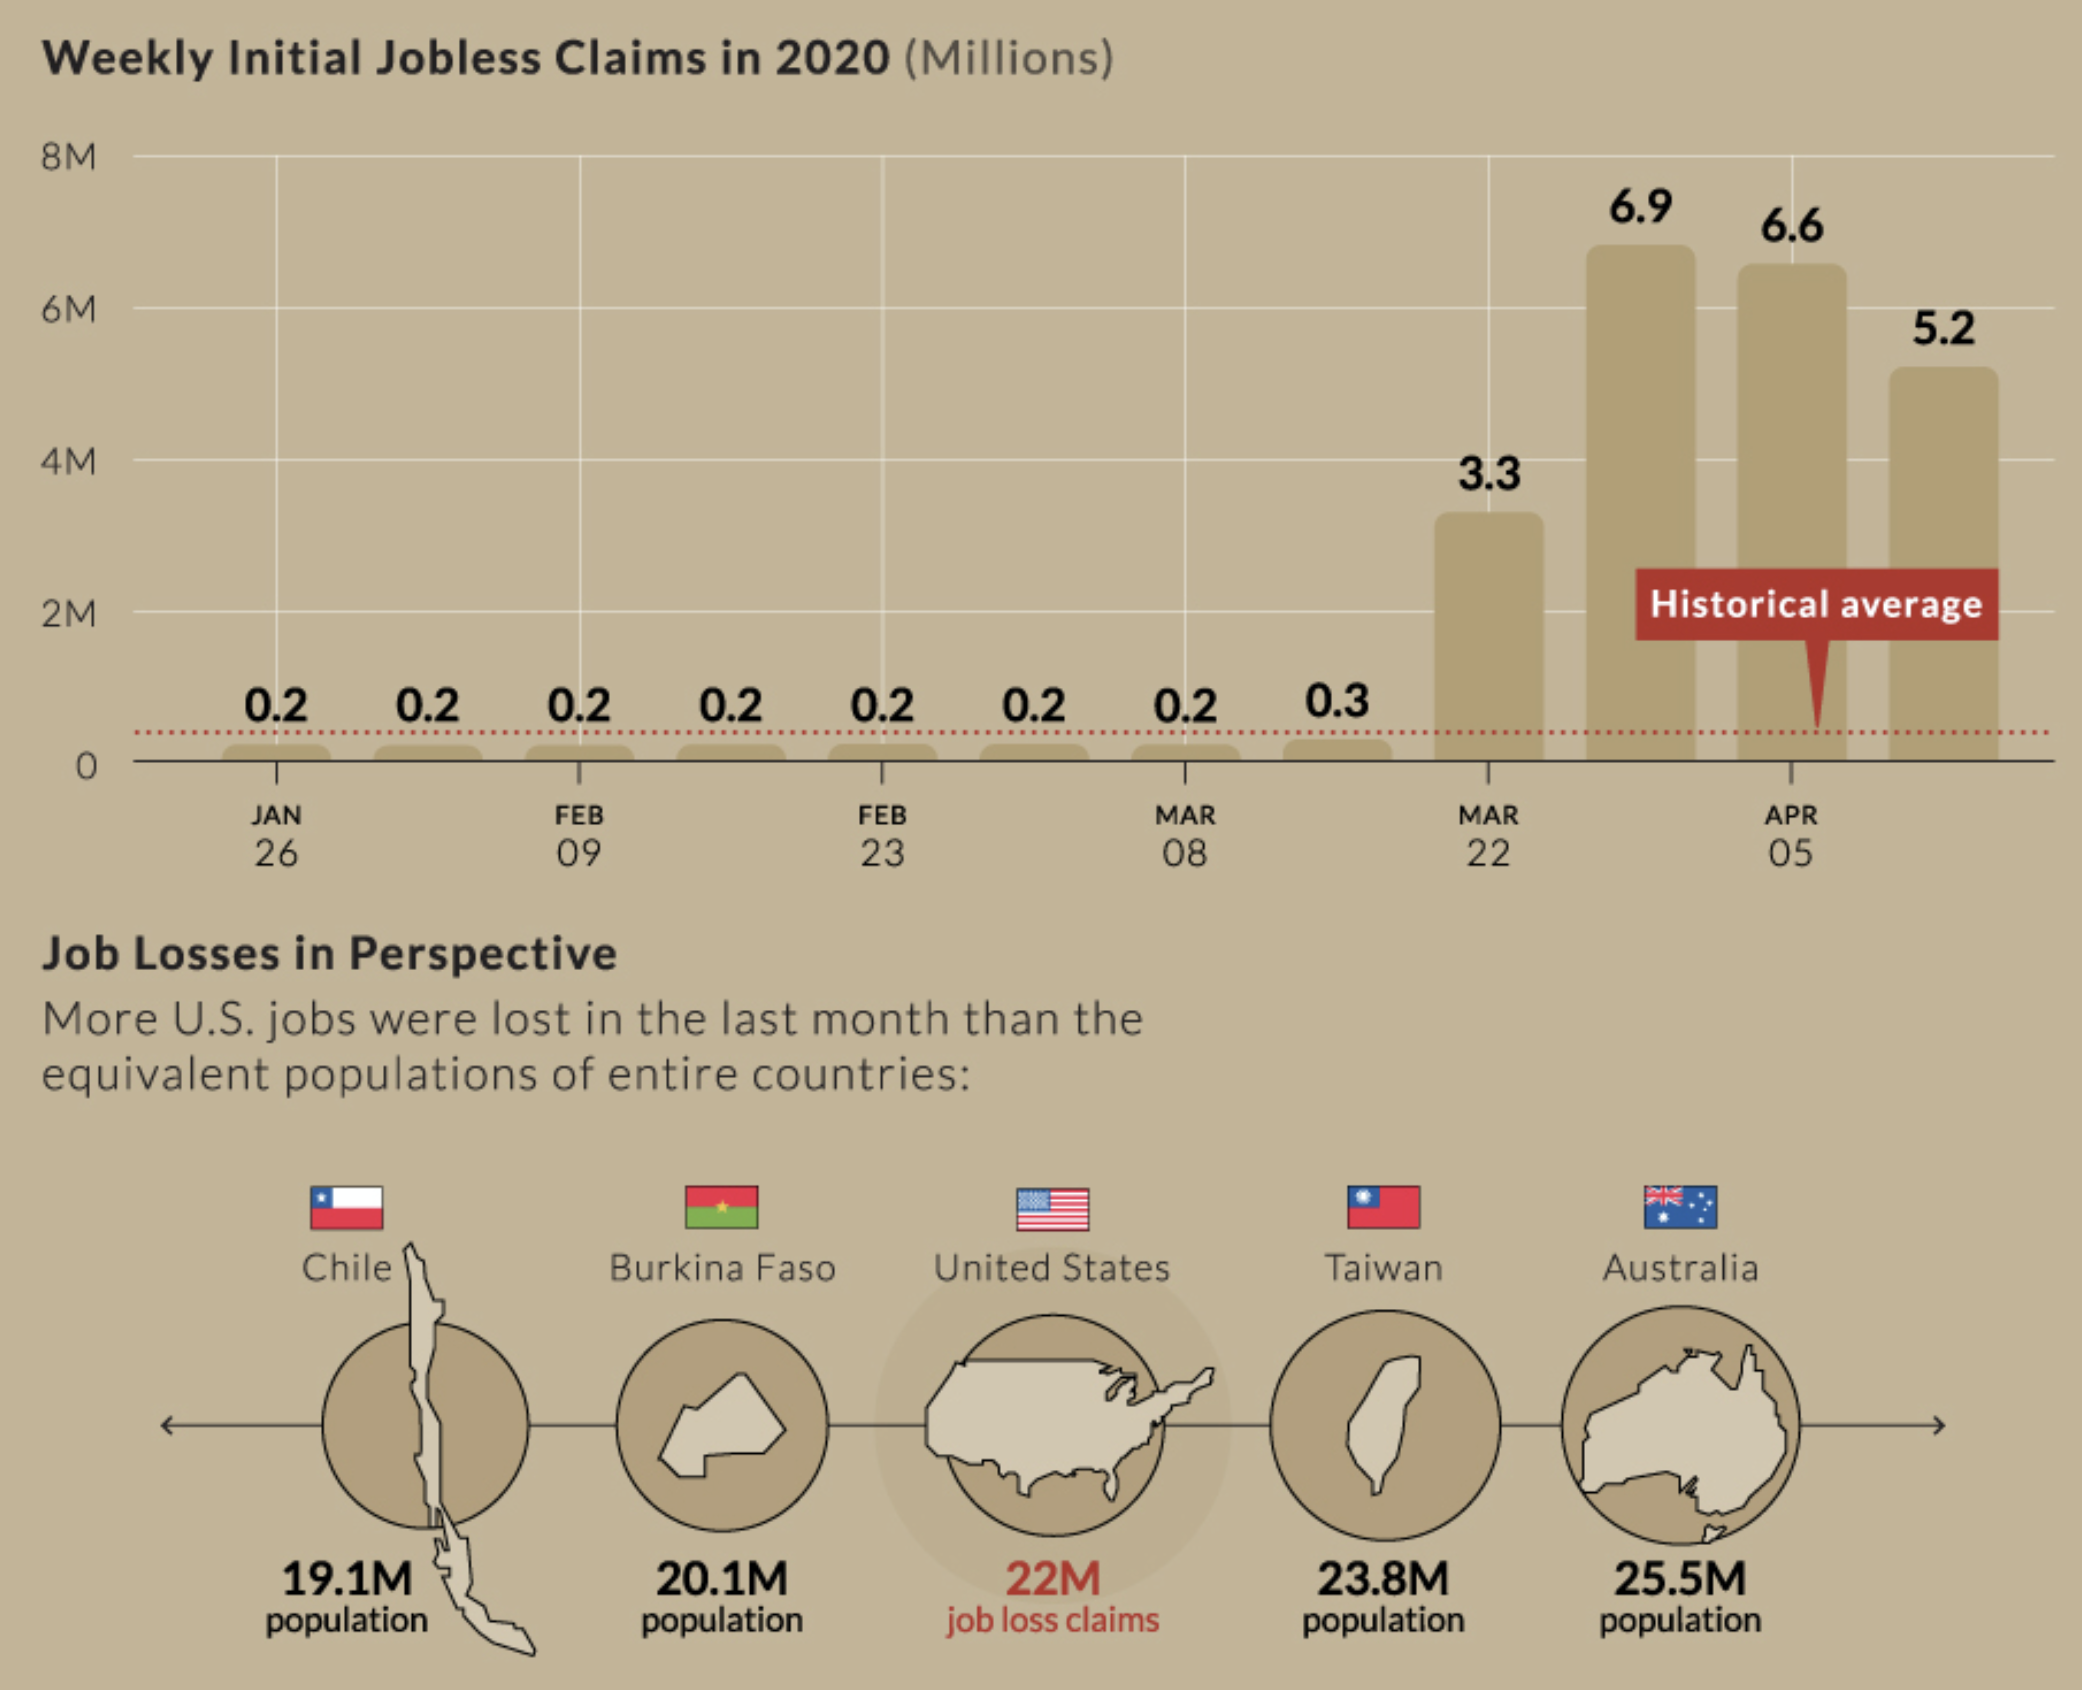
To put this in perspective, U.S. unemployment levels in 2020 were roughly 10 times higher than previous peak unemployment levels in absolute terms. Or, to look at it another way, this is equivalent to the entire population of Chile or Taiwan.
Graphic #8 ⟩⟩ April 2020
Stimulus Announced in the U.S.
On March 27, the $2 trillion CARES Act came into law after facing minimal resistance from the House and Senate. We broke down the historic relief package in the Sankey diagram below.
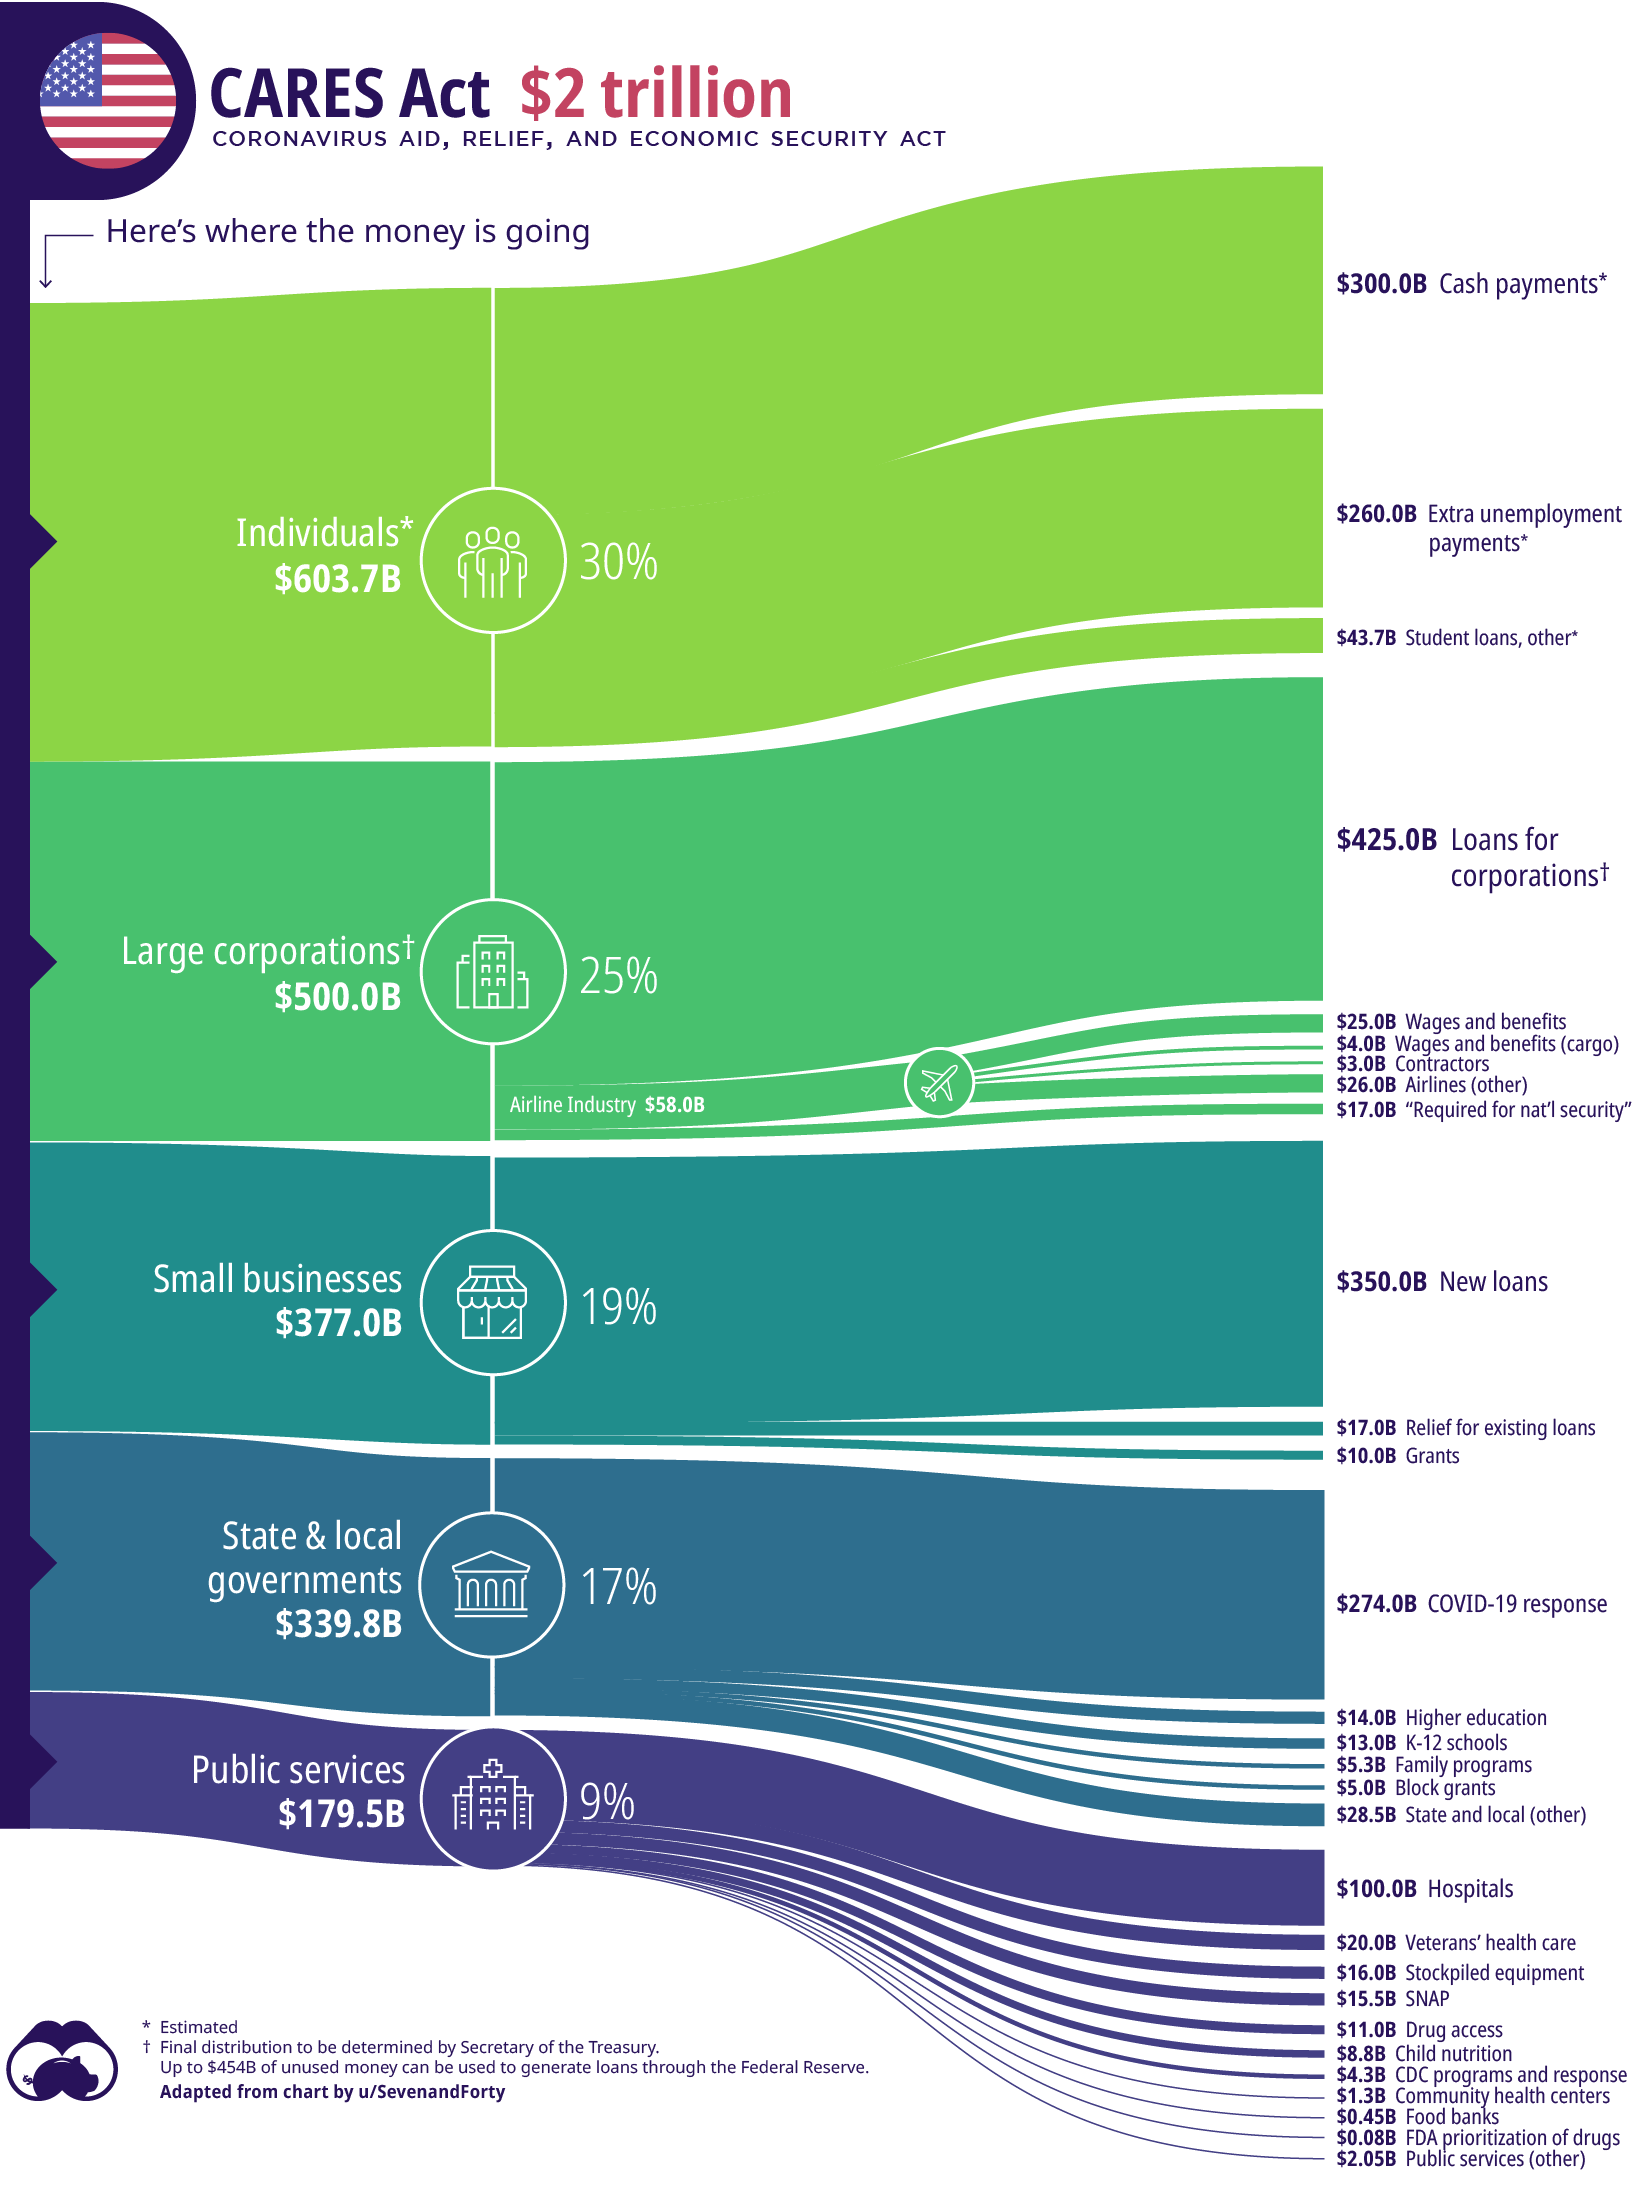
The relief package included $1,200 direct deposits to individuals, over $350 billion in relief for small businesses, and an excess of $100 billion for the U.S. health system.
Graphic #9 ⟩⟩ April 2020
Oil Prices Go Negative
In another historic event, oil prices went negative for the first time in history. Futures contracts for WTI oil fell to a stunning -$37.63 on April 20th, with producers actually paying traders to take oil off their hands.
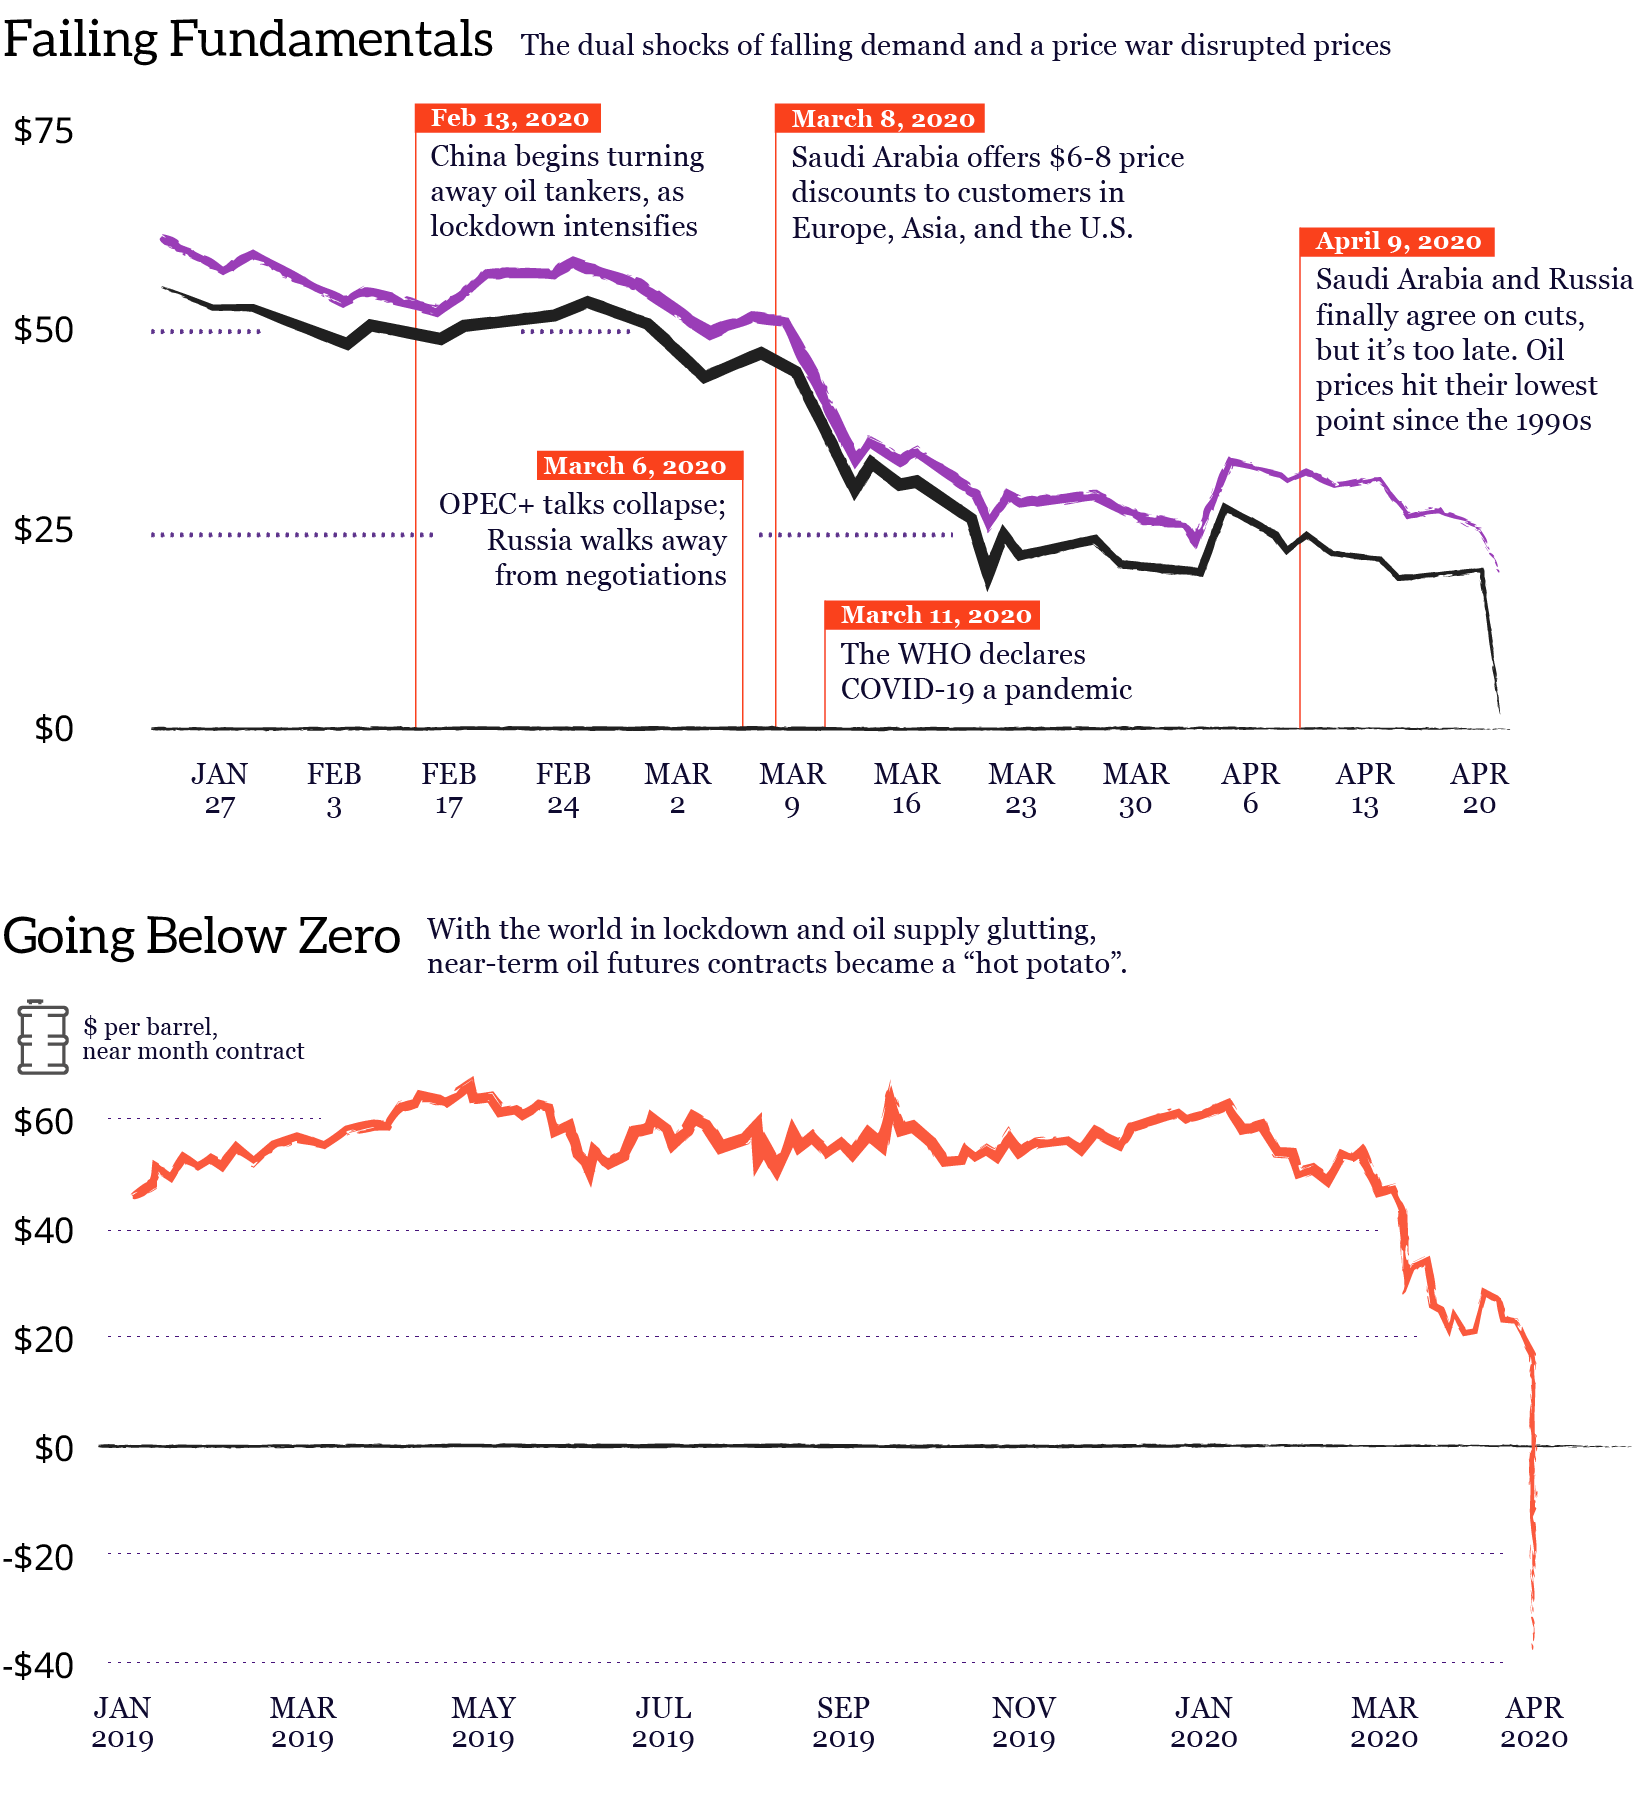
Oil has since recovered from this shock, cruising back to more typical price levels.
Graphic #10 ⟩⟩ May 2020
Black Lives Matter Protests
“I can’t breathe.” These few words sparked the ongoing flames of a significant movement this summer: Black Lives Matter (BLM).
After the killing of George Floyd on May 25, by police, the Armed Conflict Location & Event Data Project (ACLED) recorded over 7,750 BLM-linked demonstrations over a three month span.
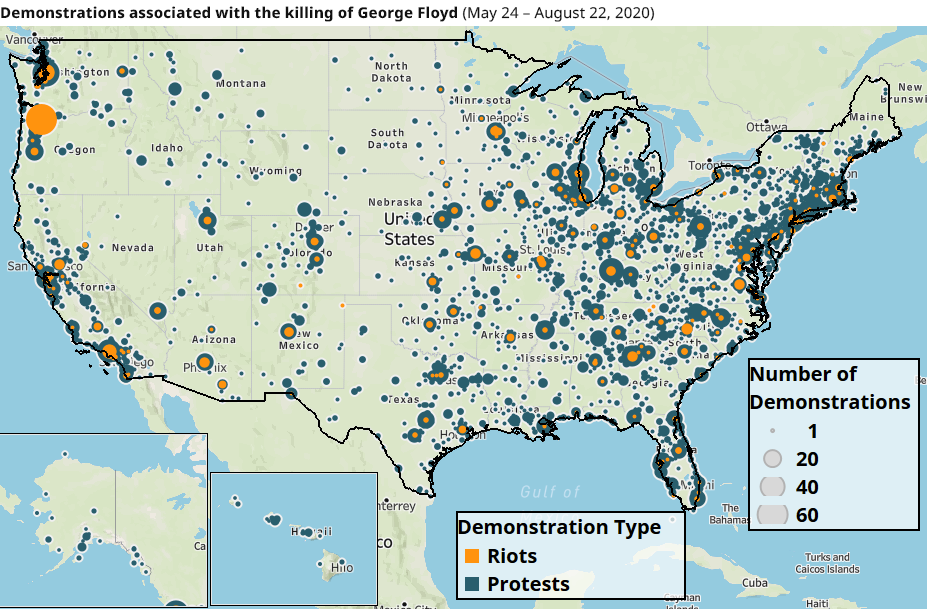
The nationwide pattern of civil unrest is well-documented, but there’s been no time like the present to demand change. Though images of burning cars and police clashes dominated the headlines, in the end, 93% of the protests were peaceful.
There’s also been a ripple effect, with thousands of similar rallies reported in countries around the world.
Graphic #11 & 12 ⟩⟩ May 2020
The World Works from Home
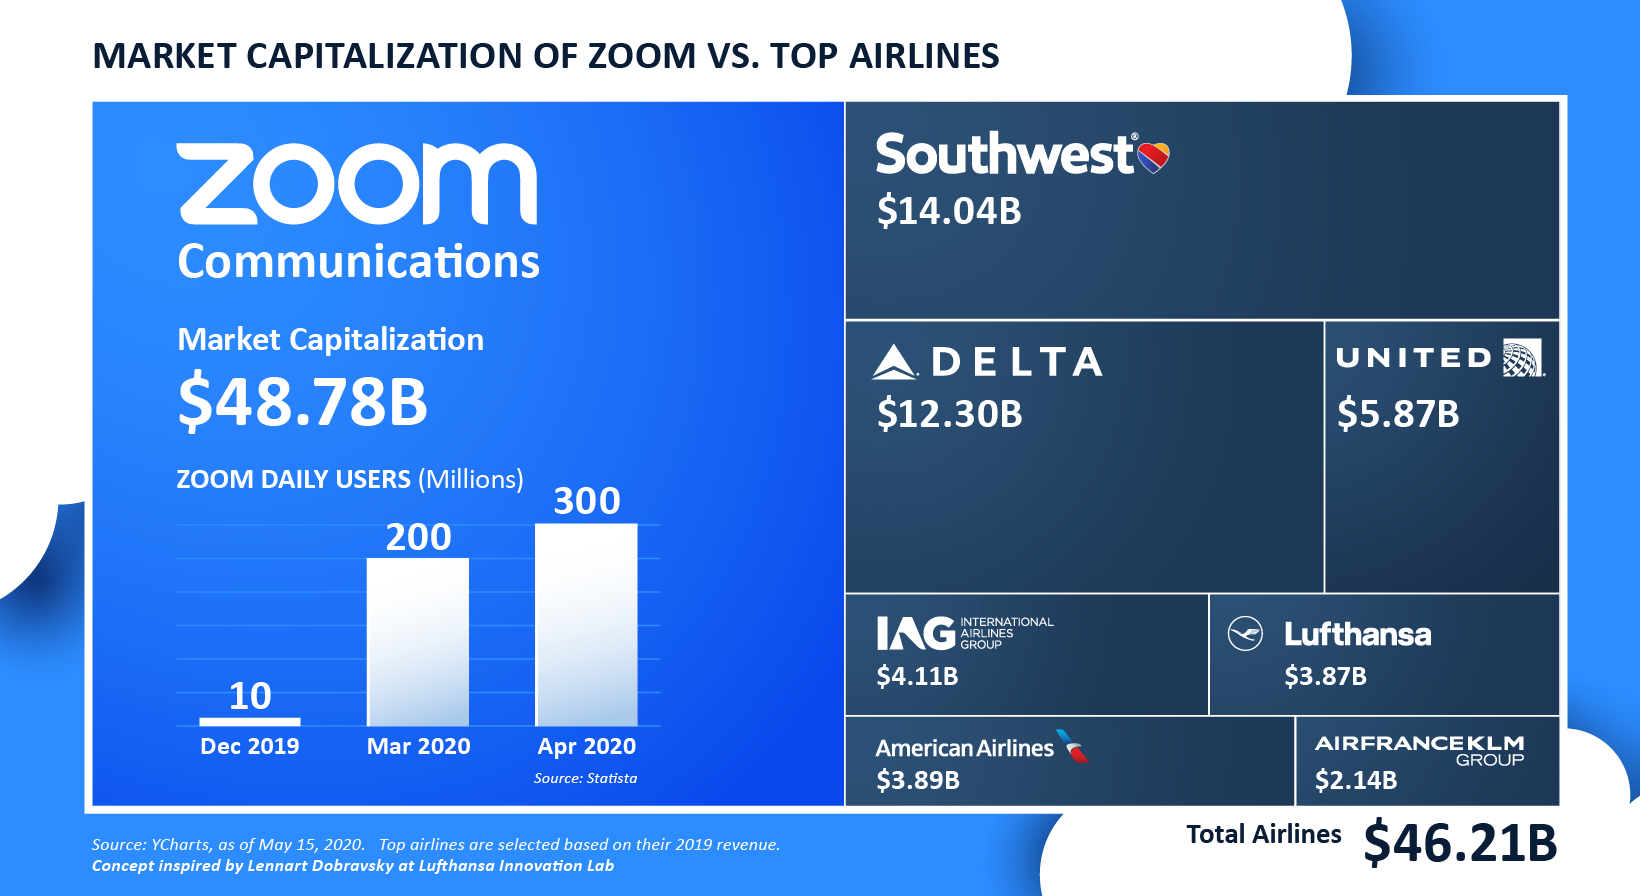
The dramatic shift to staying at home has resulted in a much higher reliance on technology for many people. Nowhere were these trends exemplified more than the rise of video conferencing software Zoom—the platform was used for work, education, and socializing alike.
As monthly users swelled, those who typically take to the skies also declined in a steep fashion. In this graphic from May, we noted that Zoom’s market capitalization had skyrocketed to eclipse the top seven airlines by revenue, combined.
As remote work became the new normal for significant shares of the workforce, unique benefits of this adjusted lifestyle arose, but it didn’t come without its challenges.
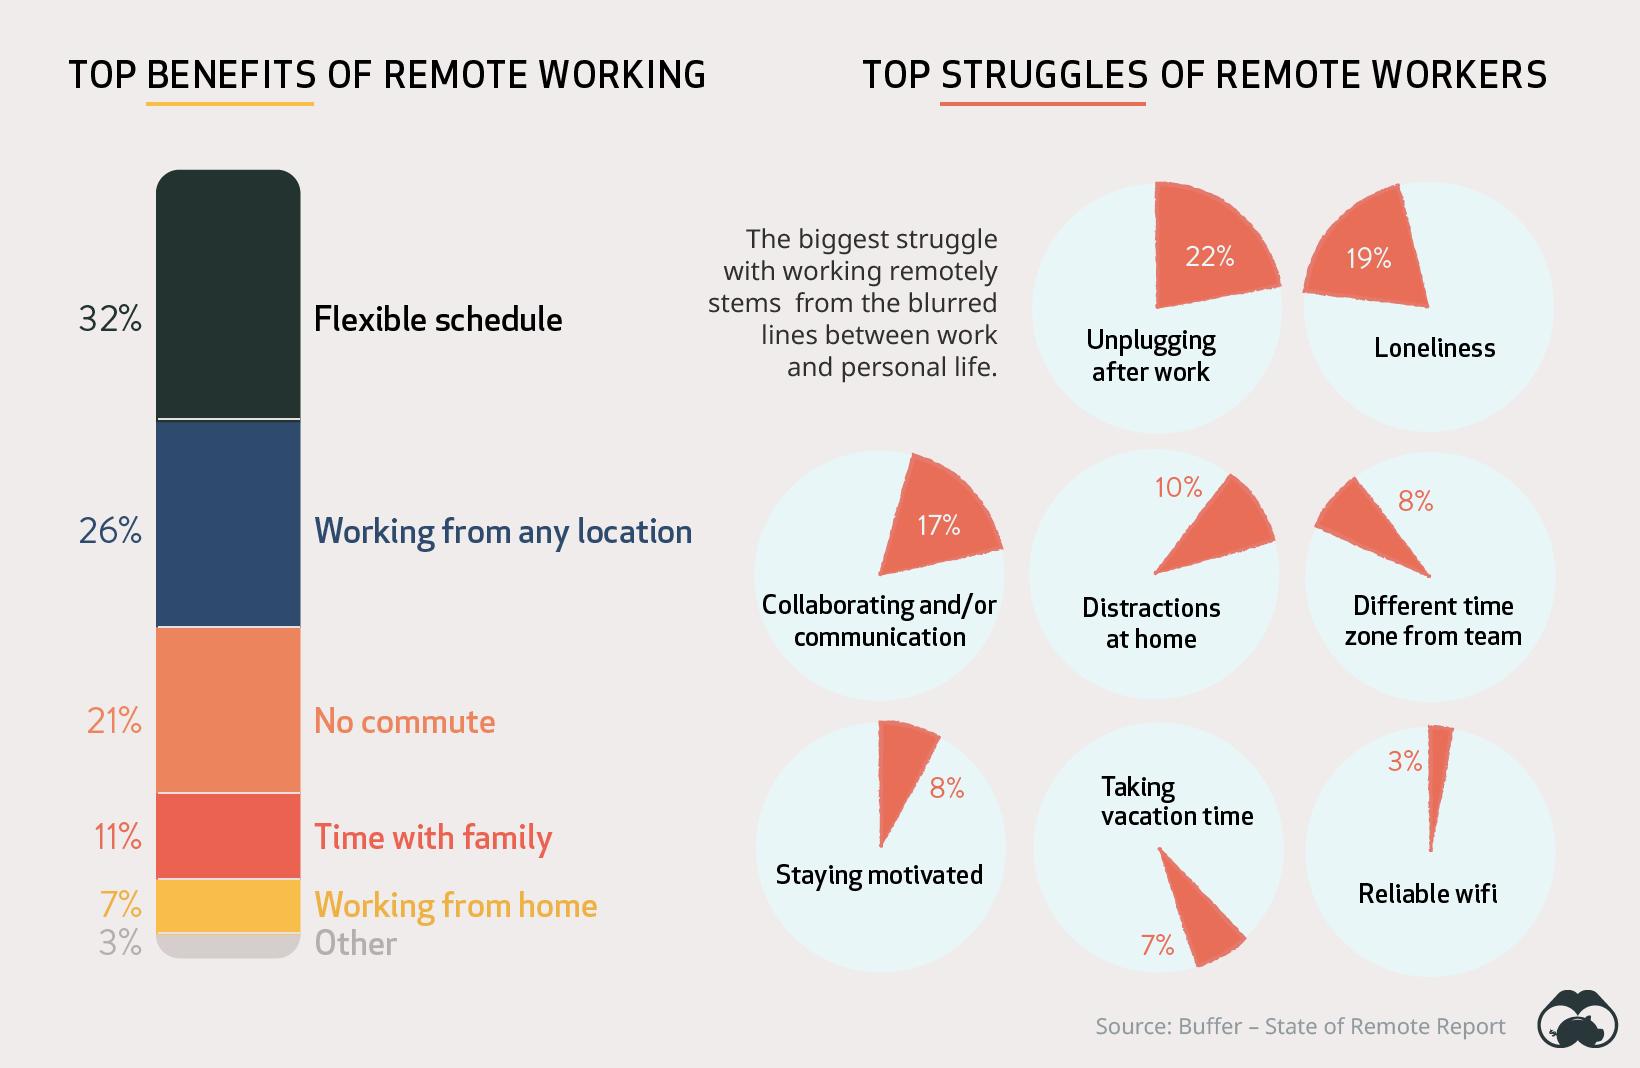
Perhaps the most significant lasting change from the COVID-19 pandemic might be the adoption of flexible work, even by firms that resisted the trend in the past.
If many employees continue to work remotely, even part of the time, then that will have a big impact on everything from the commercial office market to the bottom line of SaaS companies that help facilitate remote collaboration among teams.
Graphic #13 ⟩⟩ July 2020
Tesla becomes World’s Most Valuable Automaker
2020 was a hallmark year for Tesla. In June, it became the most valuable automaker in the world—surpassing the likes of Toyota, Volkswagen, and Honda.
Tesla’s market valuation climbed over 375% since June 2019. While these soaring figures are one factor behind its rise, others include record Model 3 sales, which prompted market euphoria.
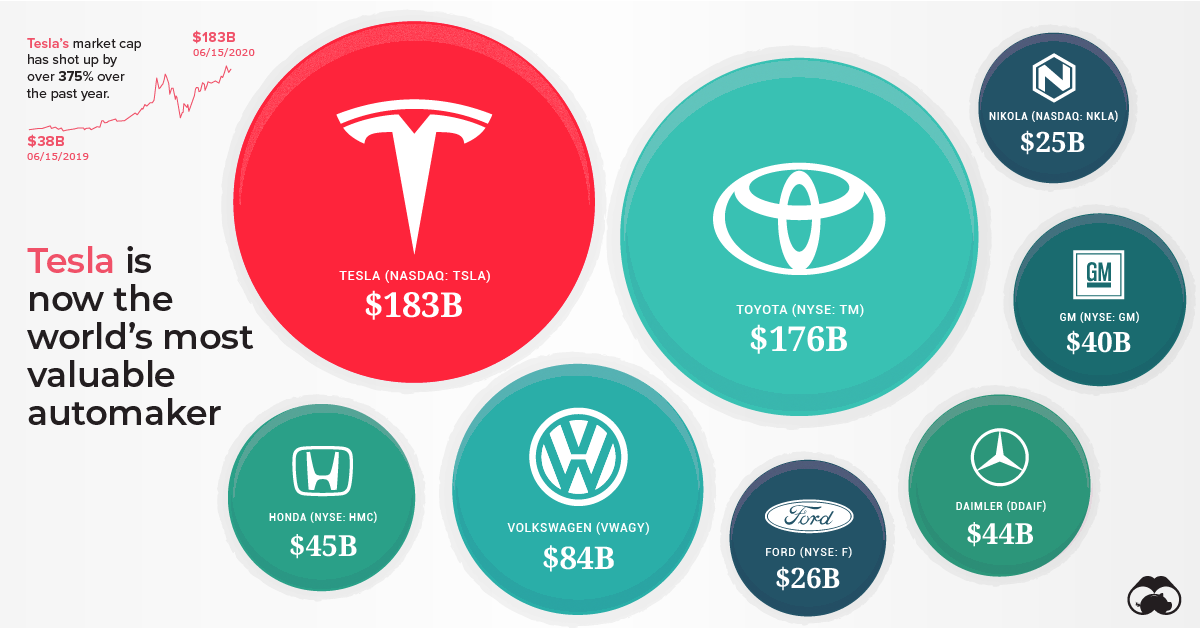
But Tesla’s story is far from over.
The company is now worth more than the largest nine automakers combined, and is set to enter the S&P 500 officially on December 21, 2020. Tesla will be the most valuable company to ever enter the index, ranking as the eighth-largest overall.
Graphic #14 ⟩⟩ July 2020
Big Tech’s Dominance
In many ways, COVID-19 only accentuated differences in market share, earnings, and wealth.
For one, Big Tech’s market cap share of the S&P 500 soared. In the seven years preceding July, the market cap of the six stocks—Facebook, Apple, Amazon, Netflix, Alphabet, and Microsoft—grew over 500%. By contrast, the S&P 500 rose just 110%.
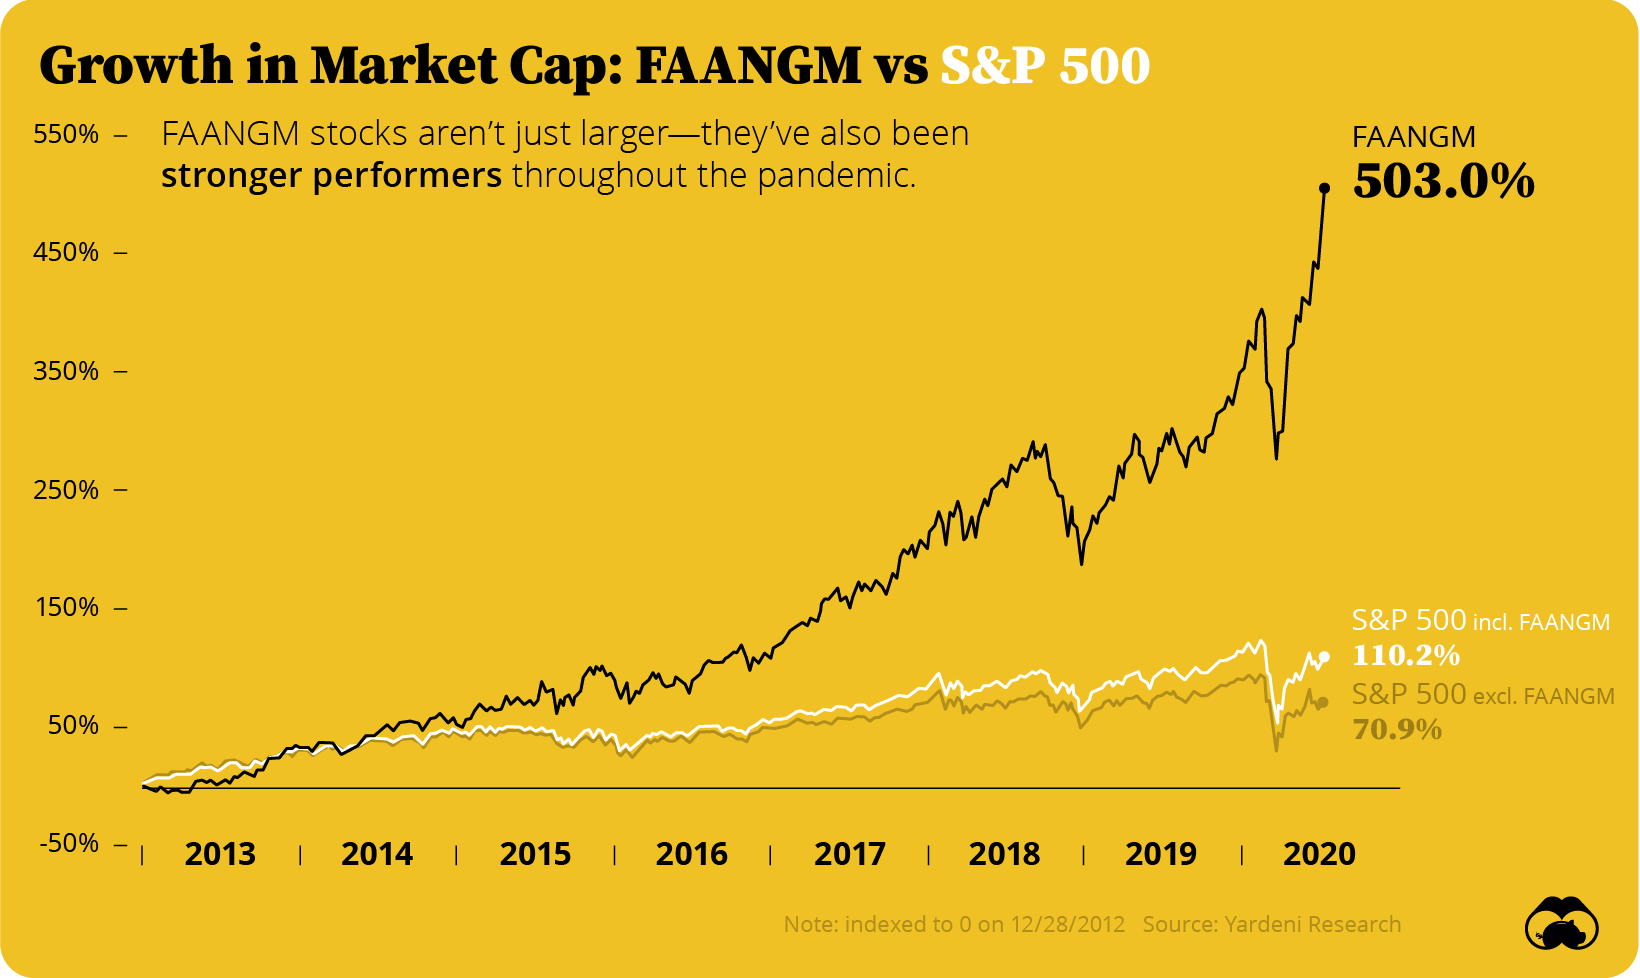
At the same time, Big Tech’s concentration reached record levels, with the five largest companies accounting for over 20% of the index’s total value.
Graphic #15 ⟩⟩ August 2020
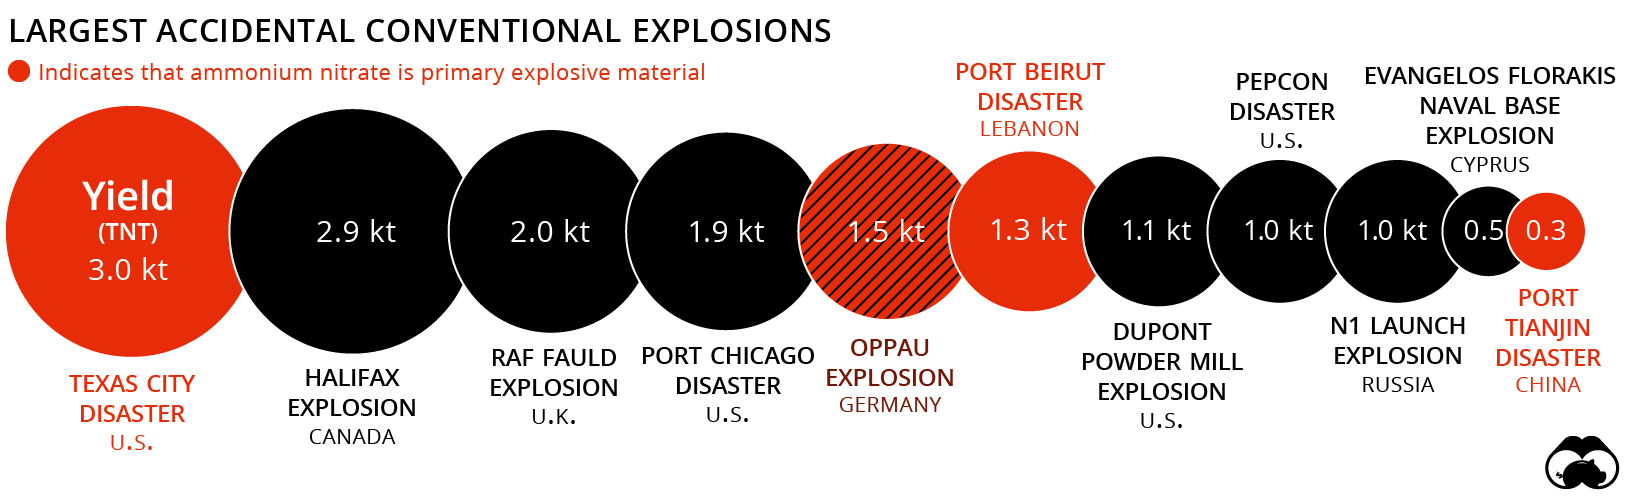
Beirut Explosion
While the world grappled with numerous biological and natural disasters, human-error led to a deadly explosion that rocked Beirut’s port. The blast was broadcast around the world in real time as people filmed the fire on their devices.
Using satellite data, NASA and NYT mapped the extent of the damage, which claimed 135 lives and affected 305,000 more.
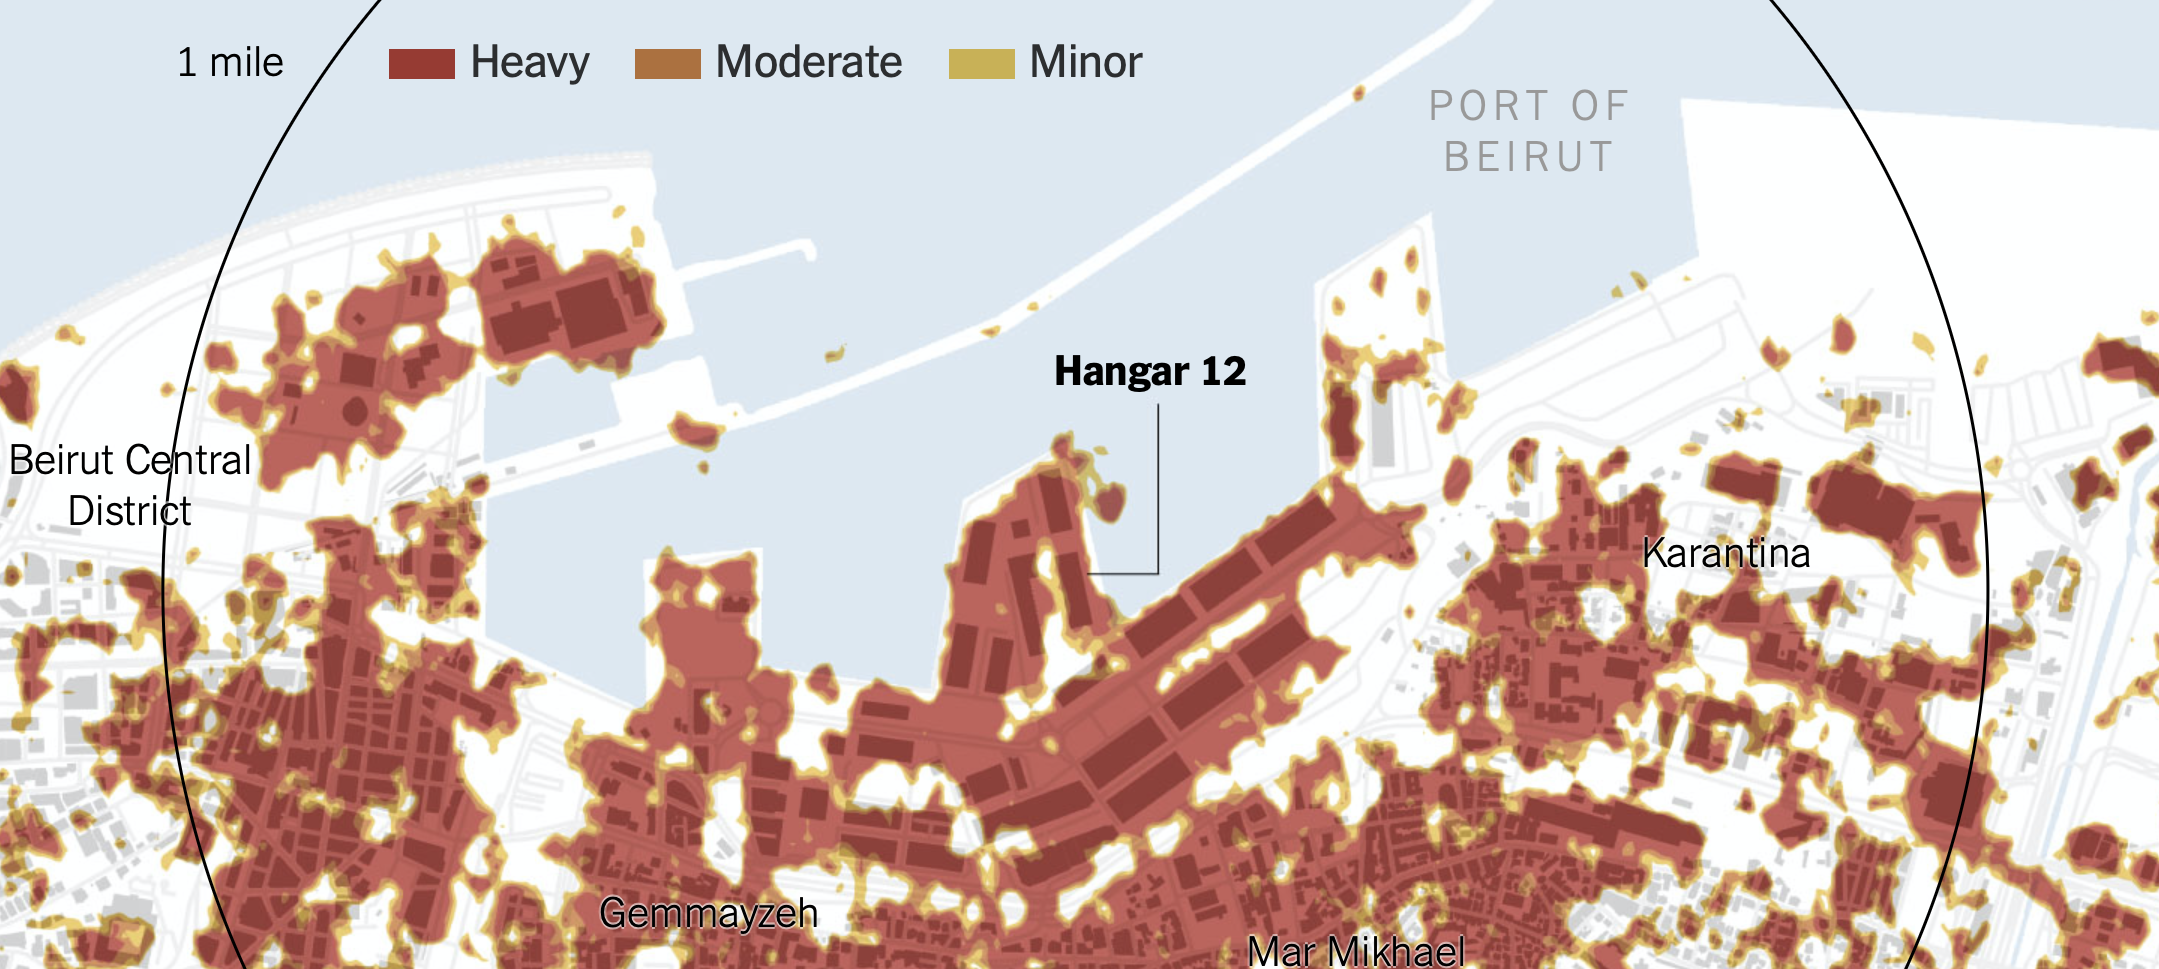
» See the full interactive explainer by NYT
This explosion was the biggest accident of its kind in modern history, triggered by the exposure of combustible ammonium nitrate—a key ingredient in fertilizers—to an open flame due to poor storage. Beyond the human toll, the financial cost of this explosion is estimated at above $15 billion.
Graphic #16 ⟩⟩ August 2020
Shortest Bear Market in History Ends
In a stunning reversal, the bear market of 2020 ended on August 18 when the S&P 500 exceeded previous February highs. As trillions of dollars in stimulus response got injected into global economies, markets recovered in record time.
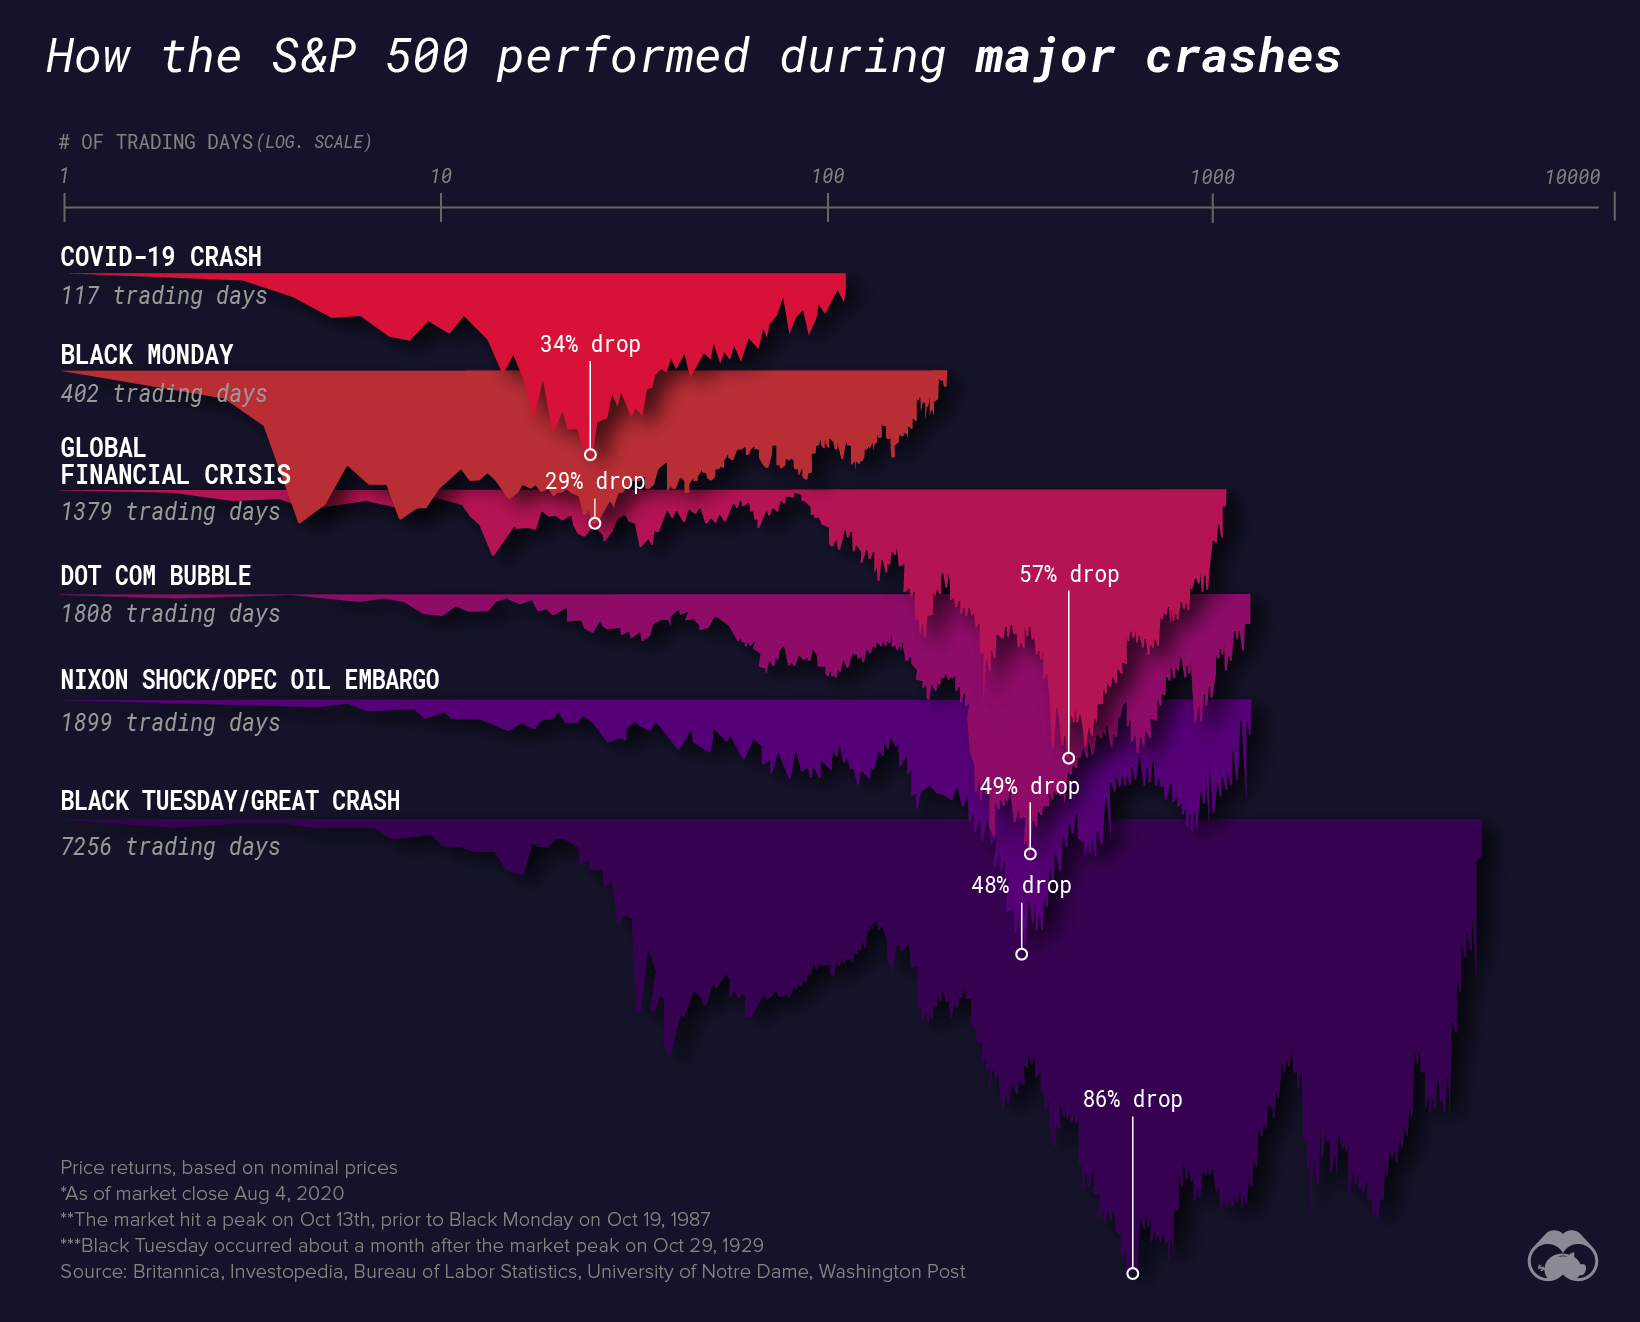
Just two weeks before the shortest bear market in history ended, we published a graphic comparing previous stock crashes—from 1987’s Black Monday to the Nixon Shock of 1973—exposing the duration and intensity of market downturns since 1929.
Graphic #17 ⟩⟩ August 2020
U.S. Wildfire Season
Reddish-orange skies might seem otherworldly, but this fall, they were a common sight across the West Coast of North America, where air quality reached the “hazardous” category for long stretches of time.
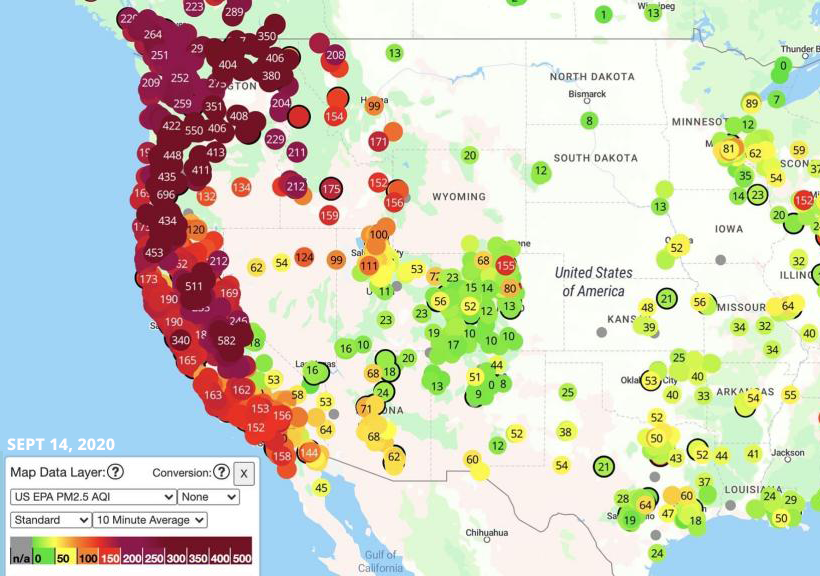
2020 was the most active year on record for wildfires yet, with California and Oregon being particularly hard-hit. While some wildfires are caused by natural occurrences like lightning strikes, an overwhelming majority (85-90%) happen because of human causes such as discarded cigarettes and campfire debris.
This is an unprecedented event. We now have the largest wildfire in [California’s] history, as well as the third largest and the fourth largest and five of the Top 10.
– Noah Diffenbaugh, professor and senior fellow at Stanford University
Graphic #18 ⟩⟩ November 2020
The 2020 U.S. Presidential Election
In 2020, U.S. election spending hit over $13 billion, more than twice the amount spent on the entire 2016 election.
Of this total, congressional spending topped $7 billion, with Democrats spending 64% more than Republican candidates for the House and Senate.
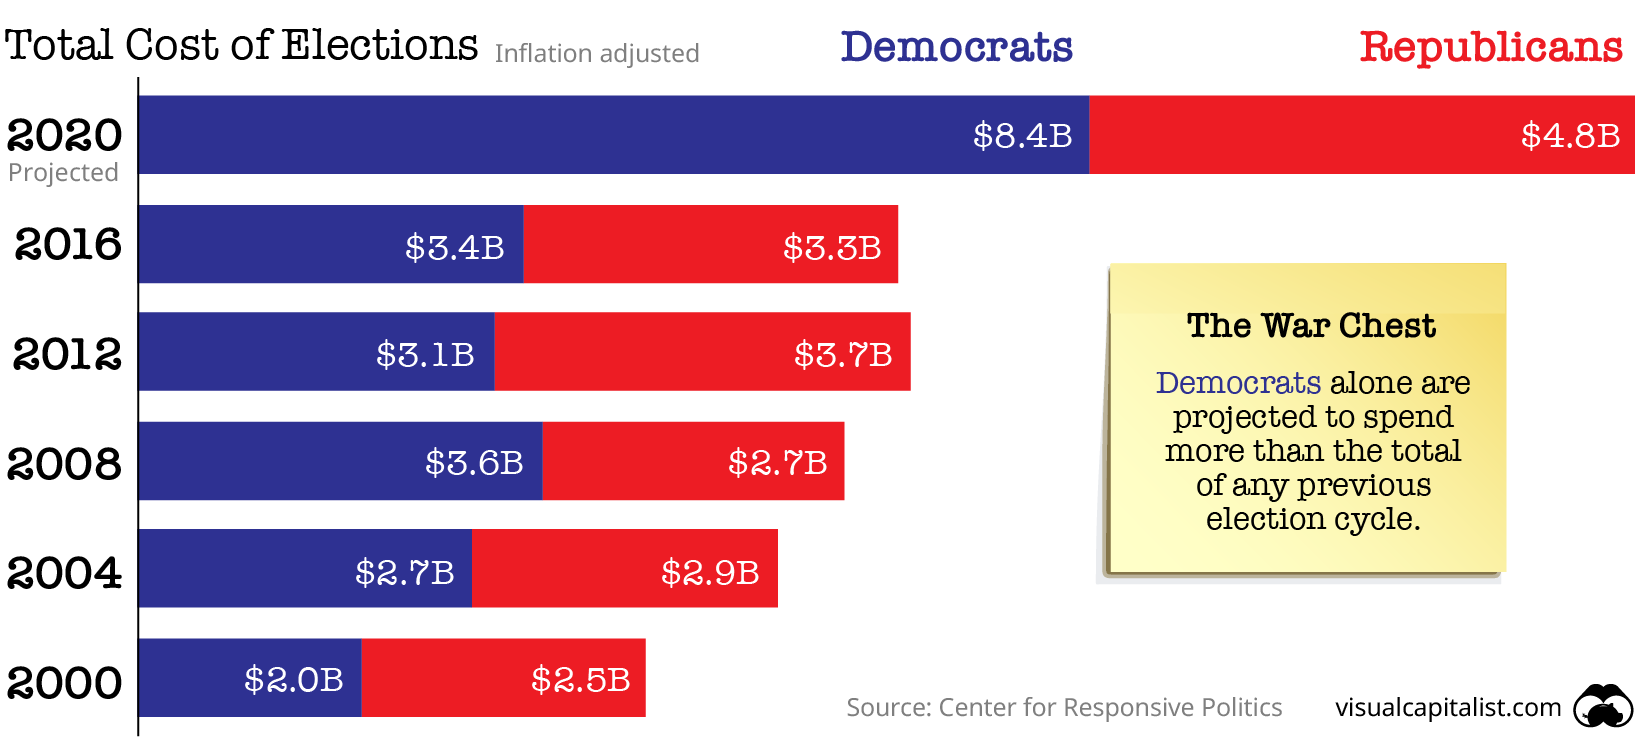
President Biden was the first candidate ever to raise $1 billion, while Trump raised $596 million.
Graphic #19 ⟩⟩ December 2020
COVID-19’s Third Wave
Like history tells us, pandemics come in waves. The third wave of COVID-19 escalated in November, when cases began to surge.
On November 8, the seven-day average of new daily cases hit 100,000 in America. By the end of November, global cases soared to 60 million. Since then, cases have trended upward, leading local governments worldwide to enforce social distancing requirements for the winter holiday season.
The below graphic from Reddit helps show the latest surge in cases in the U.S.:
Graphic #20 ⟩⟩ December 2020
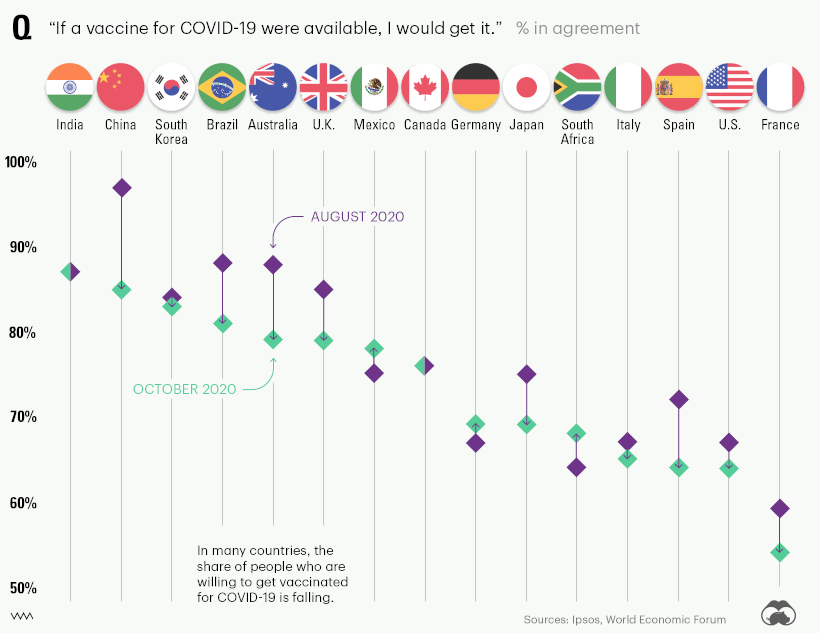
Global Vaccination Effort Kicks Off
In more recent news, Pfizer made waves when it announced it was rolling out a 95% effective COVID-19 vaccine. Then followed Moderna, at 94.5% in mid-November. As the global vaccination race intensifies, Bloomberg tracks the progress of nine vaccines and 80 publicly disclosed distribution deals representing 7.95 billion vaccination doses.
However, even with viable vaccines, challenges still exist. All around the world, perceptions of vaccine safety have dropped significantly, which may complicate an economic recovery.
On to the Next One
After the wild ride that was 2020, many people are wondering what 2021 will have in store.
In the first half of the year, vaccine distribution will surely take center stage. As well, economic recovery will be in focus as physical businesses resume more typical activity and regions slowly open up travel and tourism again.
Much like the financial crisis of 2008 was an inflection point for the economy, the COVID-19 pandemic has changed the course of human history. Chaos can breed opportunity, and even though unemployment spiked to record highs in the U.S., new business applications did as well.
Will things return to “normal”? As the many twists and turns of the past year have demonstrated, our complex, interconnected world is far from static. The next black swan is always just around the corner.


Healthcare
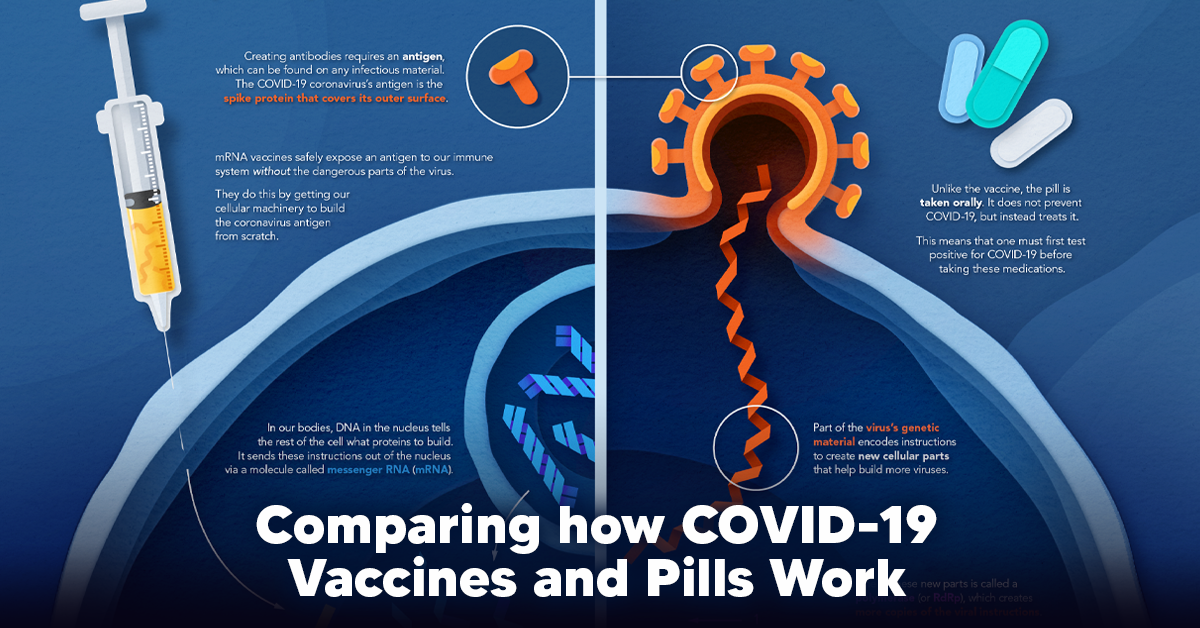
Visualizing How COVID-19 Antiviral Pills and Vaccines Work at the Cellular Level
Despite tackling the same disease, vaccines and antiviral pills work differently to combat COVID-19. We visualize how they work in the body.
Current Strategies to Tackle COVID-19
Since the pandemic started in 2020, a number of therapies have been developed to combat COVID-19.
The leading options for preventing infection include social distancing, mask-wearing, and vaccination. They are still recommended during the upsurge of the coronavirus’s latest mutation, the Omicron variant.
But in December 2021, The United States Food and Drug Administration (USDA) granted Emergency Use Authorization to two experimental pills for the treatment of new COVID-19 cases.
These medications, one made by Pfizer and the other by Merck & Co., hope to contribute to the fight against the coronavirus and its variants. Alongside vaccinations, they may help to curb extreme cases of COVID-19 by reducing the need for hospitalization.
Despite tackling the same disease, vaccines and pills work differently:
| Vaccines | Pills |
|---|---|
| Taken by injection | Taken by mouth |
| Used for prevention | Used for treatment only |
| Create an enhanced immune system by stimulating antibody production | Disrupt the assembly of new viral particles |
How a Vaccine Helps Prevent COVID-19
The main purpose of a vaccine is to prewarn the body of a potential COVID-19 infection by creating antibodies that target and destroy the coronavirus.
In order to do this, the immune system needs an antigen.
It’s difficult to do this risk-free since all antigens exist directly on a virus. Luckily, vaccines safely expose antigens to our immune systems without the dangerous parts of the virus.
In the case of COVID-19, the coronavirus’s antigen is the spike protein that covers its outer surface. Vaccines inject antigen-building instructions* and use our own cellular machinery to build the coronavirus antigen from scratch.
When exposed to the spike protein, the immune system begins to assemble antigen-specific antibodies. These antibodies wait for the opportunity to attack the real spike protein when a coronavirus enters the body. Since antibodies decrease over time, booster immunizations help to maintain a strong line of defense.
*While different vaccine technologies exist, they all do a similar thing: introduce an antigen and build a stronger immune system.
How COVID Antiviral Pills Work
Antiviral pills, unlike vaccines, are not a preventative strategy. Instead, they treat an infected individual experiencing symptoms from the virus.
Two drugs are now entering the market. Merck & Co.’s Lagevrio®, composed of one molecule, and Pfizer’s Paxlovid®, composed of two.
These medications disrupt specific processes in the viral assembly line to choke the virus’s ability to replicate.
The Mechanism of Molnupiravir
RNA-dependent RNA Polymerase (RdRp) is a cellular component that works similar to a photocopying machine for the virus’s genetic instructions. An infected host cell is forced to produce RdRp, which starts generating more copies of the virus’s RNA.
Molnupiravir, developed by Merck & Co., is a polymerase inhibitor. It inserts itself into the viral instructions that RdRp is copying, jumbling the contents. The RdRp then produces junk.
The Mechanism of Nirmatrelvir + Ritonavir
A replicating virus makes proteins necessary for its survival in a large, clumped mass called a polyprotein. A cellular component called a protease cuts a virus’s polyprotein into smaller, workable pieces.
Pfizer’s antiviral medication is a protease inhibitor made of two pills:
- The first pill, nirmatrelvir, stops protease from cutting viral products into smaller pieces.
- The second pill, ritonavir, protects nirmatrelvir from destruction by the body and allows it to keep working.
With a faulty polymerase or a large, unusable polyprotein, antiviral medications make it difficult for the coronavirus to replicate. If treated early enough, they can lessen the virus’s impact on the body.
The Future of COVID Antiviral Pills and Medications
Antiviral medications seem to have a bright future ahead of them.
COVID-19 antivirals are based on early research done on coronaviruses from the 2002-04 SARS-CoV and the 2012 MERS-CoV outbreaks. Current breakthroughs in this technology may pave the way for better pharmaceuticals in the future.
One half of Pfizer’s medication, ritonavir, currently treats many other viruses including HIV/AIDS.
Gilead Science is currently developing oral derivatives of remdesivir, another polymerase inhibitor currently only offered to inpatients in the United States.
More coronavirus antivirals are currently in the pipeline, offering a glimpse of control on the looming presence of COVID-19.
Author’s Note: The medical information in this article is an information resource only, and is not to be used or relied on for any diagnostic or treatment purposes. Please talk to your doctor before undergoing any treatment for COVID-19. If you become sick and believe you may have symptoms of COVID-19, please follow the CDC guidelines.

-

 Education1 week ago
How Hard Is It to Get Into an Ivy League School?
-

 Technology2 weeks ago
Ranked: Semiconductor Companies by Industry Revenue Share
-

 Markets2 weeks ago
Ranked: The World’s Top Flight Routes, by Revenue
-

 Demographics2 weeks ago
Population Projections: The World’s 6 Largest Countries in 2075
-

 Markets2 weeks ago
The Top 10 States by Real GDP Growth in 2023
-

 Demographics2 weeks ago
The Smallest Gender Wage Gaps in OECD Countries
-

 Economy2 weeks ago
Where U.S. Inflation Hit the Hardest in March 2024
-

 Green2 weeks ago
Top Countries By Forest Growth Since 2001