Chart of the Week
Global Shutdown: Visualizing Commuter Activity in the World’s Cities
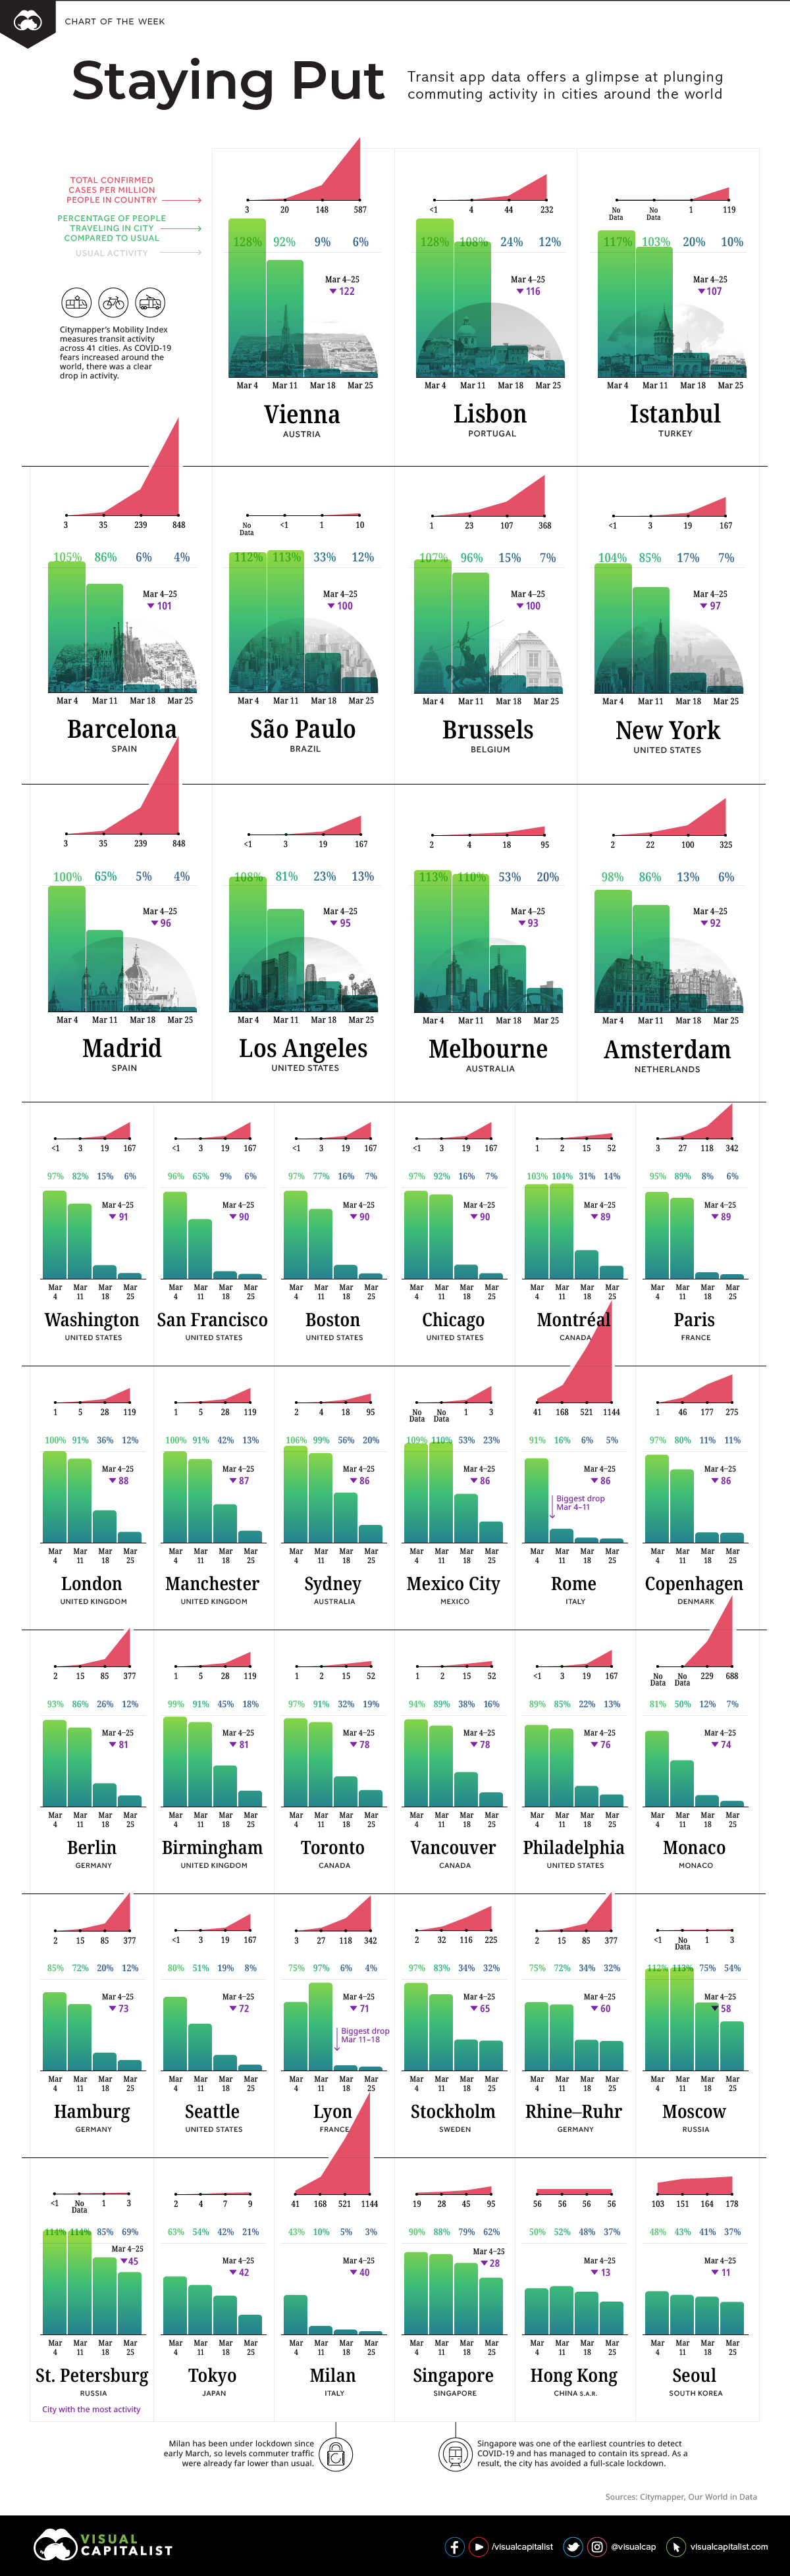
Staying Put: The COVID-19 Commuter Decline
Every day, millions of people worldwide rely on public transport networks to get around. But in times of crisis, bustling cities with high volumes of commuter traffic can come to a dramatic halt.
Today’s chart breaks down daily data from Citymapper’s Mobility Index, according to trips planned on the transport app across 41 select cities.
The results paint a unique picture of how social distancing and lockdown measures are impacting commuter and economic activity in major urban hubs.
Cities With the Biggest Drops in Activity
As the government response to the COVID-19 pandemic intensifies and people are urged to stay home, transit activity is dropping everywhere.
However, some areas are seeing more of a reduction in activity than others. Where has activity declined the most over the month?
| Rank | City | Country | 04-Mar | 11-Mar | 18-Mar | 25-Mar | Total Change (%) |
|---|---|---|---|---|---|---|---|
| #1 | Vienna | 🇦🇹 Austria | 128% | 92% | 9% | 6% | -122% |
| #2 | Lisbon | 🇵🇹 Portugal | 128% | 108% | 24% | 12% | -116% |
| #3 | Istanbul | 🇹🇷 Turkey | 117% | 103% | 20% | 10% | -107% |
| #4 | Barcelona | 🇪🇸 Spain | 105% | 86% | 6% | 4% | -101% |
| #5 | Brussels | 🇧🇪 Belgium | 107% | 96% | 15% | 7% | -100% |
| #6 | São Paolo | 🇧🇷 Brazil | 112% | 113% | 33% | 12% | -100% |
| #7 | New York City | 🇺🇸 USA | 104% | 85% | 17% | 7% | -97% |
| #8 | Madrid | 🇪🇸 Spain | 100% | 65% | 5% | 4% | -96% |
| #9 | Los Angeles | 🇺🇸 USA | 108% | 81% | 23% | 13% | -95% |
| #10 | Melbourne | 🇦🇺 Australia | 113% | 110% | 53% | 20% | -93% |
*Note: Data measures the % of city moving compared to 100% baseline.
Overall, Vienna and Lisbon are the cities with the biggest average drop in commuter activity over the past few weeks. This decline in mobility is correlated with a spike in the proportion of COVID-19 cases in the population:
- Austria
March 4: 2.6 per million
March 25: 586 per million - Portugal
March 4: 0.4 per million
March 25: 232 per million
That said, not every city is seeing a precipitous decline in activity — let’s look at those next.
Standing Still, or On Guard
Cities that saw lower decreases in commuter activity over recent weeks can generally be slotted into three categories:
- Cities that were already on or near shutdown (Seoul, Milan)
- Cities that have so far avoided major impacts from the virus (St. Petersburg)
- Cities that successfully mitigated spread (Singapore)
Here are the 10 cities on the list that saw the lowest changes in activity:
| Rank | City | Country | 04-Mar | 11-Mar | 18-Mar | 25-Mar | Total Change (%) |
|---|---|---|---|---|---|---|---|
| #1 | Seoul | 🇰🇷 South Korea | 48% | 43% | 41% | 37% | -11% |
| #2 | Hong Kong | 🇭🇰 China (SAR) | 50% | 52% | 48% | 37% | -13% |
| #3 | Singapore | 🇸🇬 Singapore | 90% | 88% | 79% | 62% | -28% |
| #4 | Milan | 🇮🇹 Italy | 43% | 10% | 5% | 3% | -40% |
| #5 | Tokyo | 🇯🇵 Japan | 63% | 54% | 42% | 21% | -42% |
| #6 | St Petersburg | 🇷🇺 Russia | 114% | 114% | 85% | 69% | -45% |
| #7 | Moscow | 🇷🇺 Russia | 112% | 113% | 75% | 54% | -58% |
| #8 | Rhine-Ruhr | 🇩🇪 Germany | 75% | 72% | 28% | 15% | -60% |
| #9 | Stockholm | 🇸🇪 Sweden | 97% | 83% | 34% | 32% | -65% |
| #10 | Lyon | 🇫🇷 France | 75% | 97% | 6% | 4% | -71% |
*Note: Data measures the % of city moving compared to 100% baseline.
St. Petersburg is still seeing commuter activity at 69% of normal levels as of March 25th, as the proportion of confirmed COVID-19 cases in Russia remains low, at roughly 3.4 per million.
Milan has the lowest activity of any city at 3%, and has been in shutdown for most of the month.
Although Singapore’s total COVID-19 cases grew from 18.8 to 95.4 per million, it still has 62% commuter activity. Interestingly, Singapore is one of the few countries that has been able to properly control and manage its COVID-19 outbreak.
Biggest Weekly Declines
As the month progressed, various cities showed stark one-week declines in commuter activity based on official healthcare recommendations and growing case numbers.
After a government lockdown announced on March 9, Rome experienced the sharpest decline of -75% commuter activity in the week from March 4 to March 11. Currently, there is only 5% activity compared to usual, similar to Milan.
In the second week of March, COVID-19 cases in France jumped fourfold, from 27.3 per million to 118.4 per million people. As a result, Lyon saw a whopping -91% drop in commuter activity—going from 97% on March 11 to 6% on March 18.
Over the past week, as cases in Australia reached 95 per million, Sydney and Melbourne exhibited the highest average declines at -36% and -33% in commuter activity respectively.
Full List of 41 Cities
Here’s the full list of cities, courtesy of Citymapper.
| City, Country | March 4 | March 11 | March 18 | March 25 | Total Change (%) |
|---|---|---|---|---|---|
| Vienna, Austria | 128% | 92% | 9% | 6% | -122% |
| Lisbon, Portugal | 128% | 108% | 24% | 12% | -116% |
| Istanbul, Turkey | 117% | 103% | 20% | 10% | -107% |
| Barcelona, Spain | 105% | 86% | 6% | 4% | -101% |
| Brussels, Belgium | 107% | 96% | 15% | 7% | -100% |
| São Paulo, Brazil | 112% | 113% | 33% | 12% | -100% |
| New York City, U.S. | 104% | 85% | 17% | 7% | -97% |
| Madrid, Spain | 100% | 65% | 5% | 4% | -96% |
| Los Angeles, U.S. | 108% | 81% | 23% | 13% | -95% |
| Melbourne, Australia | 113% | 110% | 53% | 20% | -93% |
| Amsterdam, Netherlands | 98% | 86% | 13% | 6% | -92% |
| Washington DC, U.S. | 97% | 82% | 15% | 6% | -91% |
| San Francisco, U.S. | 96% | 65% | 9% | 6% | -90% |
| Boston, U.S. | 97% | 77% | 16% | 7% | -90% |
| Chicago, U.S. | 97% | 92% | 16% | 7% | -90% |
| Montréal, Canada | 103% | 104% | 31% | 14% | -89% |
| Paris, France | 95% | 89% | 8% | 6% | -89% |
| London, UK | 100% | 91% | 36% | 12% | -88% |
| Manchester, UK | 100% | 91% | 42% | 13% | -87% |
| Sydney, Australia | 106% | 99% | 56% | 20% | -86% |
| Mexico City, Mexico | 109% | 110% | 53% | 23% | -86% |
| Rome, Italy | 91% | 16% | 6% | 5% | -86% |
| Copenhagen, Denmark | 97% | 80% | 11% | 11% | -86% |
| Berlin, Germany | 93% | 86% | 26% | 12% | -81% |
| Birmingham, UK | 99% | 91% | 45% | 18% | -81% |
| Toronto, Canada | 97% | 91% | 32% | 19% | -78% |
| Vancouver, Canada | 94% | 89% | 38% | 16% | -78% |
| Philadelphia, U.S. | 89% | 85% | 22% | 13% | -76% |
| Monaco, Monaco | 81% | 50% | 12% | 7% | -74% |
| Hamburg, Germany | 85% | 72% | 20% | 12% | -73% |
| Seattle, U.S. | 80% | 51% | 19% | 8% | -72% |
| Lyon, France | 75% | 97% | 6% | 4% | -71% |
| Stockholm, Sweden | 97% | 83% | 34% | 32% | -65% |
| Rhine-Ruhr, Germany | 75% | 72% | 28% | 15% | -60% |
| Moscow, Russia | 112% | 113% | 75% | 54% | -58% |
| St Petersburg, Russia | 114% | 114% | 85% | 69% | -45% |
| Tokyo, Japan | 63% | 54% | 42% | 21% | -42% |
| Milan, Italy | 43% | 10% | 5% | 3% | -40% |
| Singapore, Singapore | 90% | 88% | 79% | 62% | -28% |
| Hong Kong, Hong Kong | 50% | 52% | 48% | 37% | -13% |
| Seoul, South Korea | 48% | 43% | 41% | 37% | -11% |
*Note: Data measures the % of city moving compared to 100% baseline.
The COVID-19 pandemic is affecting everything from the stock market to the environment. With cities actively working to keep populations in isolation and healthy during this time, it may take a while before commuter activity returns to normal.
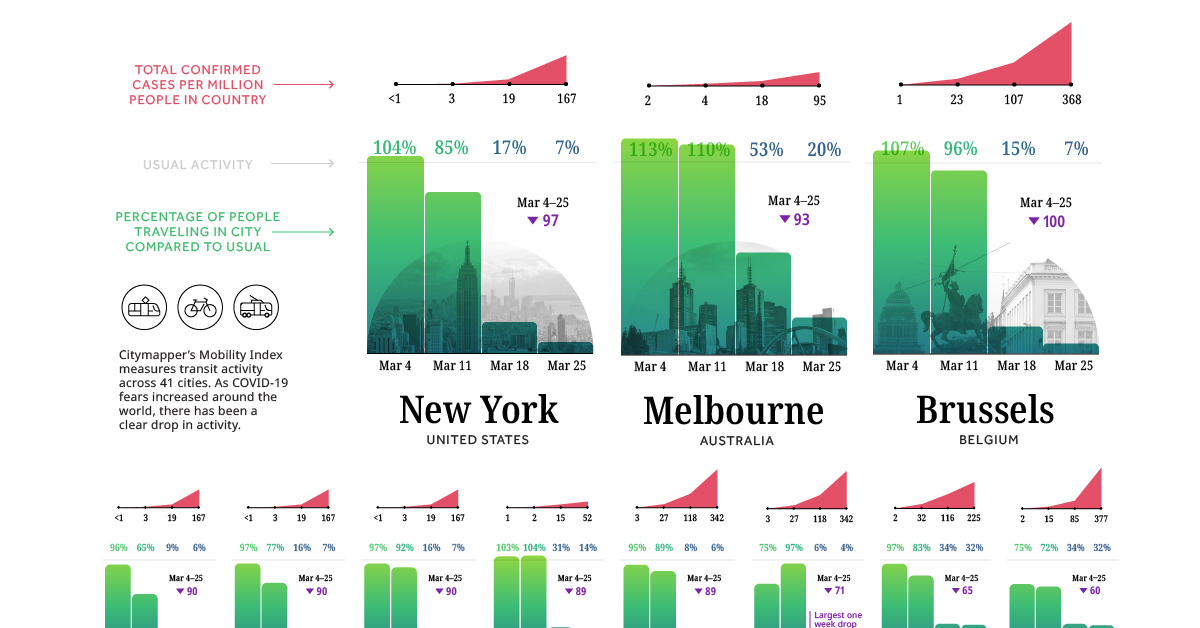


Chart of the Week
The Road to Recovery: Which Economies are Reopening?
We look at mobility rates as well as COVID-19 recovery rates for 41 economies, to see which countries are reopening for business.

The Road to Recovery: Which Economies are Reopening?
COVID-19 has brought the world to a halt—but after months of uncertainty, it seems that the situation is slowly taking a turn for the better.
Today’s chart measures the extent to which 41 major economies are reopening, by plotting two metrics for each country: the mobility rate and the COVID-19 recovery rate:
- Mobility Index
This refers to the change in activity around workplaces, subtracting activity around residences, measured as a percentage deviation from the baseline. - COVID-19 Recovery Rate
The number of recovered cases in a country is measured as the percentage of total cases.
Data for the first measure comes from Google’s COVID-19 Community Mobility Reports, which relies on aggregated, anonymous location history data from individuals. Note that China does not show up in the graphic as the government bans Google services.
COVID-19 recovery rates rely on values from CoronaTracker, using aggregated information from multiple global and governmental databases such as WHO and CDC.
Reopening Economies, One Step at a Time
In general, the higher the mobility rate, the more economic activity this signifies. In most cases, mobility rate also correlates with a higher rate of recovered people in the population.
Here’s how these countries fare based on the above metrics.
| Country | Mobility Rate | Recovery Rate | Total Cases | Total Recovered |
|---|---|---|---|---|
| Argentina | -56% | 31.40% | 14,702 | 4,617 |
| Australia | -41% | 92.03% | 7,150 | 6,580 |
| Austria | -100% | 91.93% | 16,628 | 15,286 |
| Belgium | -105% | 26.92% | 57,849 | 15,572 |
| Brazil | -48% | 44.02% | 438,812 | 193,181 |
| Canada | -67% | 52.91% | 88,512 | 46,831 |
| Chile | -110% | 41.58% | 86,943 | 36,150 |
| Colombia | -73% | 26.28% | 25,366 | 6,665 |
| Czechia | -29% | 70.68% | 9,140 | 6,460 |
| Denmark | -93% | 88.43% | 11,512 | 10,180 |
| Finland | -93% | 81.57% | 6,743 | 5,500 |
| France | -100% | 36.08% | 186,238 | 67,191 |
| Germany | -99% | 89.45% | 182,452 | 163,200 |
| Greece | -32% | 47.28% | 2,906 | 1,374 |
| Hong Kong | -10% | 97.00% | 1,067 | 1,035 |
| Hungary | -49% | 52.31% | 3,816 | 1,996 |
| India | -65% | 42.88% | 165,386 | 70,920 |
| Indonesia | -77% | 25.43% | 24,538 | 6,240 |
| Ireland | -79% | 88.92% | 24,841 | 22,089 |
| Israel | -31% | 87.00% | 16,872 | 14,679 |
| Italy | -52% | 64.99% | 231,732 | 150,604 |
| Japan | -33% | 84.80% | 16,683 | 14,147 |
| Malaysia | -53% | 80.86% | 7,629 | 6,169 |
| Mexico | -69% | 69.70% | 78,023 | 54,383 |
| Netherlands | -97% | 0.01% | 45,950 | 3 |
| New Zealand | -21% | 98.01% | 1,504 | 1,474 |
| Norway | -100% | 91.87% | 8,411 | 7,727 |
| Philippines | -87% | 23.08% | 15,588 | 3,598 |
| Poland | -36% | 46.27% | 22,825 | 10,560 |
| Portugal | -65% | 58.99% | 31,596 | 18,637 |
| Singapore | -105% | 55.02% | 33,249 | 18,294 |
| South Africa | -74% | 52.44% | 27,403 | 14,370 |
| South Korea | -4% | 91.15% | 11,344 | 10,340 |
| Spain | -67% | 69.11% | 284,986 | 196,958 |
| Sweden | -93% | 13.91% | 35,727 | 4,971 |
| Switzerland | -101% | 91.90% | 30,796 | 28,300 |
| Taiwan | 4% | 95.24% | 441 | 420 |
| Thailand | -36% | 96.08% | 3,065 | 2,945 |
| U.S. | -56% | 28.20% | 1,768,346 | 498,720 |
| United Kingdom | -82% | 0.05% | 269,127 | 135 |
| Vietnam | 15% | 85.02% | 327 | 278 |
Mobility data as of May 21, 2020 (Latest available). COVID-19 case data as of May 29, 2020.
In the main scatterplot visualization, we’ve taken things a step further, assigning these countries into four distinct quadrants:
1. High Mobility, High Recovery
High recovery rates are resulting in lifted restrictions for countries in this quadrant, and people are steadily returning to work.
New Zealand has earned praise for its early and effective pandemic response, allowing it to curtail the total number of cases. This has resulted in a 98% recovery rate, the highest of all countries. After almost 50 days of lockdown, the government is recommending a flexible four-day work week to boost the economy back up.
2. High Mobility, Low Recovery
Despite low COVID-19 related recoveries, mobility rates of countries in this quadrant remain higher than average. Some countries have loosened lockdown measures, while others did not have strict measures in place to begin with.
Brazil is an interesting case study to consider here. After deferring lockdown decisions to state and local levels, the country is now averaging the highest number of daily cases out of any country. On May 28th, for example, the country had 24,151 new cases and 1,067 new deaths.
3. Low Mobility, High Recovery
Countries in this quadrant are playing it safe, and holding off on reopening their economies until the population has fully recovered.
Italy, the once-epicenter for the crisis in Europe is understandably wary of cases rising back up to critical levels. As a result, it has opted to keep its activity to a minimum to try and boost the 65% recovery rate, even as it slowly emerges from over 10 weeks of lockdown.
4. Low Mobility, Low Recovery
Last but not least, people in these countries are cautiously remaining indoors as their governments continue to work on crisis response.
With a low 0.05% recovery rate, the United Kingdom has no immediate plans to reopen. A two-week lag time in reporting discharged patients from NHS services may also be contributing to this low number. Although new cases are leveling off, the country has the highest coronavirus-caused death toll across Europe.
The U.S. also sits in this quadrant with over 1.7 million cases and counting. Recently, some states have opted to ease restrictions on social and business activity, which could potentially result in case numbers climbing back up.
Over in Sweden, a controversial herd immunity strategy meant that the country continued business as usual amid the rest of Europe’s heightened regulations. Sweden’s COVID-19 recovery rate sits at only 13.9%, and the country’s -93% mobility rate implies that people have been taking their own precautions.
COVID-19’s Impact on the Future
It’s important to note that a “second wave” of new cases could upend plans to reopen economies. As countries reckon with these competing risks of health and economic activity, there is no clear answer around the right path to take.
COVID-19 is a catalyst for an entirely different future, but interestingly, it’s one that has been in the works for a while.
Without being melodramatic, COVID-19 is like the last nail in the coffin of globalization…The 2008-2009 crisis gave globalization a big hit, as did Brexit, as did the U.S.-China trade war, but COVID is taking it to a new level.
—Carmen Reinhart, incoming Chief Economist for the World Bank
Will there be any chance of returning to “normal” as we know it?

-

 Debt1 week ago
How Debt-to-GDP Ratios Have Changed Since 2000
-

 Markets2 weeks ago
Ranked: The World’s Top Flight Routes, by Revenue
-

 Countries2 weeks ago
Population Projections: The World’s 6 Largest Countries in 2075
-

 Markets2 weeks ago
The Top 10 States by Real GDP Growth in 2023
-

 Demographics2 weeks ago
The Smallest Gender Wage Gaps in OECD Countries
-

 United States2 weeks ago
Where U.S. Inflation Hit the Hardest in March 2024
-

 Green2 weeks ago
Top Countries By Forest Growth Since 2001
-

 United States2 weeks ago
Ranked: The Largest U.S. Corporations by Number of Employees