Healthcare
Ranked: Global Pandemic Preparedness by Country


Ranked: Global Pandemic Preparedness by Country
The world has experienced many pandemics throughout its history, but not every era has had the benefit of modern medicine and hindsight.
However, even with the readily available medical expertise and equipment that exists today, it is still unevenly distributed throughout the globe. Combine this with a highly interconnected global economy, and large populations are still at risk from infection.
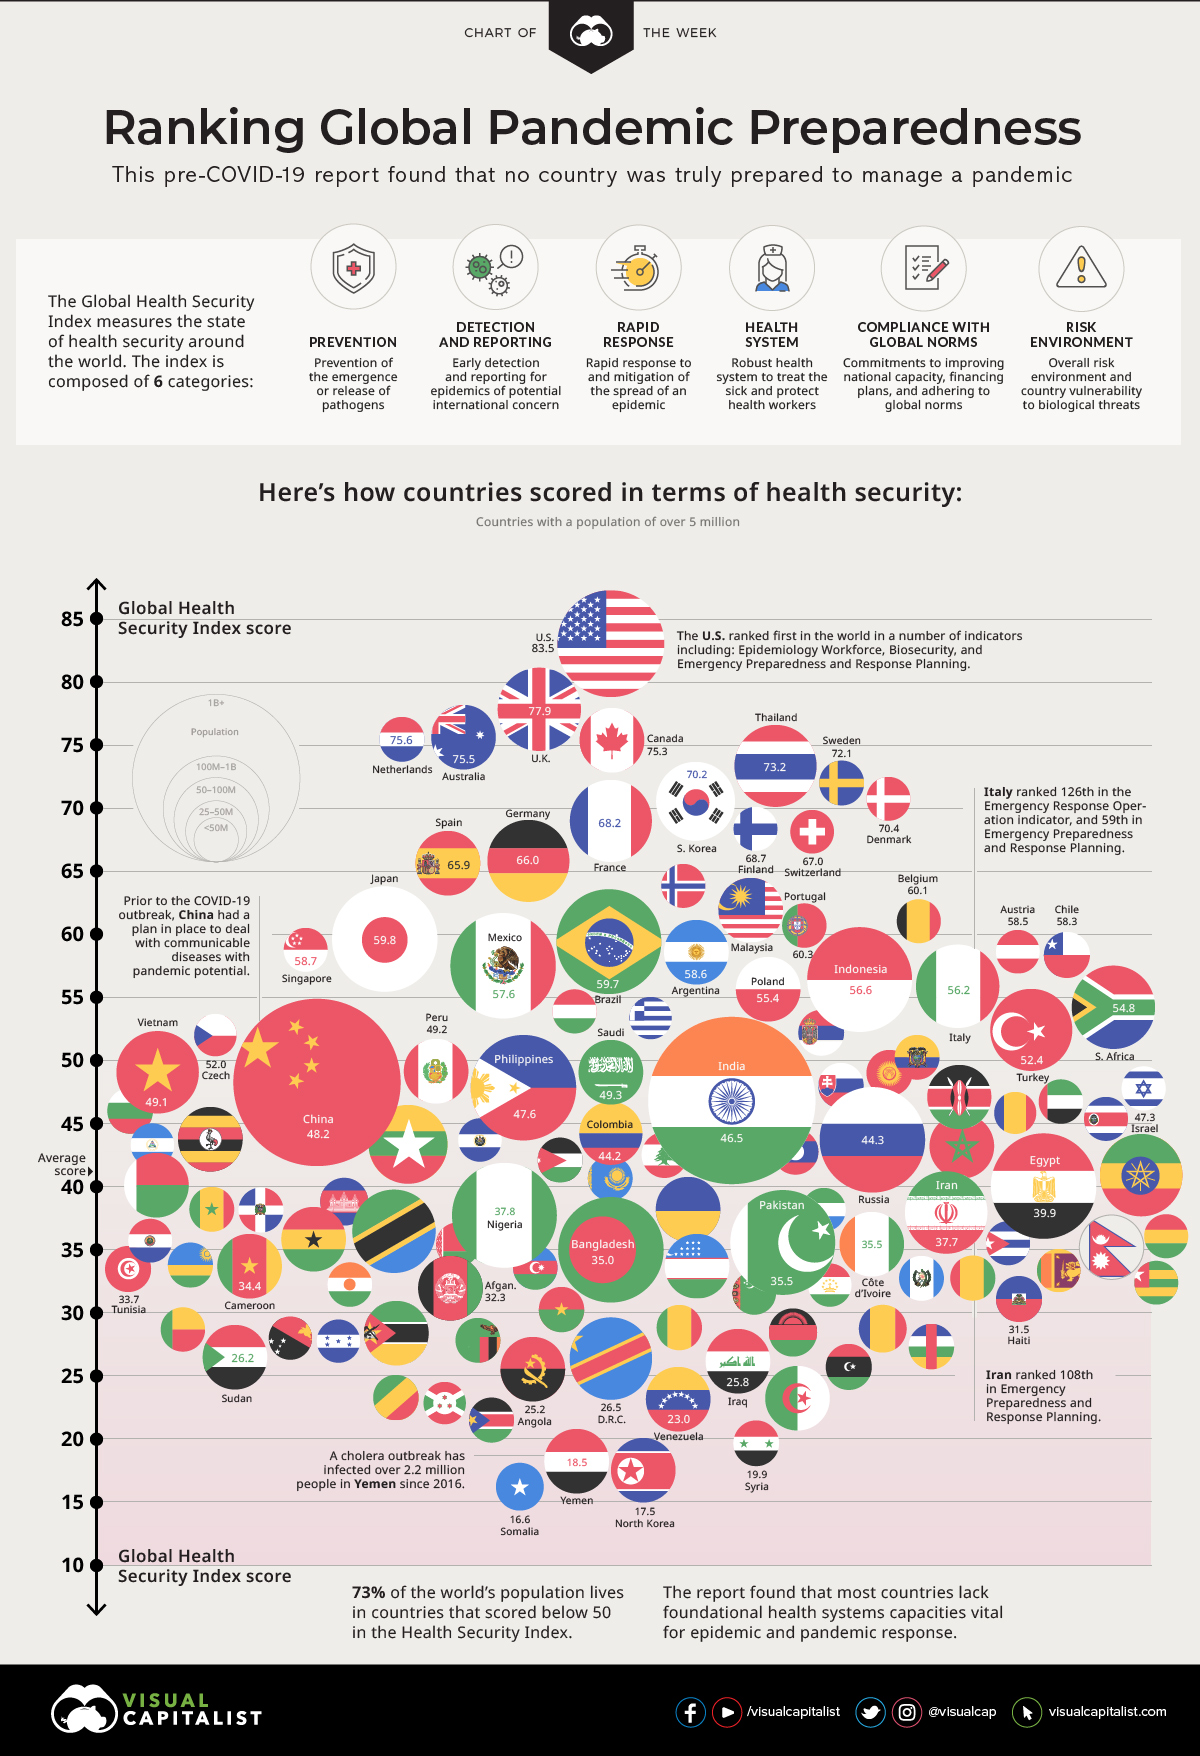
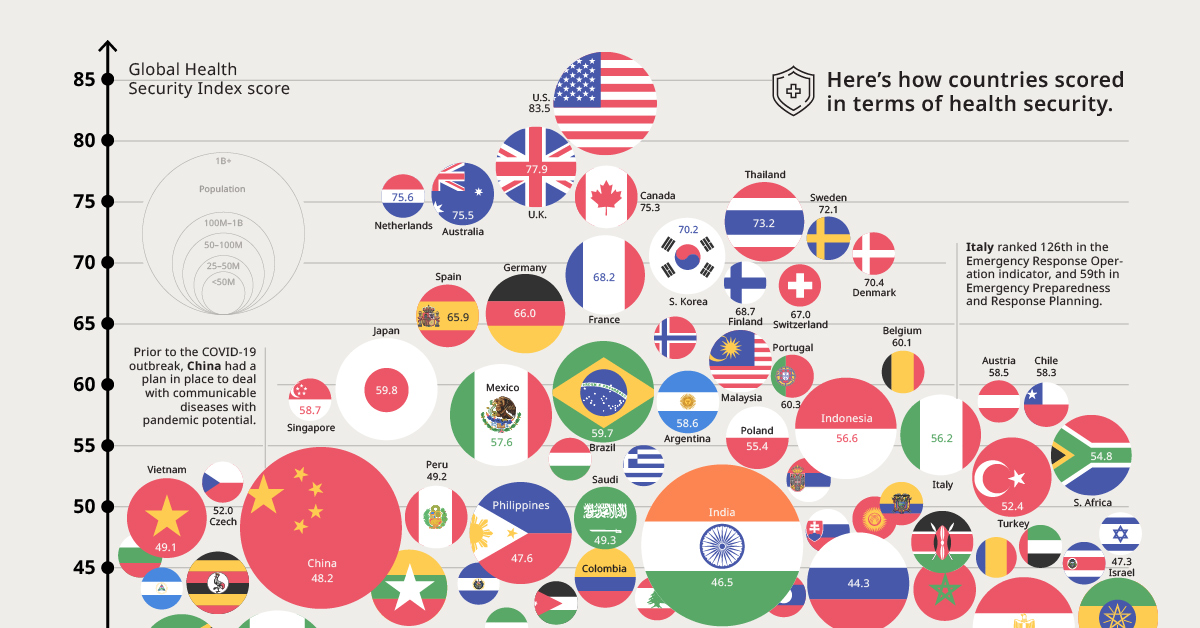
Today’s chart pulls data from the 2019 Global Health Security Index, which ranks 195 countries on health security. It reveals that while there were top performers, healthcare systems around the world on average are fundamentally weak—and not prepared for new disease outbreaks.
Pathways for Commerce and Disease
Modern transportation and trade have linked the farthest stretches of the world to fuel a global economy. Physical distance plays less a limiting role and more an enabling one to form a flat world as Thomas Friedman put it, creating opportunities for commerce anywhere in the world.
A person can sell dishware from his home in Cusco, Peru, online to a customer in Muncie, Indiana, with products manufactured in China, from materials sourced in Africa.
While these connections sound sterile, there are people interacting with one another to procure, manufacture, package, and distribute the goods. The connections are not just through products, but also people and animals across many borders.
Now, add up the interactions within the global food supply chain with plants and livestock and tourism industries and place them under the pressures of climate change, urbanization, international mass displacement, and migration—and the volume and variety of opportunities for disease transmission and mutation becomes infinite.
The same pathways of global commerce become the transmission vectors for disease. A cough in Dubai can become a fever in London with one flight and one day.
You Cannot Manage What You Do Not Measure
Despite this, we still live with national healthcare systems that look inward towards national populations, with less of a focus on integrating what is happening with the outside world.
The Global Health Security (GHS) Index is the first comprehensive effort to assess and benchmark health security and related capabilities by nation, and it tracks six key factors to come up with an overall score for each of the 195 countries in the ranking:
- Prevention
Prevention of the emergence or release of pathogens - Detection and Reporting
Early detection and reporting for epidemics of potential international concern - Rapid Response
Capability of rapidly responding to and mitigating the spread of an epidemic - Health System
Sufficient and robust and health system to treat the sick and protect health workers - Compliance with Global Norms
Compliance with international norms by improving national capacity, financing plans to address gaps - Risk Environment
Risk environment and country vulnerability to biological threats
Note: The GHS Index is a project of the Nuclear Threat Initiative (NTI) and the Johns Hopkins Center for Health Security (JHU), and was developed with The Economist Intelligence Unit (EIU).
Country Overall Rankings
Overall, the rankings uncover a distressing insight. Global preparedness for both epidemics and pandemics is weak, with the average score in the index sitting at 40.2 out of 100.
The countries with the highest scores have effective governance and politics systems in place, while those with the lowest scores fall down for their inadequate healthcare systems—even among high-income countries.
Here are the 50 highest-ranking countries in the index:
| Rank | Country | GHS Index Score |
|---|---|---|
| #1 | 🇺🇸 United States | 83.5 |
| #2 | 🇬🇧 United Kingdom | 77.9 |
| #3 | 🇳🇱 Netherlands | 75.6 |
| #4 | 🇦🇺 Australia | 75.5 |
| #5 | 🇨🇦 Canada | 75.3 |
| #6 | 🇹🇭 Thailand | 73.2 |
| #7 | 🇸🇪 Sweden | 72.1 |
| #8 | 🇩🇰 Denmark | 70.4 |
| #9 | 🇰🇷 South Korea | 70.2 |
| #10 | 🇫🇮 Finland | 68.7 |
| #11 | France | 68.2 |
| #12 | Slovenia | 67.2 |
| #13 | Switzerland | 67 |
| #14 | Germany | 66 |
| #15 | Spain | 65.9 |
| #16 | Norway | 64.6 |
| #17 | Latvia | 62.9 |
| #18 | Malaysia | 62.2 |
| #19 | Belgium | 61 |
| #20 | Portugal | 60.3 |
| #21 | Japan | 59.8 |
| #22 | Brazil | 59.7 |
| #23 | Ireland | 59 |
| #24 | Singapore | 58.7 |
| #25 | Argentina | 58.6 |
| #26 | Austria | 58.5 |
| #27 | Chile | 58.3 |
| #28 | Mexico | 57.6 |
| #29 | Estonia | 57 |
| #30 | Indonesia | 56.6 |
| #31 | Italy | 56.2 |
| #32 | Poland | 55.4 |
| #33 | Lithuania | 55 |
| #34 | South Africa | 54.8 |
| #35 | Hungary | 54 |
| #35 | New Zealand | 54 |
| #37 | Greece | 53.8 |
| #38 | Croatia | 53.3 |
| #39 | Albania | 52.9 |
| #40 | Turkey | 52.4 |
| #41 | Serbia | 52.3 |
| #42 | Czech Republic | 52 |
| #42 | Georgia | 52 |
| #44 | Armenia | 50.2 |
| #45 | Ecuador | 50.1 |
| #46 | Mongolia | 49.5 |
| #47 | Kyrgyz Republic | 49.3 |
| #47 | Saudi Arabia | 49.3 |
| #49 | Peru | 49.2 |
| #50 | Vietnam | 49.1 |
You can view the complete rankings of all 195 countries on the GHS Index website.
Interestingly, 81% of countries score in the bottom tier for indicators related to biosecurity—and worse, 85% of countries show no evidence of having completed a biological threat-focused simulation exercise in conjunction with the World Health Organization (WHO) in the past year.
Confirmed COVID-19 Cases vs. Global Health Security Score
Many healthcare systems have had their security tested with the outbreak of COVID-19.
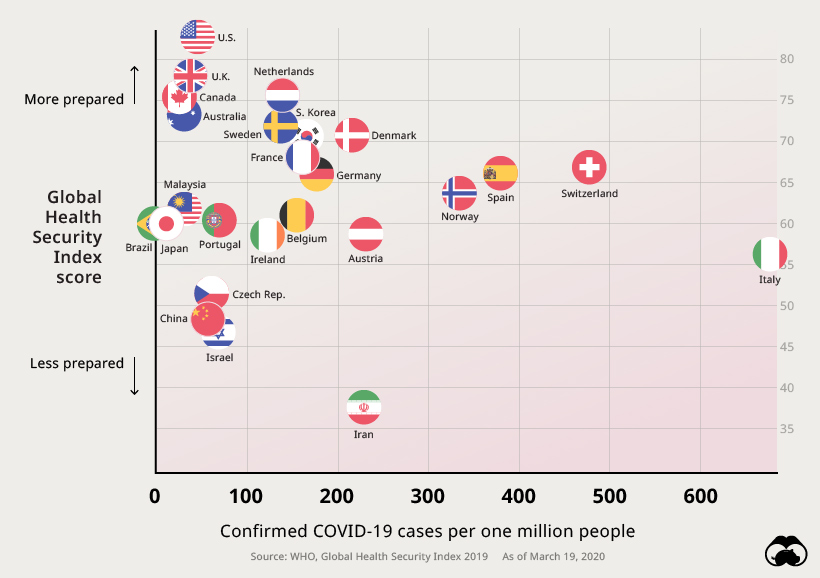
Although it is still extremely early, there appears to be a relationship between a nation’s health security and its ability to cope with pandemics.
Takeaways: A World Unprepared
While there may be top performers relative to other countries, the overall picture paints a grim picture that foreshadowed the current crisis we are living through.
“It is likely that the world will continue to face outbreaks that most countries are ill positioned to combat. In addition to climate change and urbanization, international mass displacement and migration—now happening in nearly every corner of the world—create ideal conditions for the emergence and spread of pathogens.” – The Global Health Security Index, 2019
The report outlined eight critical insights about global health security in 2019 that reveal some of the problems countries are now facing.
- National health security is fundamentally weak globally. No country is fully prepared for epidemics or pandemics, and every country has important gaps to address.
- Countries are not prepared for a globally catastrophic biological event.
- There is little evidence that most countries have tested important health security capacities or shown that they would be functional in a crisis.
- Most countries have not allocated funding from national budgets to fill identified preparedness gaps.
- More than half of countries face major political and security risks that could undermine national capability to combat biological threats.
- Most countries lack basic health systems capacities critical for epidemic and pandemic response.
- Coordination and training are inadequate among veterinary, wildlife, and public health professionals and policymakers.
- Improving country compliance with international health and security norms is essential.
A Stark Reality
The intention of the Global Health Security Index is to encourage improvements in the planning and response to one of the world’s most omnipresent risks–infectious disease outbreaks. When this report was released in 2019, it revealed that even the highest ranking nations still had gaps to fill in preparing for a pandemic.
Of course, hindsight is 20/20. The COVID-19 outbreak has served as a wake-up call to health organizations and governments around the world. Once all of the curves have been flattened, the next version of this report will undoubtedly be viewed with renewed interest.


Healthcare
The Cost of an EpiPen in Major Markets
This visualization compares EpiPen prices around the world, with the U.S. having the highest prices by far.


The Cost of an EpiPen in Major Markets
This was originally posted on our Voronoi app. Download the app for free on iOS or Android and discover incredible data-driven charts from a variety of trusted sources.
EpiPens are auto-injectors containing epinephrine, a drug that can treat or reverse severe allergic reactions, potentially preventing death.
The global epinephrine market was valued at $1.75 billion in 2022 and is projected to reach $4.08 billion by 2030. North America represents over 60% of the market.
EpiPens, however, can be prohibitively expensive in some regions.
In this graphic, we present estimated EpiPen prices in major global markets, compiled by World Population Review and converted to U.S. dollars as of August 2023.
Why are U.S. Prices so High?
The U.S. stands out as the most expensive market for EpiPens, despite over 1 million Americans having epinephrine prescriptions. After Mylan (now part of Pfizer) acquired the rights to produce EpiPens in the U.S. in 2007, the cost of a two-pack skyrocketed to $600, up from about $60.
| Country | Price (USD) |
|---|---|
| 🇺🇸 U.S. | 300* |
| 🇯🇵 Japan | 98 |
| 🇩🇪 Germany | 85 |
| 🇨🇦 Canada | 80 |
| 🇫🇷 France | 76 |
| 🇦🇺 Australia | 66 |
| 🇬🇧 UK | 61 |
| 🇮🇳 India | 30 |
*Per unit cost. Commonly sold as a two-pack, meaning total cost is equal to $600
Former Mylan CEO Heather Bresch defended the price hikes to Congress, citing minimal profit margins. Mylan eventually settled with the U.S. government for a nine-figure sum.
Notably, EpiPens are available at a fraction of the cost in other developed countries like Japan, Germany, and Canada.
Making EpiPens More Affordable
Efforts to improve EpiPen affordability are underway in several U.S. states. For instance, the Colorado House approved a $60 price cap on epinephrine, now under review by the state Senate.
Similar measures in Rhode Island, Delaware, Missouri, and Vermont aim to ensure insurance coverage for epinephrine, which is not currently mandatory, although most health plans cover it.

-

 Mining2 weeks ago
Charted: The Value Gap Between the Gold Price and Gold Miners
-

 Real Estate1 week ago
Ranked: The Most Valuable Housing Markets in America
-

 Business1 week ago
Charted: Big Four Market Share by S&P 500 Audits
-

 AI1 week ago
The Stock Performance of U.S. Chipmakers So Far in 2024
-

 Misc1 week ago
Almost Every EV Stock is Down After Q1 2024
-

 Money2 weeks ago
Where Does One U.S. Tax Dollar Go?
-

 Green2 weeks ago
Ranked: Top Countries by Total Forest Loss Since 2001
-

 Real Estate2 weeks ago
Visualizing America’s Shortage of Affordable Homes