

Asia dominates this ranking of the world's largest EV battery manufacturers in 2023.


We illustrate how much the highest earning athletes across seven different sports make, and where they get their money from.


China has grown its nuclear capacity over the last decade, now ranking second on the list of top nuclear energy producers.


The price of gold has set record highs in 2024, but how has this precious metal performed relative to the S&P 500?


This graphic highlights France and Canada as the global leaders when it comes to generating carbon tax revenue.


We visualized the top U.S. companies by employees, revealing the massive scale of retailers like Walmart, Target, and Home Depot.


One country is taking reforestation very seriously, registering more than 400,000 square km of forest growth in two decades.


Nvidia is coming for Intel’s crown. Samsung is losing ground. AI is transforming the space. We break down revenue for semiconductor companies.


Which of the Big Four accounting firms take home the most audit fees from their S&P 500 clients?


The Nvidia rocket ship is refusing to slow down, leading the pack of strong stock performance for most major U.S. chipmakers.


While the price of gold has reached new record highs in 2024, gold mining stocks are still far from their 2011 peaks.


This graphic breaks down America's most preferred smartphone brands, according to a December 2023 consumer survey.


We compare America's top 10 companies by revenue in 1994 and 2023 to see how the business landscape has changed.


See how the Nasdaq debut of Trump Media & Technology Group has influenced Trump's net worth, according to Forbes estimates.


We visualize the results of a YouGov survey that determined the most popular beers among each U.S. generation.


Just three countries accounted for 40% of global oil production last year.


In this graphic we rank the top Swiss watch brands, based on their estimated 2023 market share.


This graphic compares the nominal vs. inflation-adjusted value of the U.S. minimum wage, from 1940 to 2023.


With trillion dollar valuations becoming more common, we've compared the five biggest companies by stock exchange.


Heavily armed and armored, the modern tank is a versatile and mobile weapons platform, and a critical piece of contemporary warfare.


Currently, Russia is the largest foreign supplier of nuclear power fuel to the U.S.


Here are the banks with the highest concentration of commercial real estate loans as the sector faces mounting pressures.
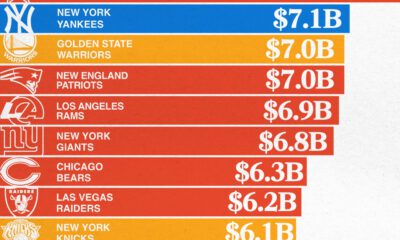

The most valuable sports teams in 2024 range from NBA and MLB teams to renowned soccer clubs in Europe, but the NFL reigned supreme.


Here are the largest cocoa producing countries globally—from Côte d'Ivoire to Brazil—as cocoa prices hit record highs.


We visualize which countries have the biggest share of world forests by area—and while country size plays a factor, so too, does the environment.


We visualize the distribution of the world's uranium reserves by country, with 3 countries accounting for more than half of total reserves.


Together, the top five countries with the largest forests account for more than half of the world’s entire forest cover.


We visualize some of the bigger tech layoffs in the year so far, from video game software provider Unity to big tech bastion Google.
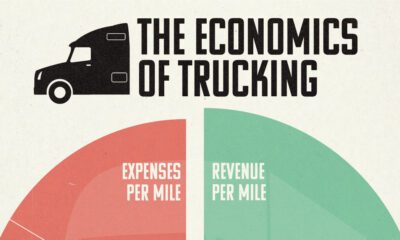

Trucking companies have narrow margins given high costs of labor and fuel. Here's how their revenue and expenses break down.


To offer perspective on the population of U.S. states, this map compares them to countries that share similar population sizes.


The U.S. Geological Survey estimates that in 2022, China was the world’s leading producer of 30 out of 50 entries on the U.S. critical minerals list.
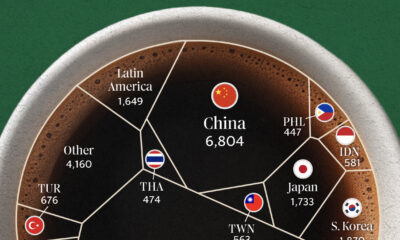

Starbucks has nearly 40,000 stores in 80 different countries? But which countries account for the lion's share of them?
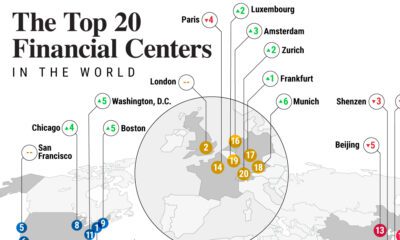

Where are the leading global financial centers in today's evolving economic landscape? Here are the top commerce hubs in 2023.
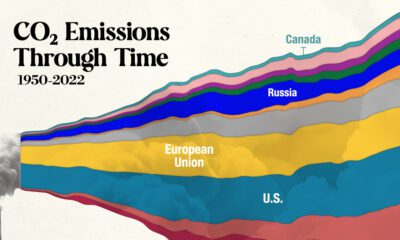

In this streamgraph, we break down global CO2 emissions between 1950 and 2022 using data from Berkeley Earth and Global Carbon Project.
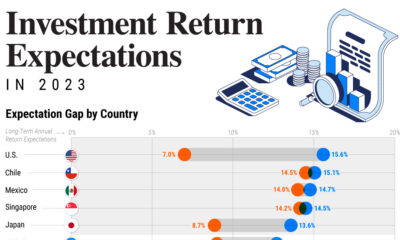

This graphic shows the gap in portfolio return expectations between investors and advisors around the world, revealing a range of market outlooks.


Media trust among Americans has reached its lowest point since Trump won the 2016 presidential election.
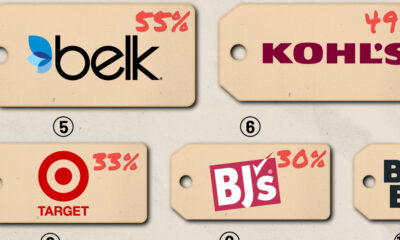

To compile this list, WalletHub analyzed over 3,500 deals from 13 U.S. retailers to calculate their average black Friday discounts for 2023.
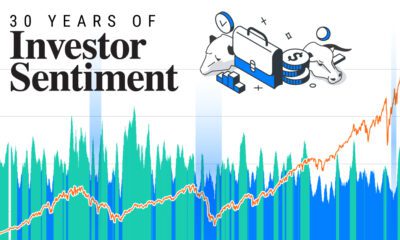

Here's how investor sentiment has shifted over the last three decades, from the Dotcom boom to present-day.
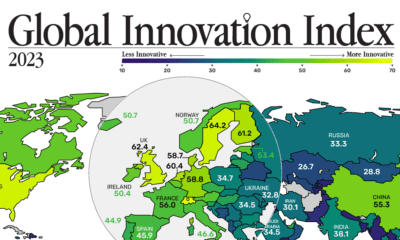

In this graphic, we show the most innovative countries in the world, and the factors underlying their innovative strength.
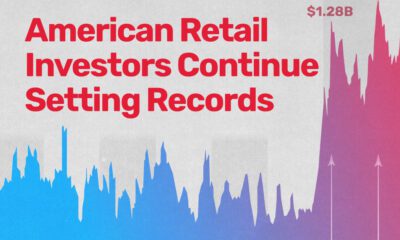

Considered a side show in the stock market for much of the last decade, U.S. retail investors are now breaking records.


Which foods are linked with high CO2 emissions and high water use? We look at the environmental impacts of food production in this chart.
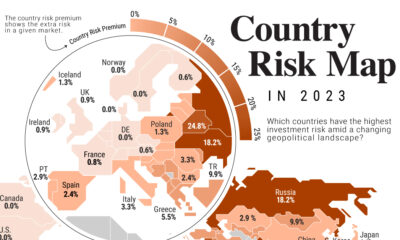

Where are some of the riskiest countries to invest in the world? Where are some of the safest? This graphic shows country risk in 2023.


Comparing average Scope 1 emission intensities by sector according to an analysis done by S&P Global Inc.


Data from the World Trade Organization highlights the world's 10 largest automotive exporters in 2022.
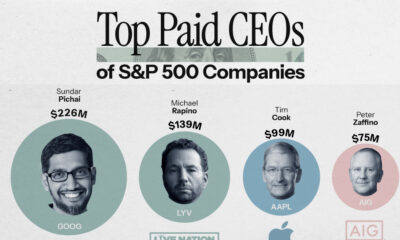

This graphic reveals the top 20 highest paid CEOs in the S&P 500 from Sundar Pichai to Jamie Dimon.
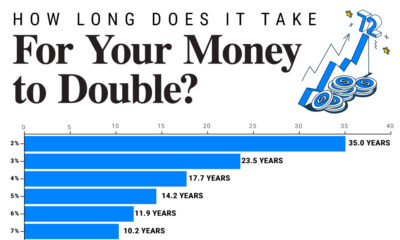

Since 1949, the S&P 500 has doubled in value 10 times. We show how long it takes to double your money across a range of annualized...
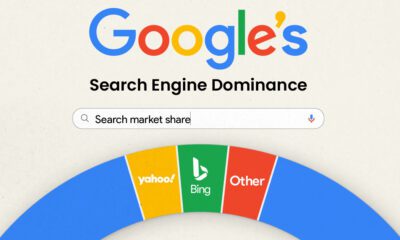

Google’s dominant search engine market share has prompted the U.S. Justice Department to file a lawsuit over anticompetitive practices.
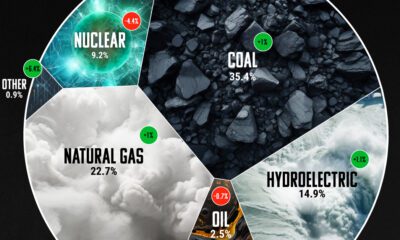

Coal still leads the charge when it comes to electricity, representing 35% of global power generation.
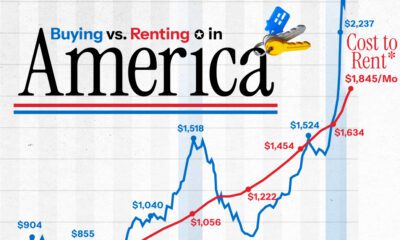

The U.S. has witnessed the biggest numerical gap in the monthly cost between buying a home and renting in over 50 years.


The generative AI boom is powered by processors. How have AI chip sales grown over the last two years among Nvidia vs AMD vs Intel?


