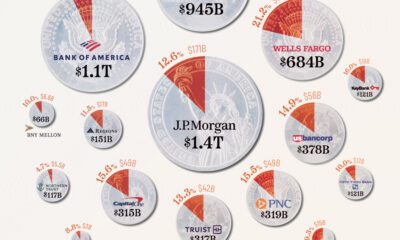
This graphic shows the 20 largest U.S. banks by assets, and their exposure to commercial real estate as a percentage...


click for more →


Scan with your phone's camera or QR code app to view
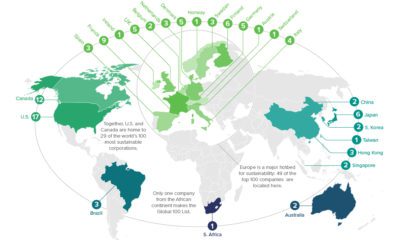

In the race towards a greener future, many corporations are playing an active role. Where are the world's most sustainable companies located?
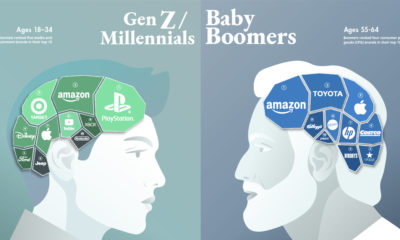

Can a brand transcend time and be all things to all people? This graphic seeks to find out by visualizing the most loved brands by generation.
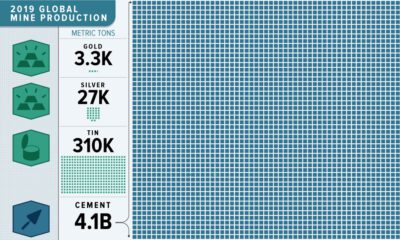

This massive infographic reveals the dramatic scale of 2019 non-fuel mineral global production.
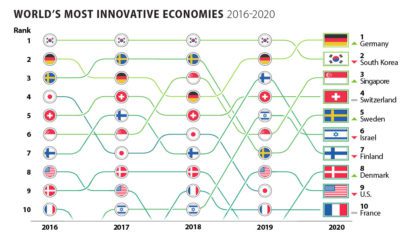

A country's ability to innovate helps it stay competitive on the global stage. Where are the most innovative economies, and how has the list changed?


Mining stocks are high-risk, high-reward. Here's what you want to see in a management team, and some of the characters you want to avoid.
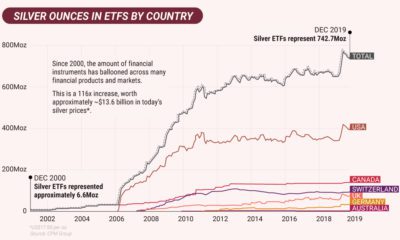

In the second part of the Silver Series, we show that the supply and demand fundamentals are potentially shaping up for a perfect storm in silver...
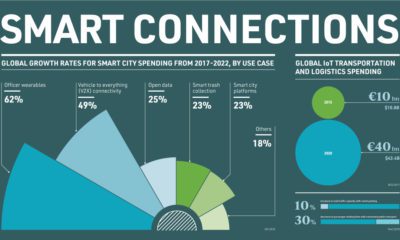

Spending on smart cities is ramping up, and it's being driven by the development and implementation of new IoT technologies.
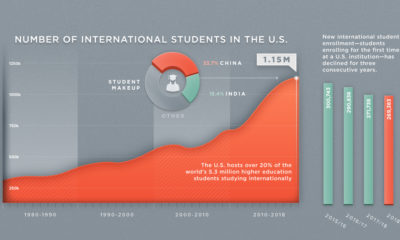

The U.S. has benefited from being the top destination for the world's international students, but new enrollments have begun to show signs of weakness.

Pledge before March 12th, 2020 to help us fund the book, and to join us behind-the-scenes on our new and exciting journey.
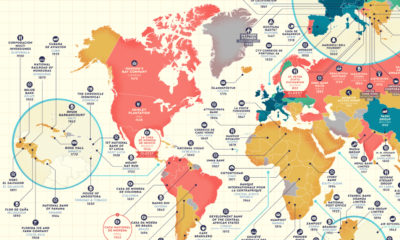

Which companies have stood the test of time? This detailed map highlights the oldest company in every country that is still in business.
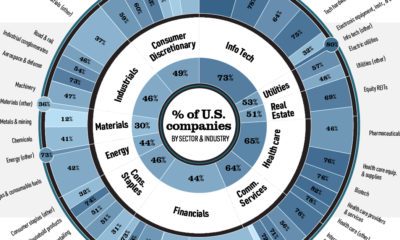

U.S.-based companies have a heavy weighting in global equity markets. In most industries, their market capitalization exceeds 50% of the total.
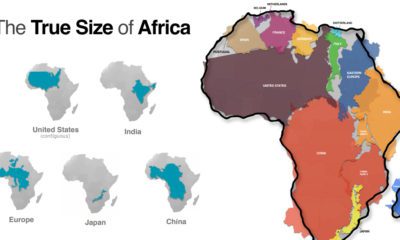

Common map projections warp our view of the globe. This graphic reveals the true size of Africa, which could fit the U.S., China, India, and more.
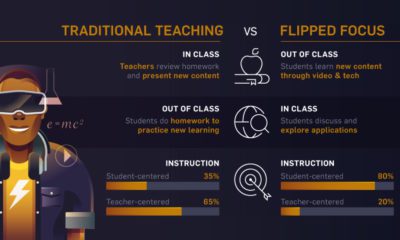

From artificial intelligence to chatbots, this infographic visualizes what the future of education could look like. Can schools keep up with the times?
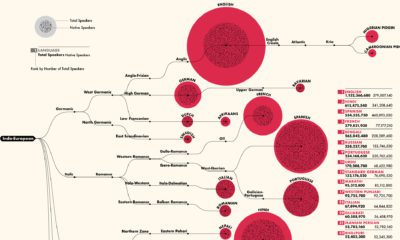

This detailed visualization breaks down the 100 most spoken languages around the world, by total and native speakers. Can you find yours on the list?
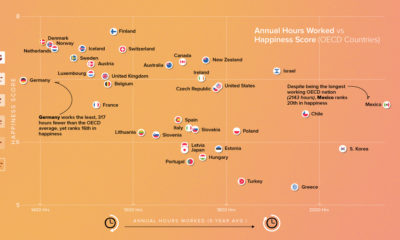

The idea of a shorter workweek sounds enticing to most, but would it actually lead to a happier population? We look at the data so far.
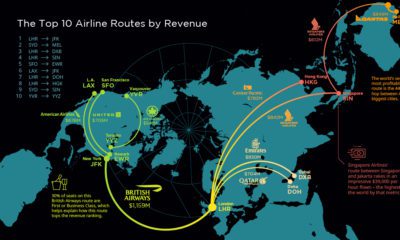

This visualization tracks the high-value routes that generate the most revenue for airlines – primarily links between the world's financial centers
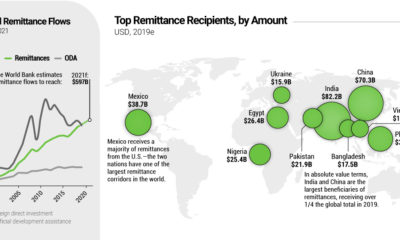

Every year, migrant workers send billions of dollars back to their home countries—reaching $550 billion in 2019. Where do these remittance flows wind up?


